


 Abstract
 HTML
HTML Reference
 Related
 PDF
PDF


-
A hypernucleus contains one or more strange quarks, and in the most common type of hypernucleus, a neutron is replaced by a
$ \Lambda $ hyperon. The first hypernucleus was discovered by Marion Danysz and Jerzy Pniewski in 1952 in a balloon-flown emulsion plate [1]. Many other hypernuclei were observed during the following years in emulsion experiments [2, 3]. The hypertriton is the lightest hypernucleus, and is composed of a proton, a neutron, and a$ \Lambda $ hyperon. The antimatter partner of the hypertriton was discovered in a heavy ion collision experiment by the STAR collaboration at the Relativistic Heavy Ion Collider (RHIC) at Brookhaven National Laboratory in 2010 [4], and confirmed in 2015 by the ALICE collaboration at the Large Hadron Collider (LHC) at CERN [5]. The hyperon-nucleon (YN) interaction plays an important role in understanding the strong nuclear force [6, 7], and since hyperons may exist in the core of neutron stars [8], the YN interaction is also of importance for the study of neutron star properties [8-10]. Hyperon-nucleon scattering would be a good tool to explore the YN interaction, however it is very challenging to obtain stable hyperon beams due to the very short lifetime of the hyperon. Hypernuclei are a natural YN interaction system and thus their lifetime and binding energy have a direct connection to the strength of the YN interaction [11-13]. A precise determination of the hypernuclear lifetime and binding energy can serve as a critical input for theoretical studies of the strong force and neutron star interior [6-12, 14-16].Although the data for hyperon-nucleon scattering is lacking, measurements of the
$ \Lambda $ separation energy$ B_\Lambda $ for$ \Lambda $ hypernuclei have been available from the nuclear emulsion experiments [2, 3, 9, 17-20]. The separation energy$ B_\Lambda $ is defined as ($ M_\Lambda + M_{\rm core} - M_{\rm hypernucleus}) c^2 $ , where$ M_{\rm{hypernucleus}} $ ,$ M_{\Lambda} $ and$ M_{\rm{core}} $ are the mass of the hypernucleus,$ \Lambda $ hyperon, and of the nuclear core of the hypernucleus. The$ B_\Lambda $ measurements provided by emulsion experiments need to be revisited because the masses of particles and nuclei that were used in the original publications are different from the contemporary best estimates from PDG (Particle Data Group) [21] and AMDC (Atomic Mass Data Center, located at the Institute of Modern Physics, Chinese Academy of Sciences, Lanzhou) [22, 23]. A case in point is a recent improved measurement of$ B_{\Lambda} $ of the hypertriton, reported by the STAR collaboration in 2019 [24, 25], where the best estimate is significantly larger than the previous commonly cited value published in 1973 [20]. However, the early measurements of$ B_\Lambda $ have been used as critical input for theoretical research. For example, Ref. [11] applied the$\not \!\pi $ EFT approach at LO to s-shell$ \Lambda $ hypernuclei with a precise few-body stochastic variational method to address the over-binding problem of$ ^{5}_{\Lambda} $ He. In another relevant example, Ref. [10] considered two different models of three-body force constrained by the$ \Lambda $ separation energy of medium mass hypernuclei, but the authors obtained dramatically different results for the maximum mass of neutron stars using different models of the three-body force. Stronger constraints for the YN interaction are necessary to properly understand the role of hyperons in neutron stars. From this point of view, it is timely and highly desirable to recalibrate these early measurements using the contemporary best estimates of the mass of particles and nuclei [21-23], so as to provide more accurate constraints for contemporary studies [9, 11, 26, 27]. -
In the emulsion experiments,
$ B_\Lambda $ was defined as [2, 3]:$ B_\Lambda = Q_0 - Q, $

(1) ${Q_0} = {M_{F'}} + {M_\Lambda } - \sum\limits_i {{M_i}}, $

(2) where Q is the total kinetic energy released when a hypernucleus decays through a mesonic decay channel, F' represents the nuclear core of the hypernucleus, M is the mass of a particle or nucleus, and the subscript i refers to the
$ i{\rm th} $ decay daughter. Q was determined using the range-energy relation in emulsions [2, 3, 18-20, 28], while$ Q_{0} $ was directly determined from the masses of particles and nuclei available at the time of publication. A series of papers for nuclide masses was published at that time (in 1954 [29], 1960 [30, 31], 1962 [32], 1965 [33], 1971 [34], and 1977 [35]), and the nuclide masses published in 1960 [30, 31] were used in Ref. [17] for the$ B_{\Lambda} $ measurements. Ref. [17] is by the same corresponding author as Refs. [18-20], and we assume here that the masses used in 1967 [18] and 1968 [19] were taken from the nuclide mass paper published in 1965 [33]. We also assume that the masses used in 1973 [20] were taken from the nuclide mass paper published in 1971 [34]. The masses of$ \pi^{-} $ , proton,$ \Lambda $ , and the relevant nuclei used in the past and in 2019 are listed in Table 1. From Table 1, it is evident that the early masses of particles and nuclei are different from the current values. Consequently, the$ Q_{0} $ values used in 1967, 1968, and 1973 were such that the original published$ B_\Lambda $ measurements were not as accurate as they could be. Fortunately, the early$ B_\Lambda $ values can be recalibrated by comparing the difference in$ Q_{0} $ between the old publications and modern numbers. According to the masses listed in Table 1,$ Q_{0} $ for light hypernuclei with mass number A = 3 - 15 is calculated for specific decay channels for the data from 1967, 1968, 1973 and 2019. Table 2 presents$ Q_{0} $ and$ \Delta Q_{0} $ , where the latter is the difference between$ Q_{0} $ for 2019 and$ Q_{0} $ in the specific earlier year.$ \Delta Q_{0} $ is used for recalibrating$ B_{\Lambda} $ measured in 1967, 1968 and 1973. The original$ B_{\Lambda} $ is recalibrated for each decay channel listed in Table 2. After recalibration, we provide more precise estimates of the$ B_\Lambda $ values. Table 3 lists the original and recalibrated$ B_\Lambda $ values for a combination of all available decay channels for the listed$ \Lambda $ hypernuclei with mass numbers A = 3-15.Particle/
NucleusNPB1 (1967) [18] NPB4 (1968) [19] NPB52 (1973) [20] 2019 $ \pi^{-} $ 

139.59 [17] 139.58 [40] 139.58 [41] 139.57 [21] p 938.26 [17] 938.26 [40] 938.26 [41] 938.27 [21] $ \Lambda $ 

1115.44 [19] 1115.57 [19] 1115.57 [20] 1115.68 [21] d 1875.51 1875.51 1875.63 1875.61 t 2808.76 2808.76 2808.95 2808.92 3He 2808.23 2808.23 2808.42 2808.39 4He 3727.17 3727.17 3727.42 3727.38 5He 4667.64 4667.64 4667.89 4667.68 6He 5605.22 5605.22 5605.60 5605.53 6Li 5601.20 5601.20 5601.58 5601.52 6Be 5604.97 5604.97 5605.35 5605.30 7Li 6533.46 6533.46 6533.90 6533.83 7Be 6533.81 6533.81 6534.25 6534.18 8Li 7470.94 7470.94 7471.45 7471.36 8Be 7454.43 7454.43 7454.93 7454.85 8B 7471.90 7471.90 7472.40 7472.32 9Be 8392.28 8392.28 8392.84 8392.75 9B 8392.83 8392.83 8393.40 8393.31 10Be 9324.97 9324.97 9325.60 9325.50 10B 9323.91 9323.91 9324.54 9324.44 11B 10251.96 10251.96 10252.66 10252.55 11C 10253.43 10253.43 10254.13 10254.02 12C 11174.23 11174.23 11174.98 11174.86 13C 12108.79 12108.79 12109.61 12109.48 13N 12110.50 12110.50 12111.32 12111.19 14N 13039.46 13039.46 13040.34 13040.20 15O 13970.39 13970.39 13971.33 13971.18 Table 1. The masses of elementary particles and nuclei used in the past publications and in 2019. The nuclear masses used in 1967 and 1968 are taken from Refs. [29,30,33], those used in 1973 are taken from Ref. [34], while those used in 2019 are taken from Refs. [22,23]. All masses are in units of MeV/
$ {\rm c}^{2}. $ Hypernucleus Decay modes NPB1 (1967) [18] NPB4 (1968) [19] NPB52 (1973) [20] 2019 $ Q_{0} $ 

$ \Delta Q_{0} $ 

$ Q_{0} $ 

$ \Delta Q_{0} $ 

$ Q_{0} $ 

$ \Delta Q_{0} $ 

$ Q_{0} $ 

$ ^{3}_{\Lambda} $ H

$ \pi^{-} $ + 3He

43.13 0.20 43.27 0.06 43.20 0.13 43.33 $ \pi^{-} $ + p + d

37.59 0.25 37.73 0.11 37.73 0.11 37.84 $ ^{4}_{\Lambda} $ H

$ \pi^{-} $ + 4He

57.44 0.21 57.58 0.07 57.52 0.13 57.65 $ \pi^{-} $ + p + t

37.59 0.25 37.73 0.11 37.73 0.11 37.84 $ \pi^{-} $ + d + d

33.59 0.22 33.73 0.08 33.68 0.13 33.81 4He π− + p + 3 + p + 3He 37.59 0.25 37.73 0.11 37.73 0.11 37.84 $ \pi^{-} $ + p + p + d

32.05 0.30 32.19 0.16 32.26 0.09 32.35 $ ^{5}_{\Lambda} $ He

$ \pi^{-} $ + p + 4He

37.59 0.25 37.73 0.11 37.73 0.11 37.84 $ \pi^{-} $ + d + 3He

19.28 0.21 19.42 0.07 19.36 0.13 19.49 $ \pi^{-} $ + p + p + t

17.74 0.29 17.88 0.15 17.94 0.09 18.03 $ \pi^{-} $ + p + d + d

13.74 0.26 13.88 0.12 13.89 0.11 14.00 $ ^{6}_{\Lambda} $ He

$ \pi^{-} $ + d + 4He

40.81 −0.01 40.95 −0.15 40.83 −0.03 40.80 $ ^{7}_{\Lambda} $ He

$ \pi^{-} $ + 7Li

47.61 0.20 47.75 0.06 47.69 0.12 47.81 π− + p + 6He + 6He 37.59 0.25 37.73 0.11 37.73 0.11 37.84 $ \pi^{-} $ + t + 4He

45.14 0.20 45.28 0.06 45.22 0.12 45.34 $ \pi^{-} $ + p + t + t

25.29 0.24 25.43 0.10 25.43 0.10 25.53 $ ^{7}_{\Lambda} $ Li

$ \pi^{-} $ + p + 6Li

37.59 0.25 37.73 0.11 37.73 0.11 37.84 $ \pi^{-} $ + 3He +4He

41.65 0.21 41.79 0.07 41.73 0.13 41.86 $ \pi^{-} $ + p + d + 4He

36.11 0.26 36.25 0.12 36.26 0.11 36.37 $ ^{7}_{\Lambda} $ Be

$ \pi^{-} $ + p + p + p + 4He

38.87 0.35 39.01 0.21 39.14 0.08 39.22 $ ^{8}_{\Lambda} $ Li

$ \pi^{-} $ + 4He + 4He

54.97 0.21 55.11 0.07 55.05 0.13 55.18 $ \pi^{-} $ + p + t +4He

35.12 0.25 35.26 0.11 35.26 0.11 35.37 $ \pi^{-} $ + d + d + 4He

31.12 0.22 31.26 0.08 31.21 0.13 31.34 π−+ d + 6Li+ 6Li 32.60 0.21 32.74 0.07 32.68 0.13 32.81 $ ^{8}_{\Lambda} $ Be

$ \pi^{-} $ + 8B

37.76 0.21 37.90 0.07 37.84 0.13 37.97 $ \pi^{-} $ + p + 7Be

37.59 0.25 37.73 0.11 37.73 0.11 37.84 $ \pi^{-} $ + p + 3He + 4He

36.00 0.25 36.14 0.11 36.14 0.11 36.25 $ \pi^{-} $ + p + p + 6Li

31.94 0.29 32.08 0.15 32.14 0.09 32.23 $ \pi^{-} $ + p + p + d + 4He

30.46 0.30 30.60 0.16 30.67 0.09 30.76 $ ^{9}_{\Lambda} $ Li

$ \pi^{-} $ + 9Be

54.51 0.21 54.65 0.07 54.60 0.12 54.72 $ \pi^{-} $ + p + 8Li

37.59 0.25 37.73 0.11 37.73 0.11 37.84 $ \pi^{-} $ + t + 6Li

36.83 0.20 36.97 0.06 36.91 0.12 37.03 $ ^{9}_{\Lambda} $ Be

$ \pi^{-} $ + 9B

37.45 0.20 37.59 0.06 37.52 0.13 37.65 $ \pi^{-} $ + p + 4He + 4He

37.68 0.25 37.82 0.11 37.82 0.11 37.93 $ ^{9}_{\Lambda} $ B

$ \pi^{-} $ + p +8B

37.59 0.25 37.73 0.11 37.73 0.11 37.84 $ \pi^{-} $ + p + p + p +6Li

31.77 0.33 31.91 0.19 32.03 0.07 32.10 $ ^{10}_{\Lambda} $ Be

$ \pi^{-} $ + p + p + 8Li

20.67 0.29 20.81 0.15 20.86 0.10 20.96 $ ^{10}_{\Lambda} $ B

$ \pi^{-} $ + p + 9B

37.59 0.25 37.73 0.11 37.73 0.11 37.84 $ \pi^{-} $ + p + p + 4He + 4He

37.82 0.30 37.96 0.16 38.03 0.09 38.12 Continued on next page Table 2. The
$ Q_{0} $ and$ \Delta Q_{0} $ values for the year indicated at the top of each column.$ \Delta Q_{0} $ denotes$ Q_{0} $ in 2019 minus$ Q_{0} $ in the specified year. All$ Q_{0} $ and$ \Delta Q_{0} $ values are in units of MeV/$ {\rm c}^{2} $ .Table 2-continued from previous page Hypernucleus Decay modes NPB1 (1967) [18] NPB4 (1968) [19] NPB52 (1973) [20] 2019 $ Q_{0} $ $ \Delta Q_{0} $ $ Q_{0} $ $ \Delta Q_{0} $ $ Q_{0} $ $ \Delta Q_{0} $ $ Q_{0} $ $ ^{11}_{\Lambda} $ B

$ \pi^{-} $ + 11C

46.33 0.20 46.47 0.06 46.40 0.13 46.53 $ \pi^{-} $ + p + d + 4He + 4He

31.65 0.26 31.79 0.12 31.80 0.11 31.91 $ \pi^{-} $ + 4He + 7Be

38.78 0.21 38.92 0.07 38.86 0.13 38.99 $ \pi^{-} $ + 3He + 4He + 4He

37.19 0.21 37.33 0.07 37.27 0.13 37.40 $ \pi^{-} $ + p + 4He + 6Li

33.13 0.25 33.27 0.11 33.27 0.11 33.38 $ \pi^{-} $ + t + 8B

19.10 0.21 19.24 0.07 19.18 0.13 19.31 $ ^{12}_{\Lambda} $ B

$ \pi^{-} $ + 4He + 4He + 4He

46.30 0.22 46.44 0.08 46.39 0.13 46.52 $ ^{13}_{\Lambda} $ C

$ \pi^{-} $ + 13N

39.58 0.20 39.72 0.06 39.65 0.13 39.78 $ \pi^{-} $ + p + 4He + 4He + 4He

30.31 0.25 30.45 0.11 30.45 0.11 30.56 $ ^{15}_{\Lambda} $ N

$ \pi^{-} $ + 15O

44.92 0.21 45.06 0.07 45.00 0.13 45.13 Hypernucleus NPB1 (1967) [18] NPB4 (1968) [19] NPB52 (1973) [20] Original Recalibrated Original Recalibrated Original Recalibrated $ ^{3}_{\Lambda} $ H

0.20 ± 0.12 0.41 0.01 ± 0.07 0.08 0.15 ± 0.08 0.27 $ ^{4}_{\Lambda} $ H

2.13 ± 0.06 2.35 2.23 ± 0.03 2.31 2.08 ± 0.06 2.20 $ ^{4}_{\Lambda} $ He

2.20 ± 0.06 2.45 2.36 ± 0.04 2.47 2.42 ± 0.04 2.53 $ ^{5}_{\Lambda} $ He

3.08 ± 0.03 3.33 3.08 ± 0.02 3.19 3.17 ± 0.02 3.28 $ ^{6}_{\Lambda} $ He

4.09 ± 0.27 4.08 4.38 ± 0.19 4.23 4.42 ± 0.13 4.39 $ ^{7}_{\Lambda} $ He

4.67 ± 0.28 4.88 4.25 ± 0.25 4.34 No data No data $ ^{7}_{\Lambda} $ Li

5.46 ± 0.12 5.68 5.60 ± 0.07 5.67 5.64 ± 0.04 5.77 $ ^{7}_{\Lambda} $ Be

5.36 ± 0.23 5.71 5.06 ± 0.19 5.27 5.09 ± 0.11 5.17 $ ^{8}_{\Lambda} $ Li

6.72 ± 0.08 6.93 6.84 ± 0.06 6.91 6.81 ± 0.03 6.94 $ ^{8}_{\Lambda} $ Be

6.67 ± 0.16 6.89 6.87 ± 0.08 6.95 6.91 ± 0.07 7.02 $ ^{9}_{\Lambda} $ Li

8.27 ± 0.18 8.49 8.23 ± 0.19 8.34 8.59 ± 0.17 8.70 $ ^{9}_{\Lambda} $ Be

6.66 ± 0.08 6.88 6.62 ± 0.05 6.68 6.80 ± 0.03 6.93 $ ^{9}_{\Lambda} $ B

No data No data No data No data 7.89 ± 0.15 7.98 $ ^{10}_{\Lambda} $ Be

No data No data No data No data 9.30 ± 0.26 9.40 $ ^{10}_{\Lambda} $ B

No data No data No data No data 8.82 ± 0.12 8.93 $ ^{11}_{\Lambda} $ B

10.30 ± 0.14 10.51 9.99 ± 0.18 10.11 10.24 ± 0.06 10.37 $ ^{12}_{\Lambda} $ B

11.26 ± 0.16 11.48 10.95 ± 0.16 11.03 11.45 ± 0.07 11.58 $ ^{13}_{\Lambda} $ C

10.51 ± 0.51 10.71 No data No data 11.45 ± 0.12 11.57 $ ^{15}_{\Lambda} $ N

No data No data No data No data 13.59 ± 0.14 13.72 Table 3. The original and the recalibrated
$ \Lambda $ separation energy for hypernuclei data from 1967 [18], 1968 [19], and 1973 [20]. The listed errors are the reported statistical uncertainties only, and the recalibrated$ \Lambda $ separation energy should be considered as subject to the same errors as the original measurements. The$ \Lambda $ separation energy is in units of MeV.We note that the early emulsion measurements from 1968 and 1973 benefited from a compensating effect in normalizing the
$ B_{\Lambda} $ values to the measured mass of the$ \Lambda $ hyperon with the decay daughter$ \pi^{-} $ range of 1-2 cm in the same emulsion stack [19, 20]. Because the mass of$ \Lambda $ hyperon and Q appear with opposite signs in Eq. (1), it was argued that the systematic errors arising from the uncertainties in both the range-energy relation and the emulsion density are largely offset by the normalization procedure, and a small systematic error of 0.04 MeV was determined for the early measurements [19, 20, 36-38]. Although an identical$ \Lambda $ mass was measured in 1968 and 1973, the differences of$ B_\Lambda $ between measurements in these two years are large (up to 0.50 ± 0.17 (stat.) MeV [20]), which is significantly larger than the systematic error of 0.04 MeV. The ranges of$ \pi^{-} $ from$ \Lambda $ decays in the emulsion experiments were chosen to be 1-2 cm, a range interval that covers the majority of$ \pi^{-} $ from hypernuclear decays. Nevertheless, the distribution of$ \pi^{-} $ ranges from$ \Lambda $ decay and hypernuclear decay were different [19, 20, 28]. This difference in$ \pi^{-} $ range can also yield a difference in the measured Q value as large as 0.43 ± 0.13 (stat.) MeV [28], and cannot ensure that the deviations of measured Q values for$ \Lambda $ decay and hypernuclear decay are in the same direction [28]. Recent precise measurements show that for p-shell hypernuclei, there is a discrepancy in the range of 0.4-0.8 MeV between the early emulsion measurements and the recent data [39]. The authors of Ref. [39] also argue that the emulsion data significantly underestimated the systematic error, which is dependent on the specific hypernucleus. Based on the above statement, we believe that the compensating effect described above may not fully account for the systematic errors, and a recalibration of the$ Q_{0} $ differences seems to be a more reliable method. -
We note that it is tempting to average the recalibrated early measurements for each hypernucleus to obtain a more precise best value. However, as explained above, without a better understanding of systematic uncertainties associated with emulsion measurements, it is not appropriate to perform a weighted average. From Table 3, it is evident that the recalibrated
$ B_\Lambda $ values are systematically larger than the original estimates, except in the case of$ ^{6}_{\Lambda} $ He. Compared with the original$ ^{3}_{\Lambda} $ H$ B_\Lambda $ =$ \rm 0.13 \pm 0.05\, (stat.) $ MeV, which was published in 1973 and widely used in modern theoretical studies, the recalibrated$ B_\Lambda $ =$ \rm 0.27 \pm 0.08 \,(stat.) $ MeV is closer to the latest result, namely$ B_\Lambda $ =$ \rm 0.41 \pm 0.12\,(stat.) \pm 0.11\,(syst.) $ MeV, published by the STAR collaboration in 2019 [24, 25]. The latest precise measurement of$ ^{4}_{\Lambda} $ H by the A1 collaboration in 2016 is 2.157 ± 0.005 (stat.) ± 0.077 (syst.) MeV [42], which is also closer to our recalibrated value when compared with the original values presented in 1973. In addition, in contrast to the original emulsion measurements, our recalibrated values for$ ^{7}_{\Lambda} $ He and$ ^{7}_{\Lambda} $ Li are also closer to the latest measurement$ B_\Lambda (^{7}_{\Lambda} $ He) =$ \rm 5.55 \pm 0.10\,(stat.) \pm 0.11$ (syst.) MeV by the HKS collaboration in 2016 [43] , and$ B_\Lambda (^{7}_{\Lambda}{\rm{Li}}) = \rm 5.85 \pm 0.13,(stat.) \pm $ $\,0.11\,({\rm{syst.}}) $ MeV by the FINUDA collaboration in 2009 [44, 45] . These numbers corroborate the expectation that all recalibrated$ B_\Lambda $ values presented in this paper are indeed better estimates than the early measurements in the light hypernuclei region. In recent years, collaborations at Jefferson Lab and the DA$ \Phi $ NE-FINUDA collaboration measured$ B_{\Lambda} $ with good accuracy for heavier hypernuclei, namely$ B_\Lambda (^{9}_{\Lambda} $ Li) =$\rm 8.36 \pm 0.08 $ $ ({\rm stat.}) \pm 0.08\,({\rm syst.}) $ MeV [46],$ B_\Lambda (^{9}_{\Lambda} $ Be) =$ \rm 6.30 \pm 0.10\,({\rm stat.}) \pm $ $0.10\,({\rm syst.}) $ MeV [44, 45],$ B_\Lambda (^{10}_{\Lambda} $ Be) =$\rm 8.60 \pm 0.07\,(stat.) \pm 0.16 $ $ ({\rm syst.}) $ MeV [47],$ B_\Lambda (^{11}_{\Lambda} $ B) =$ \rm 10.28 \pm 0.2\,(stat.) \pm 0.4\,(syst.) $ MeV [44],$ B_\Lambda (^{12}_{\Lambda} {\rm B}) =$ $ \rm 11.524 \pm 0.019\,\,(stat.) \pm 0.013\,\,(syst.) $ MeV [48],$ B_\Lambda (^{13}_{\Lambda} $ C) =$ \rm 11.0 \pm 0.4 $ MeV [49], and$ B_\Lambda (^{15}_{\Lambda}{\rm N}) = $ $ \rm 13.8 \pm 0.7\,(stat.) \pm 1.0$ (syst.) MeV [44]. Comparing these measurements with the early emulsion measurements, some recent results indicate larger$ B_{\Lambda} $ . However, some of them show smaller$ B_{\Lambda} $ .The recalibrated
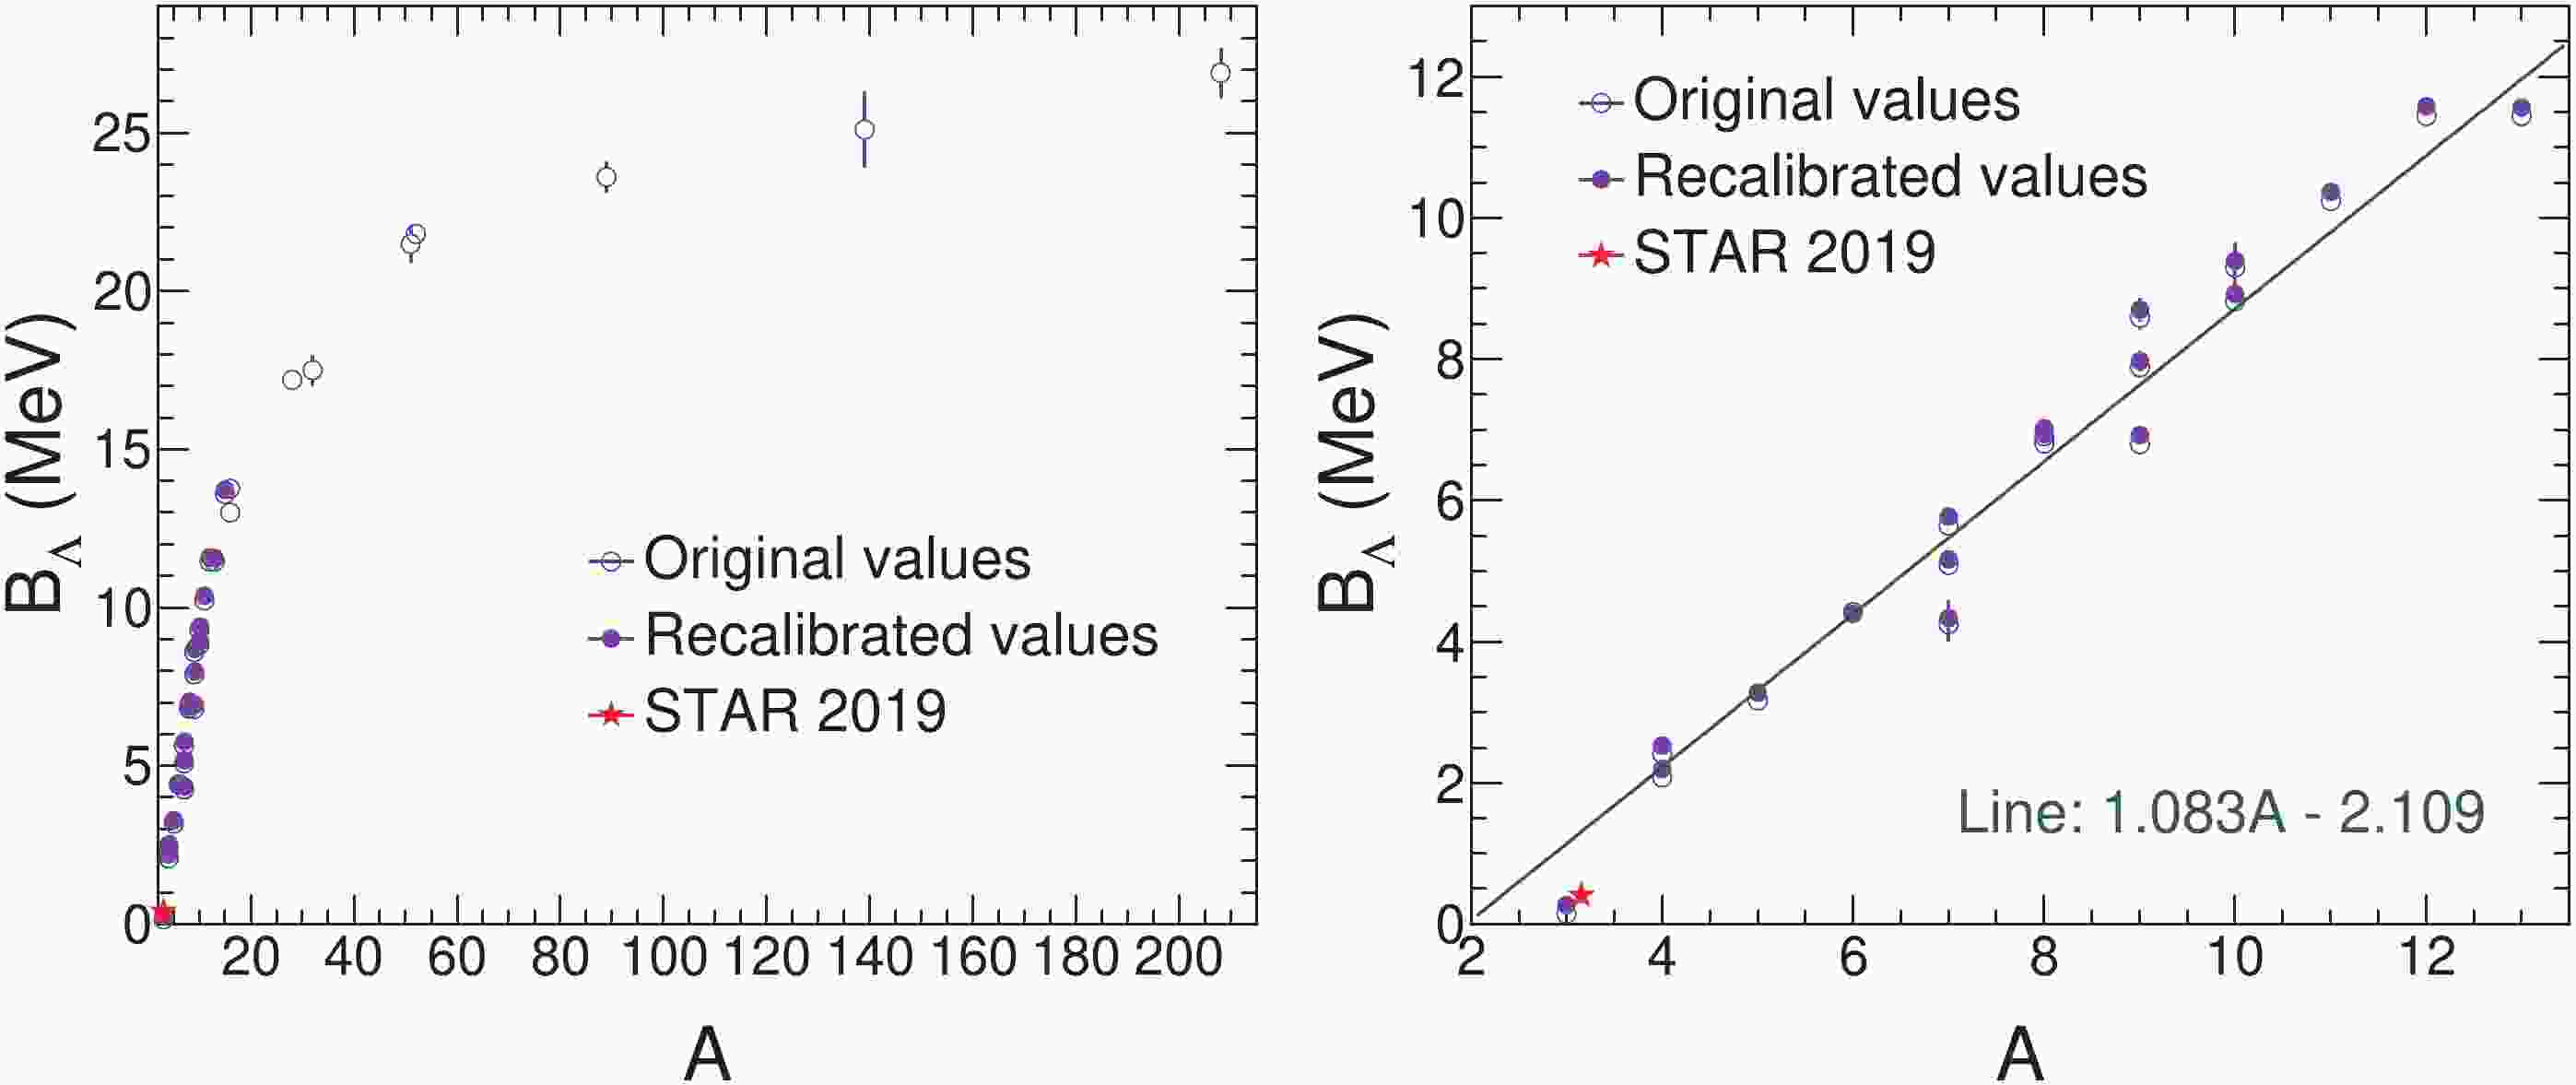
$ \Lambda $ separation energy$ B_\Lambda $ of hypernuclei from 1973 (except for$ ^{7}_{\Lambda} $ He, whose value dates from 1968) along with the values [9] for hypernuclei with the mass number$ A >15 $ are collected in Figs. 1, 2, and 3. Figure 1 shows$ B_\Lambda $ as a function of the hypernuclear mass number A. From Fig. 1, it is evident that$ B_{\Lambda} $ dramatically increases with mass number up to about$ A \sim 15 $ . As A becomes larger,$ B_{\Lambda} $ increases more slowly and indicates a trend towards saturation in the limit of very large A. As shown in the right panel of Fig. 1, a straight line provides a good fit to the recalibrated$ B_{\Lambda} $ in the region of light hypernuclei, i.e.,$ A < 15 $ .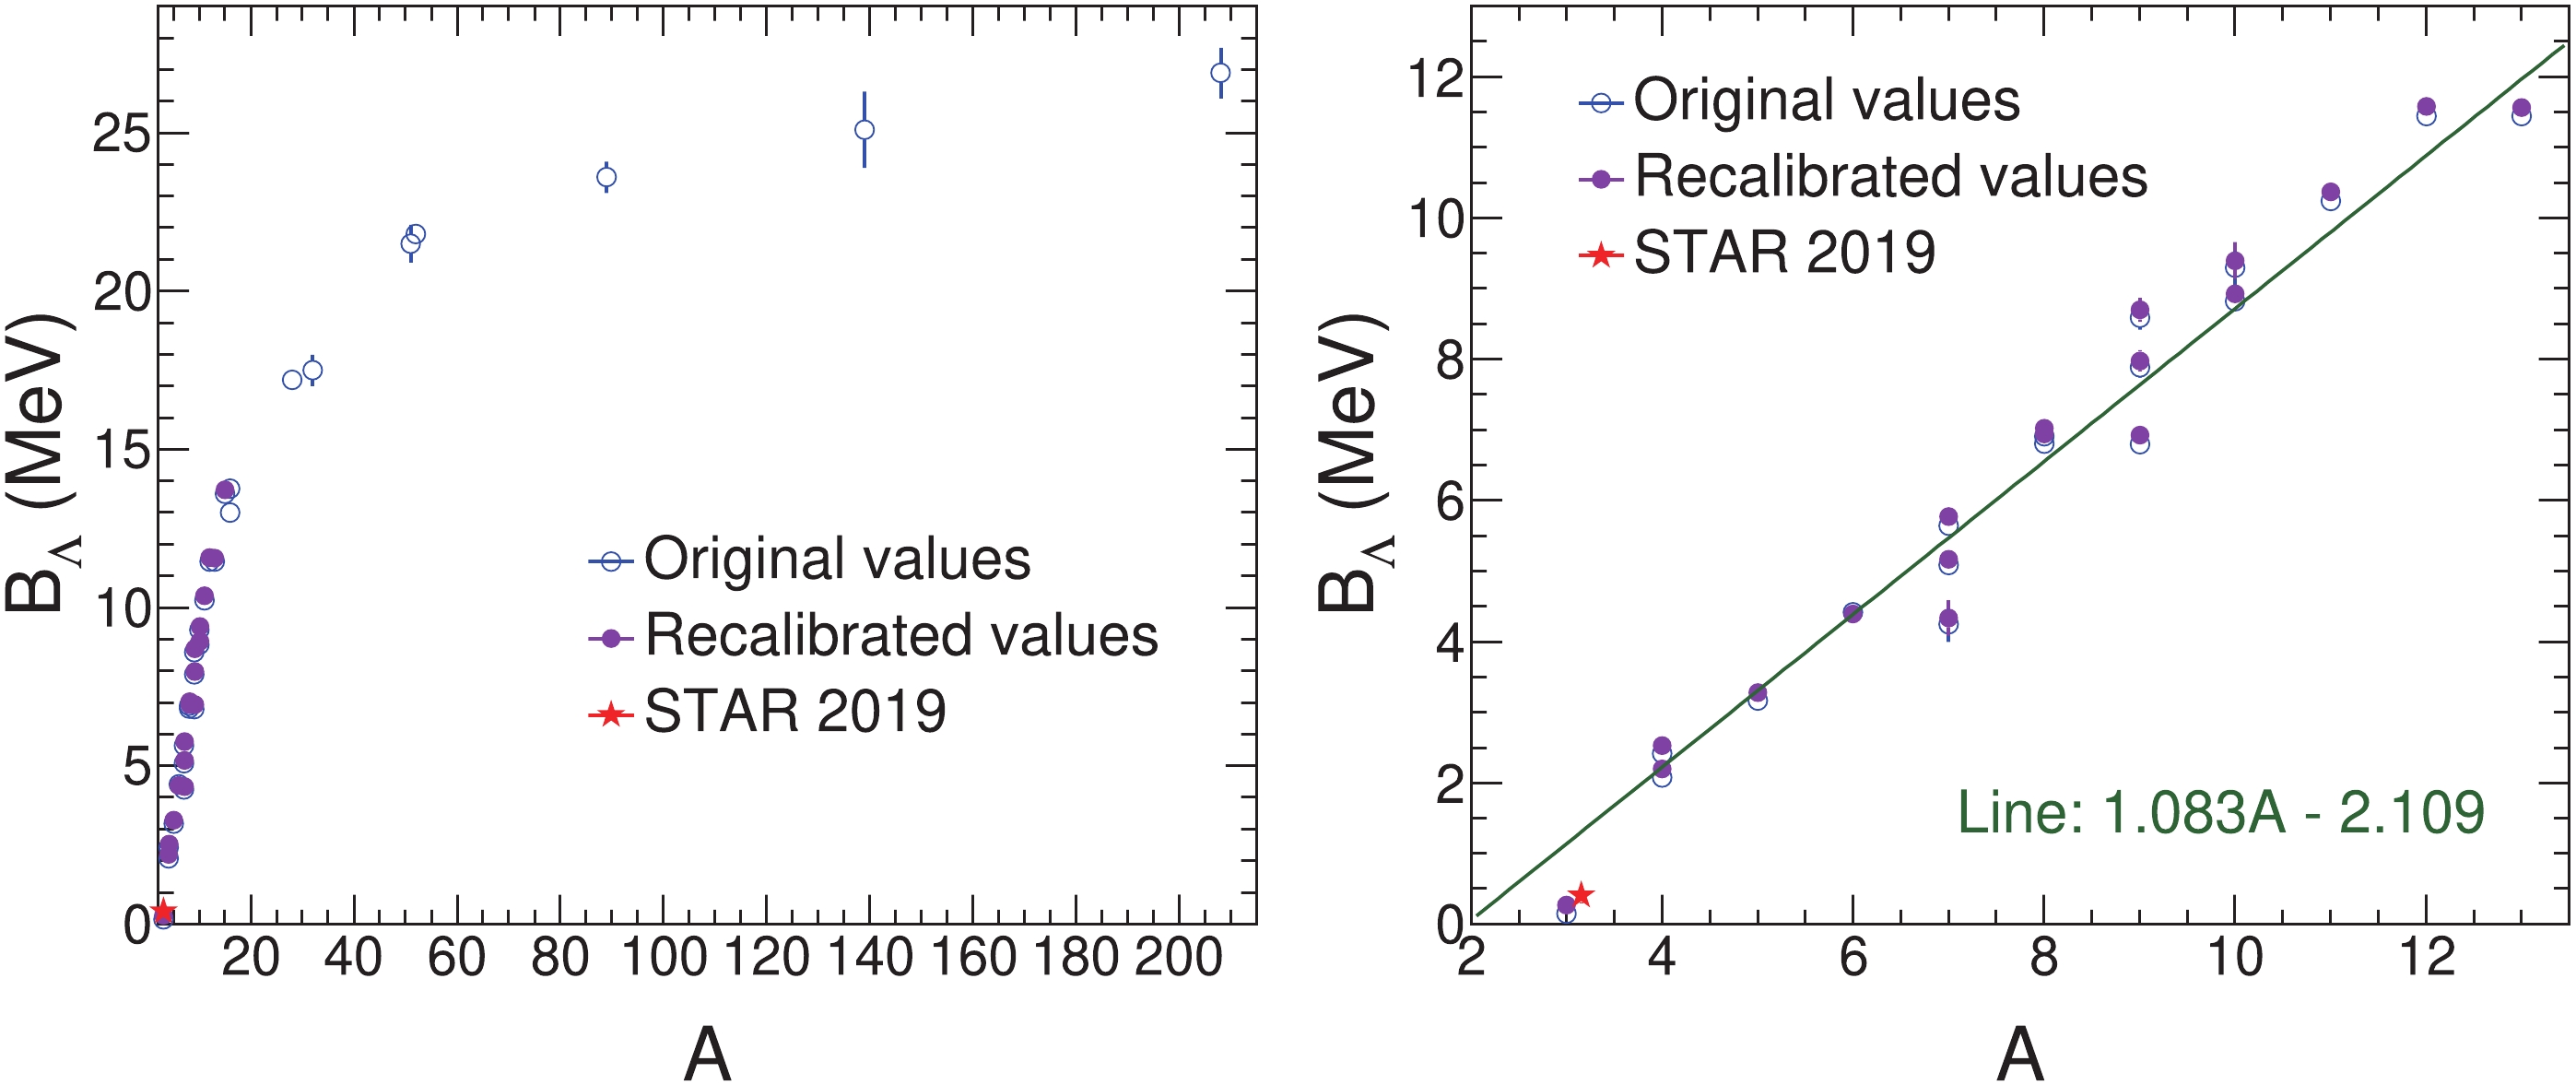
Figure 1. (color online) The
$ \Lambda $ separation energy$ B_{\Lambda} $ of hypernuclei as a function of the mass number A. The original and the recalibrated values are shown together with the latest measurement for the hypertriton by the STAR collaboration [24]. The error bars are the reported uncertainties. The caps and error bar shown for the STAR measurement are the systematic and statistical uncertainty, respectively. The right panel shows a magnified view. The STAR point is moved away from A = 3 to make it visible. A straight line is fitted to the recalibrated values in the range A = 3 -15. The green line and the green text shown in this figure are the fit results.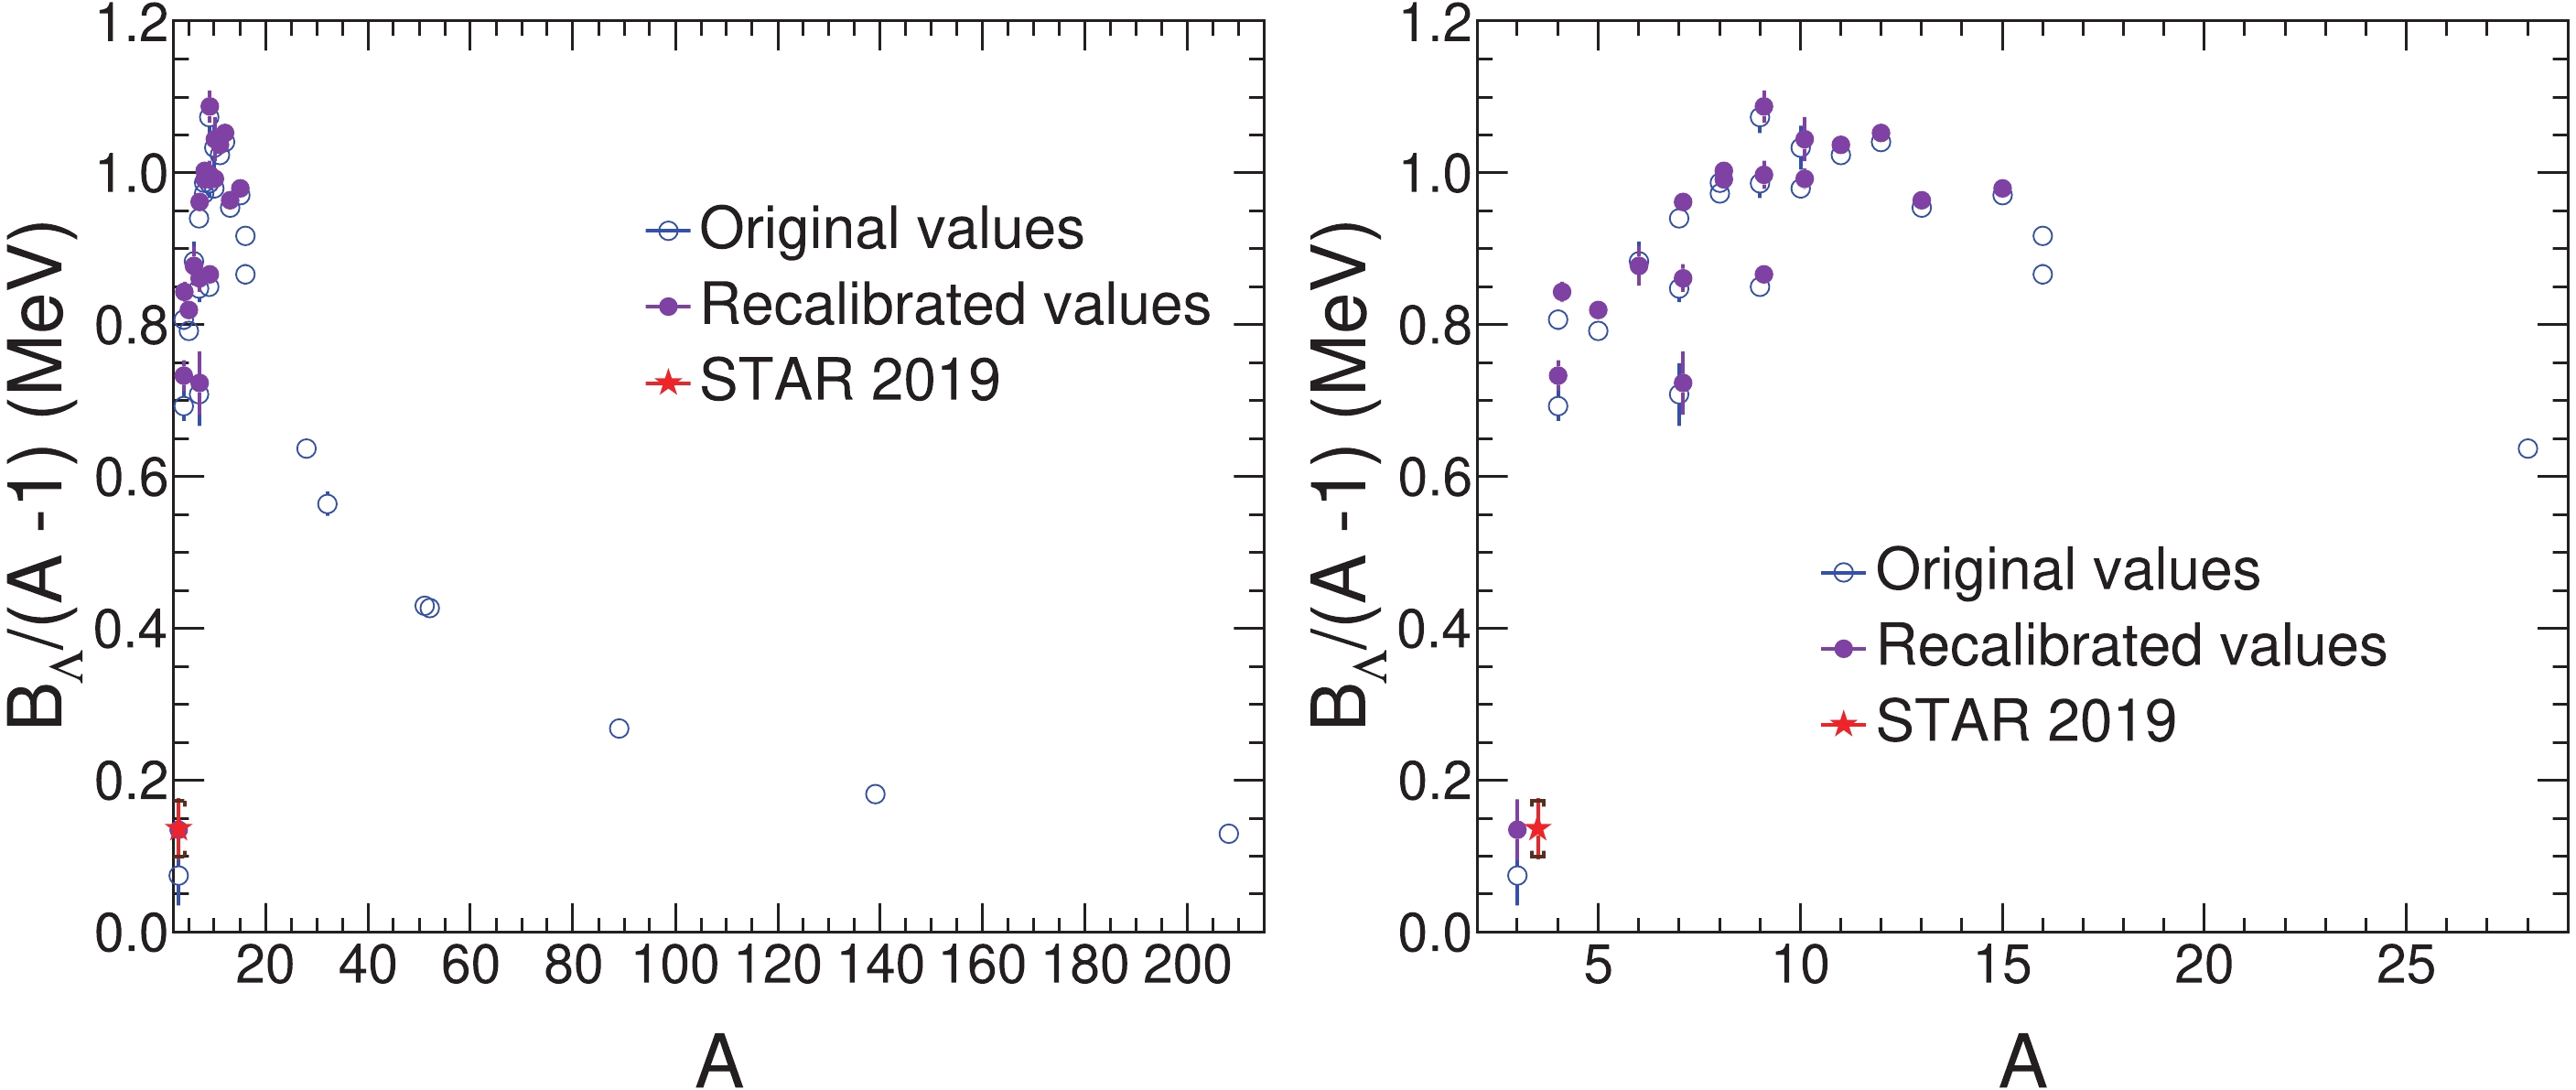
Figure 2. (color online) The hypernuclear
$ \Lambda $ separation energy$ B_{\Lambda} $ per baryon in the core of hypernuclei as a function of the mass number A. The original and the recalibrated values are shown together with the latest measurement for the hypertriton by the STAR collaboration [24]. The error bars are the reported uncertainties. The caps and error bar shown for the STAR measurement are the systematic and statistical uncertainty, respectively. The right panel shows a magnified view. The STAR point is displaced slightly from$ A = 3 $ for visibility.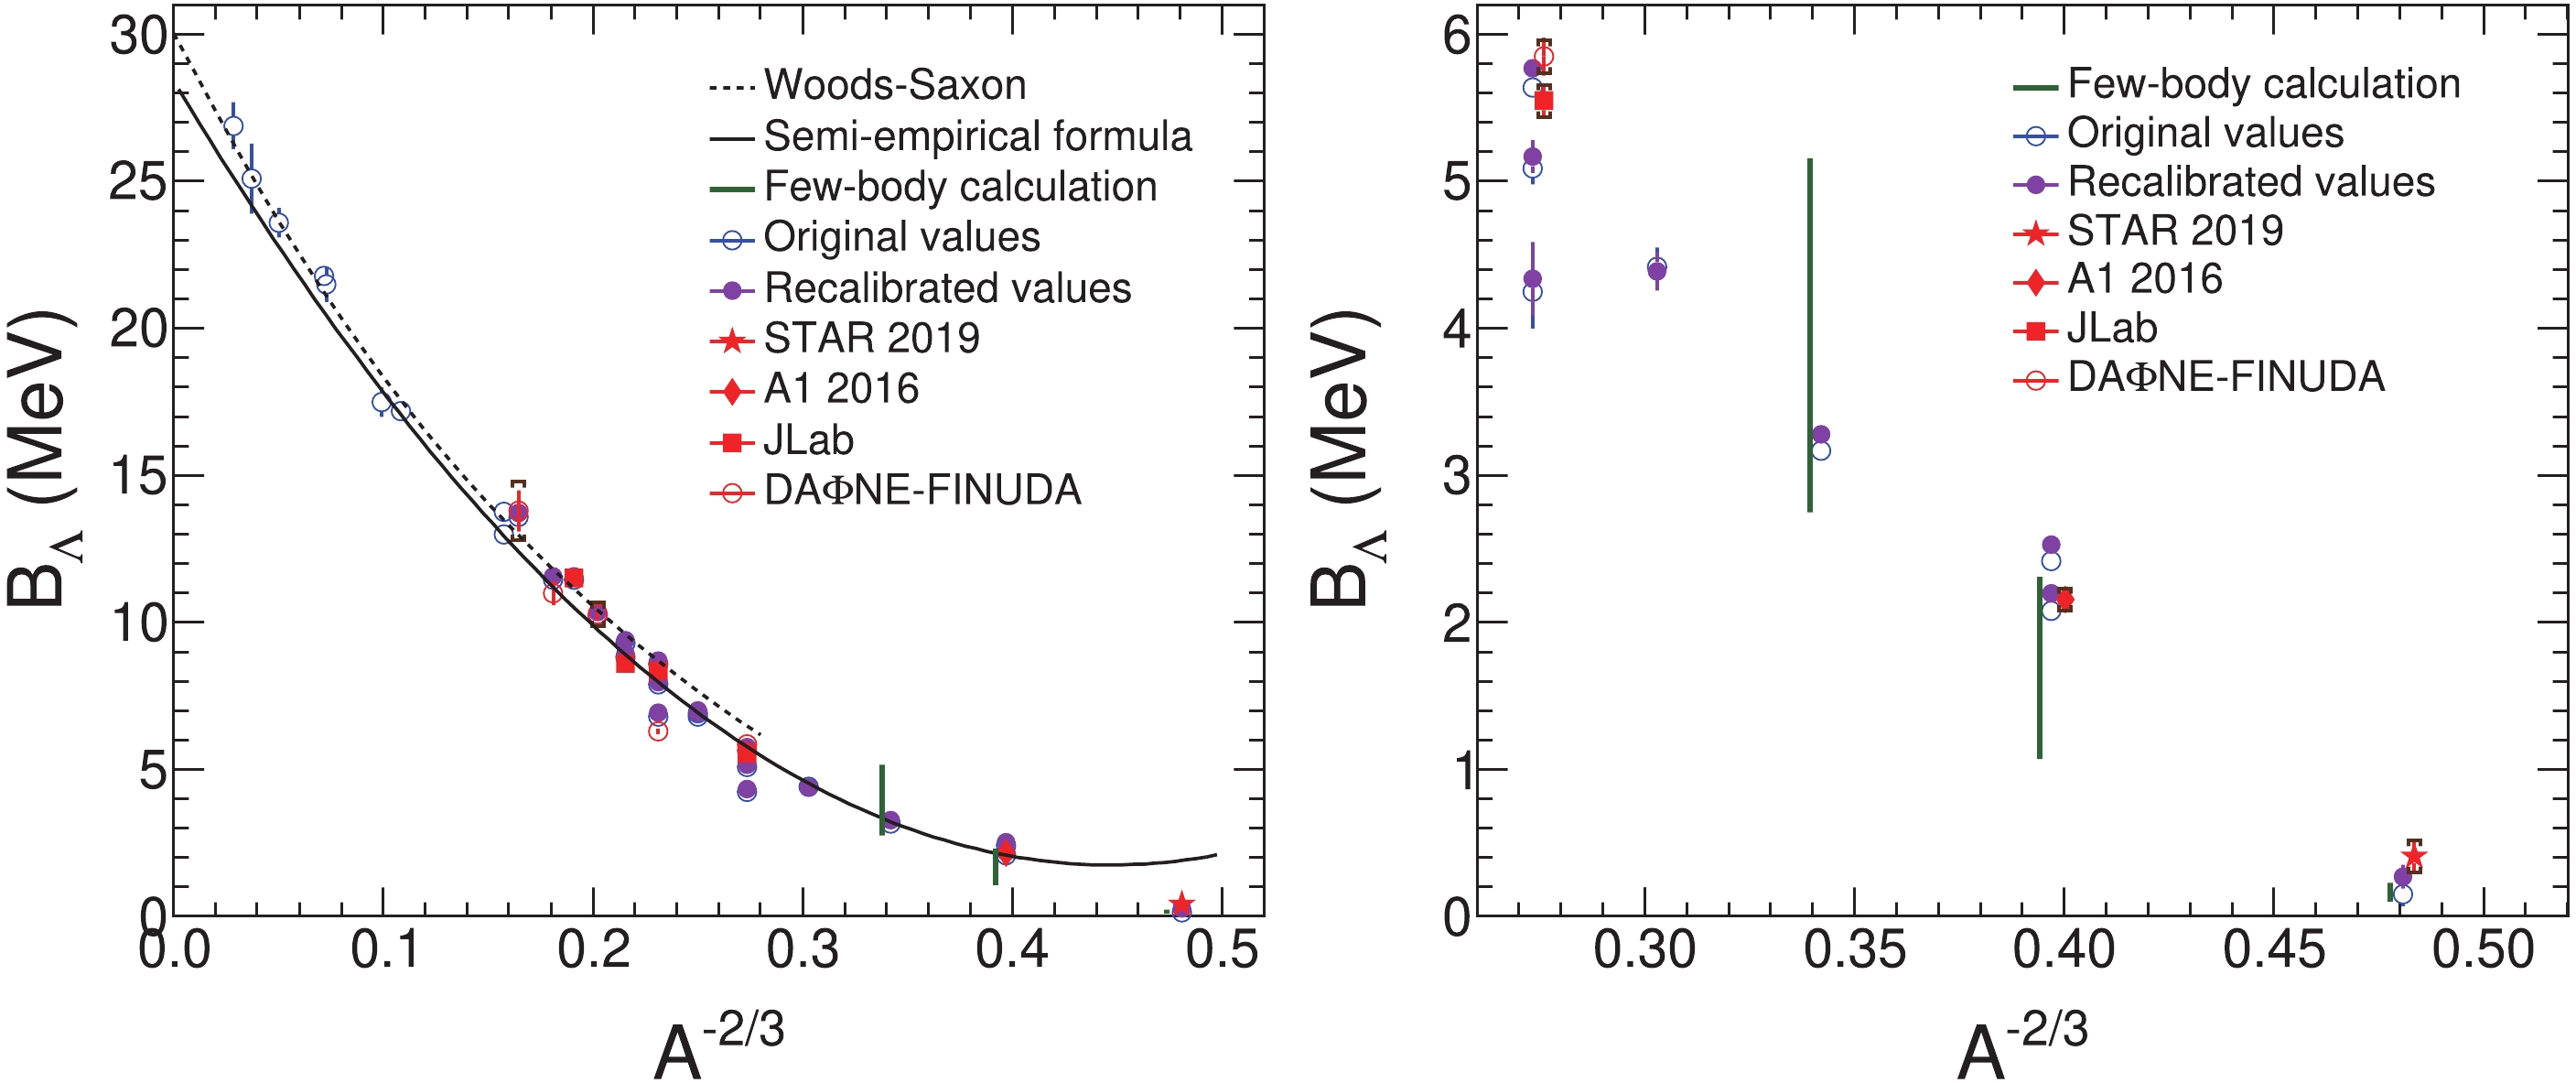
Figure 3. (color online) The hypernuclear
$ \Lambda $ separation energy$ B_{\Lambda} $ as a function of$ A^{-2/3} $ . The original and the recalibrated values are shown together with the latest measurement for$ ^{3}_{\Lambda} $ H by the STAR collaboration [24], the measurement for$ ^{4}_{\Lambda} $ H by the A1 collaboration [42], the measurements for$ ^{7}_{\Lambda} $ He,$ ^{9}_{\Lambda} $ Li,$ ^{10}_{\Lambda} $ Be, and$ ^{12}_{\Lambda} $ B by JLab [43, 46-48], and the measurements for$ ^{7}_{\Lambda} $ Li,$ ^{9}_{\Lambda} $ Be,$ ^{11}_{\Lambda} $ B,$ ^{13}_{\Lambda} $ C, and$ ^{15}_{\Lambda} $ N by the DA$ \Phi $ NE-FINUDA collaboration [44, 45, 49]. The error bars are the reported uncertainties. The caps and error bars shown for the STAR, A1, JLab, and DA$ \Phi $ NE-FINUDA measurements are the systematic and statistical uncertainty, respectively. The dashed black curve in the left panel was obtained by solving the Schrödinger equation with the standard Woods-Saxon potential [9], and the solid black curve is a semi-empirical formula [50]. The green vertical lines near the experimental points are several representative few-body calculations [11, 27]. The right panel shows a magnified view, where the markers for STAR, A1, JLab, and DA$ \Phi $ NE-FINUDA are displaced slightly from their corresponding mass numbers for visiblity.Figure 2 shows the strength of the interaction between a nucleon in the core of a hypernucleus and the bound
$ \Lambda $ . From Fig. 2, it is evident that the strength of the interaction between a nucleon and$ \Lambda $ first dramatically increases with A, and then decreases. At very large A, it shows a tendency to flatten out. From the right panel of Fig. 2, it is evident that$ B_{\Lambda}/(A- 1) $ reaches a maximum between$ A = 8 $ and$ A = 12 $ . Fig. 3 presents$ B_\Lambda $ versus$ A^{-2/3} $ . The dashed black curve is the solution of the Schrödinger equation with the standard Woods-Saxon potential [9], which describes the medium and heavy mass range. A semi-empirical formula based on the Fermi gas model is also employed for$ B_{\Lambda} $ of light, medium, and heavy hypernuclei [50], as shown in Fig. 3. Although this semi-empirical formula shows good agreement in the mid-mass range, it is not good enough for fitting the experimental data in the light and heavy mass range. On the other hand, the Woods-Saxon potential and the semi-empirical formula do not take into account the Charge Symmetry Breaking (CSB) effect. The right panel of Fig. 3 is a zoom of the region$ A\leqslant 7 $ , where the theoretical calculations span a wide range, as shown in the right panel of Fig. 3 , and consequently our recalibration becomes more important.The recalibrated values are systematically larger (except in the case of
$ ^6_\Lambda $ He) than the original values by about 100 keV, which is mainly due to the difference of the$ \Lambda $ hyperon mass between the modern and the early emulsion values. This effect is more significant for light hypernuclei, especially for$ ^{3}_{\Lambda} $ H, since its$ B_\Lambda $ is very small compared with heavy hypernuclei. These larger$ B_{\Lambda} $ of light hypernuclei obtained by recalibrating the emulsion data and from the recent experimental measurements will help to understand the puzzle of reduced lifetime of$ ^{3}_{\Lambda} $ H [51]. The latest compilation of measurements yields a$ ^3_\Lambda $ H lifetime shorter than the free$ \Lambda $ lifetime [13, 52]. A calculation in which the closure approximation was introduced to evaluate the wave functions by solving the three-body Faddeev equations, indicates that the$ ^3_\Lambda $ H lifetime is (19 ± 2)% smaller than that of$ \Lambda $ [53]. The shorter lifetime is consistent with a larger$ \Lambda $ separation energy in$ ^{3}_{\Lambda} $ H. The significant change in$ B_\Lambda $ of$ ^3_\Lambda $ H will also improve the understanding of other hypernuclei [11]. We also see from Table 3 that$ B_\Lambda $ for hypernuclei with the same mass number A but different electric charge are significantly different, i.e., the CSB effect [44]. Theoretical studies are particularly needed to address the CSB effect.We also investigate the difference between
$ B_{\Lambda} $ of hypernuclei and the corresponding binding energy of the last neutron and proton ($ S_{n} $ and$ S_{p} $ ) of ordinary nuclei, as shown in Table 4.$ B_{\Lambda} $ increases with A, but$ S_{n} $ and$ S_{p} $ show a significantly different behavior. This difference means that a$ \Lambda $ hyperon plays a different role in a nucleus than a nucleon. On the other hand, this difference may be related to the rich structure of the nuclear core. For example, the Gaussian expansion method provides an accurate structure calculation of light hypernuclei by treating them as three and/or four clusters [55].$ ^{3}_{\Lambda} $ H (t)

$ ^{4}_{\Lambda} $ He (4He)

$ ^{5}_{\Lambda} $ He (5He)

$ ^{6}_{\Lambda} $ He (6He)

$ ^{7}_{\Lambda} $ He (7He)

$ ^{7}_{\Lambda} $ Li (7Li)

$ ^{7}_{\Lambda} $ Be (7Be)

$ B_{\Lambda} $ 

0.27 ± 0.08 2.53 ± 0.04 3.28 ± 0.02 4.39 ± 0.13 4.34 ± 0.25 5.77 ± 0.04 5.17 ± 0.11 $ S_{n} $ 

6.26 20.58 −0.74 ± 0.02 1.71 ± 0.02 −0.41 ± 0.01 7.25 10.68 $ S_{p} $ 

No data 19.81 20.68 ± 0.10 22.59 ± 0.09 23.09 ± 0.25 9.97 5.61 $ ^{8}_{\Lambda} $ Li (8Li)

$ ^{8}_{\Lambda} $ Be (8Be)

$ ^{9}_{\Lambda} $ Li (9Li)

$ ^{9}_{\Lambda} $ Be (9Be)

$ ^{9}_{\Lambda} $ B (9B)

$ ^{10}_{\Lambda} $ Be (10Be)

$ ^{10}_{\Lambda} $ B (10B)

$ B_{\Lambda} $ 

6.94 ± 0.03 7.02 ± 0.07 8.70 ± 0.17 6.93 ± 0.03 7.98 ± 0.15 9.40 ± 0.26 8.93 ± 0.12 $ S_{n} $ 

2.03 18.90 4.06 1.66 18.58 6.81 8.44 $ S_{p} $ 

12.42 17.25 13.94 16.89 −0.19 19.64 6.59 $ ^{11}_{\Lambda} $ B (11B)

$ ^{12}_{\Lambda} $ B (12B)

$ ^{13}_{\Lambda} $ C (13C)

$ ^{15}_{\Lambda} $ N (15N)

$ ^{16}_{\Lambda} $ N (16N)

$ ^{16}_{\Lambda} $ O (16O)

$ ^{28}_{\Lambda} $ Si (28Si)

$ B_{\Lambda} $ 

10.37 ± 0.06 11.58 ± 0.07 11.57 ± 0.12 13.72 ± 0.14 13.76 ± 0.16 13.0 ± 0.2 17.2 ± 0.2 $ S_{n} $ 

11.45 3.37 4.95 10.83 2.49 15.66 17.18 $ S_{p} $ 

11.23 14.10 17.53 10.21 11.48 12.13 11.58 $ ^{32}_{\Lambda} $ S (32S)

$ ^{51}_{\Lambda} $ V (51V)

$ ^{52}_{\Lambda} $ V (52V)

$ ^{89}_{\Lambda} $ Y (89Y)

$ ^{139}_{\Lambda} $ La (139La)

$ ^{208}_{\Lambda} $ Pb (208Pb)

$ B_{\Lambda} $ 

17.5 ± 0.5 21.5 ± 0.6 21.8 ± 0.3 23.6 ± 0.5 25.1 ± 1.2 26.9 ± 0.8 $ S_{n} $ 

15.04 11.05 7.31 11.48 8.78 7.37 $ S_{p} $ 

8.86 8.06 9.00 7.08 6.25 8.00 Table 4. Comparison between the
$ \Lambda $ separation energy ($ B_{\Lambda} $ ) for each listed hypernucleus and the binding energy of the last neutron ($ S_{n} $ ) and proton ($ S_{p} $ ) in the corresponding nucleus with the same A and Z. The$ B_{\Lambda} $ values for hypernuclei with$ A \leqslant 15 $ are the recalibrated$ B_{\Lambda} $ from 1973 (except for$ ^{7}_{\Lambda} $ He, where the recalibrated 1968 data is used), while the data for hypernuclei with$ A > 15 $ are from Ref. [9]. The$ S_{n} $ and$ S_{p} $ values are taken from the database maintained by the International Atomic Energy Agency (IAEA) [54].$ B_{\Lambda} $ ,$ S_{n} $ and$ S_{p} $ are in units of MeV. -
In summary, the early measurements of the
$ \Lambda $ separation energy$ B_\Lambda $ for$ \Lambda $ hypernuclei published in 1967, 1968, and 1973 were recalibrated with the current most accurate values of the mass of particles and nuclei. The recalibrated$ B_\Lambda $ are systematically larger (except in the case of$ ^6_\Lambda $ He) than the original published values by about 100 keV. The effect of this level of recalibration is most significant for light hypernuclei, especially for the hypertriton. Our recalibrated$ B_\Lambda $ give rise to new constraints for the theoretical studies of the strong force, the structure of hypernuclei, and neutron star interior. Although this paper provides better$ B_\Lambda $ estimates by recalibrating the early measurements using modern masses of particles and nuclei, the latter may also suffer from significant systematic uncertainties, such as from the energy-range relation in an emulsion and the emulsion density [28, 38, 44, 56]. To further improve the constraints for theoretical research, more precise measurements of the fundamental properties of hypernuclei, like the mass and binding energy, are highly desirable. More precise measurements can be expected in the near future as a result of the on-going phase-II of the Beam Energy Scan program at RHIC, the high resolution spectroscopic experiments at Jefferson Lab [57] in the US, and the experiments at the Mainz Microton (MAMI) in Germany, while further progress will be made possible by measurements at the High Intensity Accelerator Facility (HIAF) under construction in China [58], at the Facility for Antiproton and Ion Research (FAIR) under construction in Germany, at the Japan Proton Accelerator Research Complex (J-PARC), and at the Nuclear Spectroscopic Telescope Array (NuSTAR) in the US.We thank Prof. John Millener for insightful discussions and for sharing with us the private communication with Prof. Don Davis and the Woods-Saxon potential data.
Recalibration of the binding energy of hypernuclei measured in emulsion experiments and its implications
- Received Date: 2019-08-14
- Available Online: 2019-12-01
Abstract: The


 DownLoad: