-
$\alpha$ decay, which is one of the most significant tools for exploring nuclear structure information, can provide information of the ground-state lifetime, nuclear force, nuclear matter incompressibility, and spin and parity of nuclei [1-4]. In 1928, Gamow, Condon, and Gurney independently proposed the quantum tunneling theory [5, 6], named as Gamow theory. Within this theory, the$\alpha$ decay is explained as an$\alpha$ cluster preformed in the surface of the parent nucleus penetrating the Coulomb barrier between the cluster and the daughter nucleus. The probability of$\alpha$ cluster formation in the parent nucleus is described as the$\alpha$ preformation factor,$P_{\alpha}$ , including many nuclear structure information. It has became a prominent topic in nuclear physics [7-10].Until now, many microscopical and phenomenological models have been used to calculate
$P_{\alpha}$ [11-25]. Microscopically, in the R-matrix method [11-15],$P_{\alpha}$ can be obtained by the initial tailored wavefunction of the parent nucleus. However, the calculation of purely microcosmic$P_{\alpha}$ is very difficult owing to the complexity of the nuclear many-body problem and the uncertainty of the nuclear potential. The$\alpha$ preformation factors can also obtained by the approach of the microscopical Tohsaki–Horiuchi–Schuck–R$\ddot{\rm{o}}$ pke wave function [16, 17], which has been successfully employed to describe the cluster structure in light nuclei [17]. Using the cluster-configuration shell model, Varga${et\ al.}$ reproduced the experimental decay width of 212Po and obtained its$\alpha$ preformation factor$P_{\alpha}$ = 0.23 [11, 15]. Recently, Ahmed${et\ al.}$ proposed a new quantum-mechanical theory named as cluster-formation model (CFM) to calculate the$\alpha$ preformation factors,$P_{\alpha}$ , of even–even nuclei [19, 26]. Within this model,$P_{\alpha}$ can be obtained from the ratio of the formation energy,$E_{f\alpha}$ , to the total energy, E, where$E_{f\alpha}$ and E can be obtained from the binding energies of the nucleus and its neighboring nuclides. Later, Deng${et\ al.}$ and Ahmed${et\ al.}$ extended this model to odd-A and odd–odd nuclei [20-22]. Generally, within different theoretical models, the$\alpha$ preformation factors,$P_{\alpha}$ are different because the penetration probability varies greatly with an exponential factor. Phenomenologically, the preformation factors,$P_{\alpha}$ , are extracted from the ratios of the calculated$\alpha$ decay half-lives to the experimental ones [23-25]. In 2005, using the density-dependent cluster model (DDCM) [18], Xu and Ren studied the available experimental$\alpha$ decay half-lives of medium-mass nuclei. Their results showed that the$P_{\alpha}$ are different for different types of parent nuclei, i.e.,$P_{\alpha}$ = 0.43 for even–even nuclei, 0.35 for odd-A nuclei, and 0.18 for doubly odd nuclei.Recent studies have been shown that the
$\alpha$ preformation factors are affected by many confirmed factors, such as the isospin asymmetry of the parent nucleus, deformation of the daughter, pairing effect, and shell effect [9, 27]. It has been observed that the minima of the$\alpha$ preformation factors are at the protons, neutron shells, and subshell closures [8, 9, 28-31]. Moreover, many nuclear quantities [32-36], such as deformation and B (E2) values [32, 33], rotational moments of inertia in low-spin states in the rare earth region [34], core cluster decomposition in the rare-earth region [35], and properties of excited states [36], display a systematic behavior with the product of valence protons (holes)$N_p$ and valence neutrons (holes)$N_n$ of the parent nucleus. In 2011, Seif et al. found that the$\alpha$ preformation factor is linearly proportional to the product of$N_p$ and$N_n$ for even–even nuclei around Z = 82 and N = 126 closed shells [37]. In our previous studies [38-40], based on the two-potential approach (TPA) [41, 42], we found that this linear relationship also exists in the cases of odd-A and doubly-odd nuclei for favored and unfavored$\alpha$ decay [38, 39]. Very recently, using the CFM, we calculated the$\alpha$ preformation factors of all kinds of nuclei and found that this linear relationship also existed in these cases [40]. Combined with the study of Seif et al. and our previous studies, it is interesting to validate whether this linear relationship is model-dependent or owing to the valence proton–neutron interaction of the shell closures. In the present study, using the generalized liquid drop model (GLDM) [43-49], we systematically study the$\alpha$ preformation factors,$P_{\alpha}$ , and$\alpha$ decay half-lives of 152 nuclei around Z = 82, N = 126 shell closures. Our results show that the$\alpha$ preformation factors of these nuclei and$N_p$ $N_n$ still satisfy this linear relationship, which suggests that this relationship may be owing to the valence proton–neutron correlation around Z = 82, N = 126 shell closures.This article is organized as follows. In the next section, the theoretical framework of the GLDM is briefly presented. The detailed calculations and discussion are presented in Section 3. Finally, a summary is given in Section 4.
-
The
$\alpha$ decay half-life can be calculated by decay constant$\lambda$ , which can be written as$T_{1/2} = \frac{ {\rm ln}2}{\lambda}. $

(1) Here, the
$\alpha$ decay constant is defined as$\lambda = P_{\alpha} \nu P, $

(2) where
$P_{\alpha}$ is the$\alpha$ preformation factor. P, the penetration probability of the$\alpha$ particle crossing the barrier, is calculated by Eq. (12) expressed subsequently.$\nu$ is the assault frequency, which can be calculated with the oscillation frequency,$\omega$ , and is written as [50]$\nu = \frac{\omega}{2 \pi} = \frac{(2 n_r + l + \dfrac{3}{2}) \hbar}{2 \pi \mu {R_n}^{2}} = \frac{(G + \dfrac{3}{2}) \hbar}{1.2 \pi \mu {R_{00}}^{2}}, $

(3) where
$\mu$ =$\dfrac{m_d m_{\alpha}}{m_d + m_{\alpha}}$ represents the reduced mass between the$\alpha$ particle and the daughter nucleus with$m_d$ and$m_{\alpha}$ being the masses of the daughter nucleus and$\alpha$ particle, respectively.$\hbar$ is the reduced Planck constant.$R_n$ =$\sqrt{\dfrac{3}{5}} R_{00}$ denotes the nucleus root-mean-square (rms) radius with$R_{00}$ =$1.240 A^{1/3} \left(1 + \dfrac{1.646} {A}-0.191 \dfrac{A - 2 Z}{A}\right)$ [51], where A and Z are the proton and mass numbers of the parent nucleus.$G = 2n_r + l$ represents the main quantum number with$n_r$ and l being the radial quantum number and the angular quantity quantum number, respectively. For the$\alpha$ decay, G can be obtained by [52]$\;G = 2{n_r} + l = \left\{ {\begin{array}{*{20}{l}} {18,}&{N \leqslant 82,}\\ {20,}&{82 < N \leqslant 126,}\\ {22,}&{N < 126.} \end{array}} \right. $

(4) $l_{\rm{min}}$ , the minimum angular momentum taken away by the$\alpha$ particle, can be obtained by [53]$\;{l_{{\rm{min}}}} = \left\{ {\begin{array}{*{20}{l}} {{\Delta _j},}&{{\rm{for}}\;{\rm{even}}\;{\Delta _j}\;\;{\rm and}\;\;{\pi _p} = {\pi _d},}\\ {{\Delta _j} + 1,}&{{\rm{for}}\;{\rm{even}}\;{\Delta _j}\;\;{\rm and}\;\;{\pi _p} \ne {\pi _d},}\\ {{\Delta _j},}&{{\rm{for}}\;{\rm{odd}}\;{\Delta _j}\;\;{\rm and}\;\;{\pi _p} \ne {\pi _d},}\\ {{\Delta _j} + 1,}&{{\rm{for}}\;{\rm{odd}}\;{\Delta _j}\;\;{\rm and}\;\;{\pi _p} = {\pi _d},} \end{array}} \right. $

(5) where
$\Delta _j = \left \vert{j_p - j_d}\right \vert$ .$j_p$ ,$\pi_p$ ,$j_d$ ,$\pi_d$ represent the spin and parity values of the parent and daughter nuclei, respectively.The GLDM has been successfully employed to describe fusion reactions [47] and nuclear decays [46, 48, 49]. Within the GLDM, the macroscopic total energy, E, is defined as [44]
$E = E_{\rm S} + E_{\rm V} + E_{\rm C} + E_{\rm{prox}}, $

(6) where
$E_{\rm S}$ ,$E_{\rm V}$ ,$E_{\rm C}$ , and$E_{\rm{prox}}$ are the surface, volume, Coulomb, and proximity energies, respectively. For one-body shapes,$E_{\rm S}$ ,$E_{\rm V}$ , and$E_{\rm C}$ can be expressed as$\begin{split} E_{\rm S} =& 17.9439 (1 - 2.6 I^2) A ^{2/3} (S/4\pi {R_0^2}) \,\rm{MeV}, \\ E_{\rm V} =& -15.494 (1 - 1.8 I^2) A \,\rm{MeV}, \\ E_{\rm C} =& 0.6 e^2(Z^2/R_0) \times 0.5\int(V(\theta) /V_0 )(R(\theta)/R_0)^3 \sin\theta \,{\rm d}\theta, \end{split} $

(7) where
$I = (N-Z)/A$ is the relative neutron excess. S is the surface of the deformed nucleus.$V(\theta)$ is the electrostatic potential at the surface, and$V_0$ is the surface potential of the sphere.${R_0} = 1.28 A^{1/3} - 0.76+0.8A^{-1/3}$ is the effective sharp radius [43].For two separated spherical nuclei, the
$E_{\rm S}$ ,$E_{\rm V}$ , and$E_{\rm C}$ are defined as$\begin{split} E_{\rm S} =& 17.9439 [(1 - 2.6{I_1}^2) {A_1}^{2/3} + (1-2.6{I_2}^2){A_2}^{2/3}]\,\rm{MeV},\\ E_{\rm V} =& -15.494 [(1 - 1.8 {I_1}^2) A_1 + (1 - 1.8 {I_2}^2) A_2] \,\rm{MeV}, \\ E_{\rm C} =& 0.6 e^2{Z_1}^2/R_1 + 0.6 e^2{Z_2}^2/R_2 + e^2 Z_1 Z_2/r \,\rm{MeV},\\[-10pt] \end{split} $

(8) where
$A_i$ ,$Z_i$ , and$I_i$ are the mass number, charge number, and relative neutron excesses of these nuclei, respectively. r is the distance between the mass centers.$R_1$ and$R_2$ are the radii of the daughter nuclei and the$\alpha$ particle, respectively, which can obtained by the following relationships:$\begin{split} R_1 =& R_0 (1 + \beta^{3})^{-1/3},\\ R_2 =& R_0 \beta (1 + \beta^{3})^{-1/3}, \end{split} $

(9) where
$\beta = \frac{1.28 {A_2}^{1/3} - 0.76 + 0.8 {A_2}^{-1/3}}{1.28 {A_1}^{1/3} - 0.76 + 0.8 {A_1}^{-1/3}}. $

(10) The surface energy,
$E_{\rm S}$ , originates from the effects of the surface tension forces in a half-space and does not include the contribution of the attractive nuclear forces between the considered surfaces in the neck or in the gap between the fragments. The nuclear proximity energy term,$E_{\rm{prox}}$ , has been introduced to take into account these additional surface effects. It can be defined as$E_{\rm{prox}}(r) = 2\gamma \int _{h_{\rm{min}}}^{h_{\rm{max}}} \Phi{[D(r,h)/b]}2 \pi h \, {\rm d}h. $

(11) Here, h is the transverse distance varying from the neck radius or zero to the height of the neck border. After the separation,
$h_{\rm{min}}$ = 0 and$h_{\rm{max}}$ =$R_2$ . D is the distance between the opposite infinitesimal surfaces considered, b is the surface width fixed at the standard value of 0.99 fm,$\Phi$ is the proximity function of Feldmeier, and$\gamma = 0.9517\sqrt{(1 - 2.6 {I_1}^2) (1 - 2.6 {I_2}^2)}$ MeVfm-2 is the geometric mean between the surface parameters of the two nuclei.P, the penetration probability of the
$\alpha$ particle crossing the barrier, is calculated within the action integral as follows:$P = {\rm{exp}} \left[ -\frac {2} {\hbar} \int _{R_{\rm{in}}}^{R_{\rm{out}}} \sqrt{2 B(r) (E(r)- E({\rm sphere}))}\,{\rm d}r\right]. $

(12) Here,
$B(r) = \mu$ ,$Q_{\alpha}$ is the$\alpha$ decay energy, and$R_{\rm{in}}$ and$R_{\rm{out}}$ are the two turning points of the semiclassical Wentzel–Kramers–Brillouin (WKB) action integral with$E(R_{\rm{in}}) = E(R_{\rm{out}} ) = Q_{\alpha}$ .$R_{\rm{in}} = R_1 + R_2$ . Consisdering the contribution of the centrifugal potential,$R_{\rm{out}}$ can be obtained by$R_{\rm{out}} = \frac{Z_1 Z_2 e^2}{2 Q_{\alpha}} + \sqrt{{\left(\frac{Z_1 Z_2 e^2} {2 Q_{\alpha}}\right)}^2 + \frac{{l (l + 1) {\hbar}^2}}{2 \mu Q_{\alpha}}}. $

(13) -
In recent years, many studies have indicated that the
$\alpha$ preformation factor,$P_{\alpha}$ , of a nucleus becomes smaller as the valence nucleus (hole) becomes smaller [23-25]. Meanwhile, intensive studies related to the$N_pN_n$ scheme have indicated the importance of the proton–neutron interaction in determining the evolution of the nuclear structure [54-58]. In 2011, Seif et al. found that the$P_{\alpha}$ are linearly related to the product of the valence proton numbers and the valence neutron numbers,$N_p$ $N_n$ , for even–even nuclei around Z = 82, N = 126 shell closures [37]. Very recently, we found that this linear relationship still exists in the cases of odd-A and doubly-odd nuclei for favored and unfavored$\alpha$ decays [38-40]. Moreover, we systematically studied the$P_{\alpha}$ based on the CFM [19-22] of all kinds of nuclei around Z = 82, N = 126 shell closures. The results indicated that the linear relationship between the$\alpha$ preformation factors and$N_pN_n$ still exists. Whether this phenomenon is model-dependent or may be the effect of the valance proton–neutron interaction around the closed shells is an interesting problem. In the present study, we use the GLDM to systematically study the$P_{\alpha}$ and$\alpha$ decay half-lives of the nuclei around Z = 82, N = 126 shell closures, with the experimental$\alpha$ decay half-lives,$T^{\rm{expt}}_{1/2}$ , being taken from the latest evaluated nuclear properties table, NUBASE2016 [59].First, we calculate the
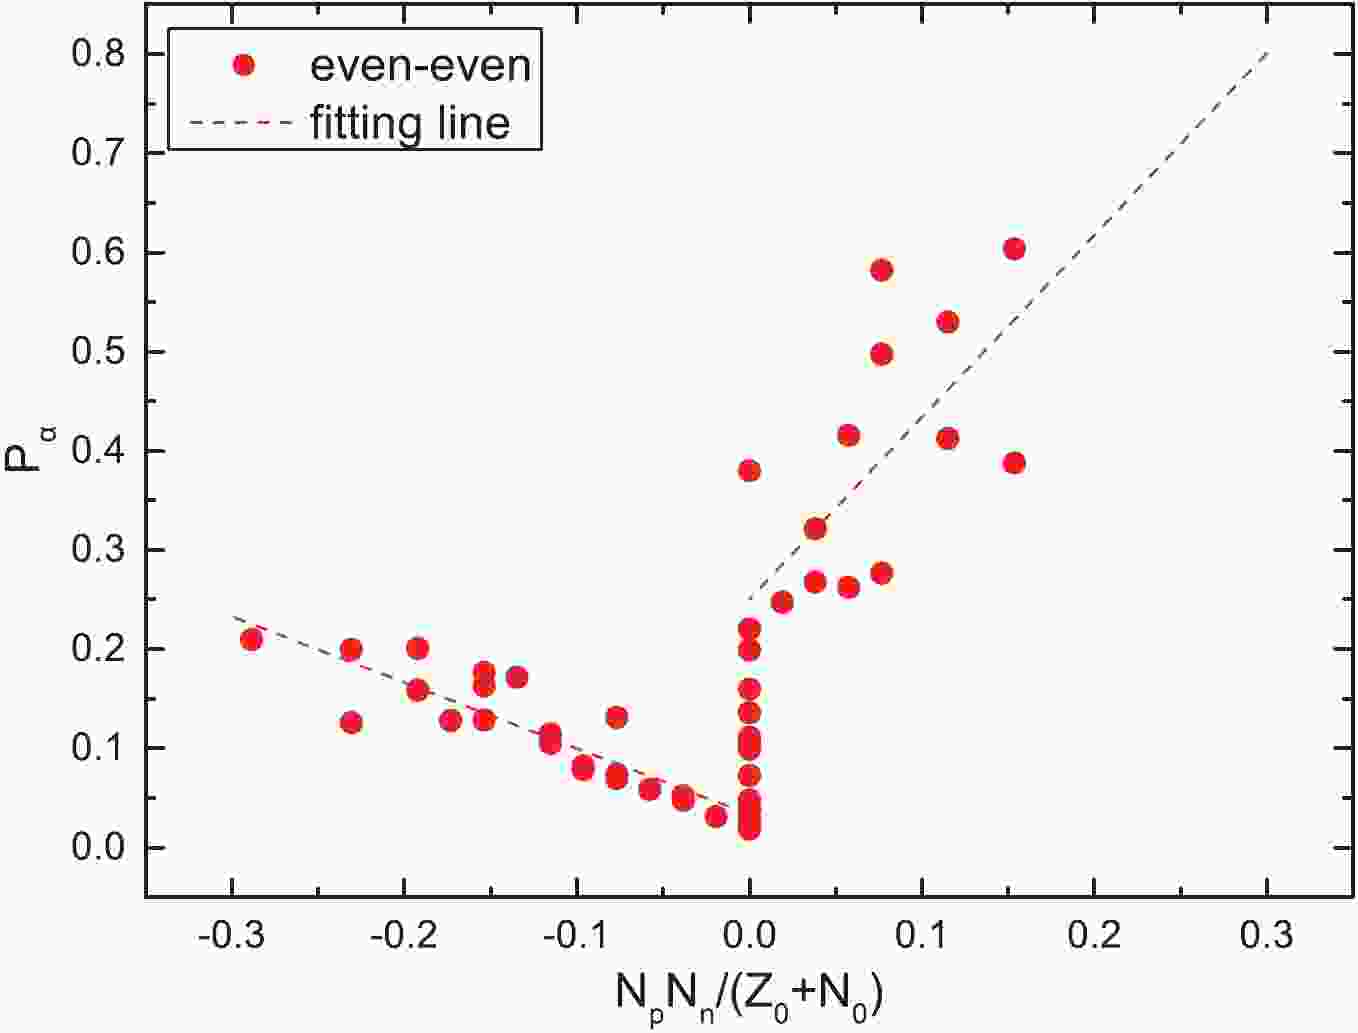
$\alpha$ preformation factors,$P_{\alpha}$ , of 152 nuclei (including 47 even–even nuclei, 73 odd-A nuclei, and 32 doubly-odd nuclei) around the Z = 82, N = 126 shell closures through$P_{\alpha} = \dfrac{T^{\rm{calc}}_{1/2}}{T^{\rm{expt}}_{1/2}}$ , whereas the theoretical calculations,${T^{\rm{calc}}_{1/2}}$ , are obtained by the GLDM. The calculated results of$P_{\alpha}$ are listed in the fifth columns of Tables 1–5. For more clearly observing the relationship between the obtained$P_{\alpha}$ and$N_pN_n$ for these nuclei, we plot the$P_{\alpha}$ as a function of$\dfrac{N_pN_n}{Z_0 + N_0}$ in five cases in Figs. 1–3 (Fig. 1 for the case of even–even nuclei, Fig. 2 for the cases of the favored and unfavored odd-A nuclei, and Fig. 3 for the cases of the favored and unfavored doubly-odd nuclei). To more clearly describe$N_p$ and$N_n$ bounded by the double magic numbers of Z = 82 and N = 126, we divide these 152 nuclei into three regions. In region I, the proton number of a nucleus is above the Z = 82 shell closure and the neutron number is below the N = 126 closed shell and the$\dfrac{N_pN_n}{Z_0+N_0}$ value is negative. In region II, the proton number of a nucleus is above the Z = 82 shell closure and the neutron number is above the N = 126 closed shell and the$\dfrac{N_pN_n}{Z_0 + N_0}$ value is positive. In region III, the proton number of a nucleus is below the Z = 82 shell closure and the neutron number is above the N = 126 closed shell and the$\dfrac{N_pN_n}{Z_0 + N_0}$ value is positive. In Fig. 1, the red dots represent the case of even–even nuclei$\alpha$ decay and the red dashed line represents the fittings of$P_{\alpha}$ for the cases of even–even nuclei$\alpha$ decay. In Figs. 2 and 3 the red dots and blue triangle represent the cases of the favored and unfavored$\alpha$ decays, respectively. The red dashed and blue solid lines represent the fittings of$P_{\alpha}$ . As we can see in Figs. 1–3, around the Z = 82, N = 126 shell closures, when the values of$\dfrac{N_pN_n}{Z_0 + N_0}$ are positive,$P_{\alpha}$ increases basically with the increase of$\dfrac{N_pN_n}{Z_0 + N_0}$ . Similarly, when the values of$\dfrac{N_pN_n}{Z_0 + N_0}$ are negative,$P_{\alpha}$ increases basically with the increase in$\dfrac{N_pN_n}{Z_0 + N_0}$ . Furthermore, we find that the linear relationships in Figs. 1-3 are relatively remarkable, except in the right sides of Figs. 2 and 3 for the cases of favored decay. Notably, some red dots in the right sides of Figs. 2 and 3 deviate significantly from the fitted line. Careful analysis of the right side of Fig. 2 reveals an interesting phenomenon: the$P_{\alpha}$ values of some odd-Z nuclei are even larger than the ones of most even–even nuclei, i.e.,$P_{\alpha}$ 0.572 for 217Fr, 0.534 for 217Ac, and 0.826 for 219Pa. Theoretically, for the odd-A and odd–odd nuclei, owing to the Pauli-blocking effect, the unpaired nucleon (s) would lead to$\alpha$ particle formation suppression; thus, the$P_{\alpha}$ of odd-A nuclei should not be extremely large. In response to above phenomenon presented in the right side of Fig. 2, we note that the neutron numbers, N, of 217Fr, 217Ac, and 219Pa are 130, 128, and 128, respectively, which are near the magic number, N = 126. Recent studies have shown that the$P_{\alpha}$ values decrease with increasing neutron number until the shell closure at N = 126, and then sharply increase with N, suggesting the important influence of the shell effect on the$\alpha$ particle preformation process in the parent nuclei [62, 63]. As we can see from the right side in Fig. 3, there are seven red dots for favored odd–odd nuclei decay; however, we can find that five of them have uncertain spin or parity from Table 4 i.e., 216At and 216Fr. Hence, the inaccuracy of the minimum angular momentum taken away by the$\alpha$ particle ($l_{\rm{min}}$ ) will, in turn, affect the$P_{\alpha}$ values extracted from the ratio of the calculated decay half-life to the experimental one.$\alpha$ transition

$Q_{\alpha}/{\rm{MeV}}$ 

${j^{\pi}_{p}}\to{j^{\pi}_{d}}$ 

$l_{\rm{min}}$ 

${P_{\alpha}}$ 

${\rm{lg}}T^{\rm{expt} }_{1/2}/{\rm{s} }$ 

${{\rm{lg}}T_{1/2}^{\rm{calc1} } }/{\rm{s} }$ 

${{\rm{lg}}T_{1/2}^{\rm{calc2} } }/{\rm{s} }$ 

nuclei in region I 186Po→182Pb 8.501 ${0^+}\to{0^+}$ 

0 0.126 $-4.469$ 

$-5.369$ 

$-4.641$ 

190Po→186Pb 7.693 ${0^+}\to{0^+}$ 

0 0.201 $-2.609$ 

$-3.307$ 

$-2.515$ 

194Po→190Pb 6.987 ${0^+}\to{0^+}$ 

0 0.176 $-0.407$ 

$-1.160$ 

$-0.293$ 

196Po→192Pb 6.658 ${0^+}\to{0^+}$ 

0 0.172 $0.754$ 

$-0.011$ 

$0.899$ 

198Po→194Pb 6.310 ${0^+}\to{0^+}$ 

0 0.114 $2.266$ 

$1.324$ 

$2.282$ 

200Po→196Pb 5.981 ${0^+}\to{0^+}$ 

0 0.082 $3.793$ 

$2.707$ 

$3.719$ 

202Po→198Pb 5.700 ${0^+}\to{0^+}$ 

0 0.069 $5.143$ 

$3.984$ 

$5.057$ 

204Po→200Pb 5.485 ${0^+}\to{0^+}$ 

0 0.059 $6.275$ 

$5.043$ 

$6.187$ 

206Po→202Pb 5.327 ${0^+}\to{0^+}$ 

0 0.052 $7.144$ 

$5.862$ 

$7.091$ 

208Po→204Pb 5.216 ${0^+}\to{0^+}$ 

0 0.031 7.961 6.457 7.793 200Rn→196Po 7.043 ${0^+}\to{0^+}$ 

0 0.200 $0.070$ 

$-0.629$ 

$0.099$ 

202Rn→198Po 6.773 ${0^+}\to{0^+}$ 

0 0.159 $1.090$ 

$0.291$ 

$1.083$ 

204Rn→200Po 6.547 ${0^+}\to{0^+}$ 

0 0.128 $2.012$ 

$1.120$ 

$1.987$ 

206Rn→202Po 6.384 ${0^+}\to{0^+}$ 

0 0.105 $2.737$ 

$1.757$ 

$2.715$ 

208Rn→204Po 6.260 ${0^+}\to{0^+}$ 

0 0.074 $3.367$ 

$2.236$ 

$3.309$ 

210Rn→206Po 6.159 ${0^+}\to{0^+}$ 

0 0.048 $3.954$ 

$2.631$ 

$3.861$ 

212Rn→208Po 6.385 ${0^+}\to{0^+}$ 

0 0.029 $3.157$ 

$1.616$ 

$3.093$ 

204Ra→200Rn 7.637 ${0^+}\to{0^+}$ 

0 0.210 $-1.222$ 

$-1.900$ 

$-1.253$ 

208Ra→204Rn 7.273 ${0^+}\to{0^+}$ 

0 0.128 $0.104$ 

$-0.789$ 

$0.039$ 

214Ra→210Rn 7.273 ${0^+}\to{0^+}$ 

0 0.048 $0.387$ 

$-0.933$ 

$0.543$ 

212Th→208Ra 7.958 ${0^+}\to{0^+}$ 

0 0.163 $-1.499$ 

$-2.287$ 

$-1.420$ 

214Th→210Ra 7.827 ${0^+}\to{0^+}$ 

0 0.131 $-1.060$ 

$-1.942$ 

$-0.869$ 

216U→212Th 8.530 ${0^+}\to{0^+}$ 

0 0.078 $-2.161$ 

$-3.266$ 

$-2.255$ 

nuclei in regions II and III 178Pb→174Hg 7.790 ${0^+}\to{0^+}$ 

0 0.380 $-3.638$ 

$-4.059$ 

$-3.568$ 

180Pb→176Hg 7.419 ${0^+}\to{0^+}$ 

0 0.220 $-2.387$ 

$-3.045$ 

$-2.554$ 

184Pb→180Hg 6.773 ${0^+}\to{0^+}$ 

0 0.160 $-0.213$ 

$-1.011$ 

$-0.520$ 

186Pb→182Hg 6.470 ${0^+}\to{0^+}$ 

0 0.099 $1.072$ 

$0.069$ 

$0.560$ 

188Pb→184Hg 6.109 ${0^+}\to{0^+}$ 

0 0.111 $2.427$ 

$1.474$ 

$1.965$ 

190Pb→186Hg 5.697 ${0^+}\to{0^+}$ 

0 0.107 $4.245$ 

$3.273$ 

$3.763$ 

192Pb→188Hg 5.221 ${0^+}\to{0^+}$ 

0 0.136 $6.546$ 

$5.680$ 

$6.170$ 

194Pb→190Hg 4.738 ${0^+}\to{0^+}$ 

0 0.019 $10.234$ 

$8.511$ 

$9.002$ 

210Pb→206Hg 3.793 ${0^+}\to{0^+}$ 

0 0.038 $16.967$ 

$15.550$ 

$16.040$ 

210Po→206Pb 5.408 ${0^+}\to{0^+}$ 

0 0.018 $7.078$ 

$5.344$ 

$5.835$ 

212Po→208Pb 8.954 ${0^+}\to{0^+}$ 

0 0.247 $-6.531$ 

$-7.138$ 

$-6.666$ 

214Po→210Pb 7.834 ${0^+}\to{0^+}$ 

0 0.268 $-3.786$ 

$-4.358$ 

$-3.903$ 

216Po→212Pb 6.907 ${0^+}\to{0^+}$ 

0 0.262 $-0.839$ 

$-1.420$ 

$-0.981$ 

Continued on next page Table 1. Calculations of the
$\alpha$ decay half-lives in logarithmic form and the$\alpha$ preformation factors of the even–even nuclei in regions I–III around the Z = 82, N = 126 closed shells. The experimental$\alpha$ decay half-lives, spin, and parity are taken from the latest evaluated nuclear properties table, NUBASE2016 [59]. The$\alpha$ decay energies,${Q_{\alpha}}$ , are taken from the latest evaluated atomic mass table, AME2016 [60, 61]. The$\alpha$ preformation factors,${P_{\alpha}}$ , are extracted from the ratios of the calculated$\alpha$ decay half-lives to the experimental data [23-25], where the calculated$\alpha$ decay half-lives are obtained by the GLDM.Table 1-continued from previous page $\alpha$ transition

$Q_{\alpha}/{\rm{MeV}}$ 

${j^{\pi}_{p}}\to{j^{\pi}_{d}}$ 

$l_{\rm{min}}$ 

${P_{\alpha}}$ 

${\rm{lg}}T^{\rm{expt}}_{1/2}/{\rm{s}}$ 

${{\rm{lg}}T_{1/2}^{\rm{calc1}}}/{\rm{s}}$ 

${{\rm{lg}}T_{1/2}^{\rm{calc2}}}/{\rm{s}}$ 

218Po→214Pb 6.115 ${0^+}\to{0^+}$ 

0 0.276 2.269 1.711 2.134 214Rn→210Po 9.208 ${0^+}\to{0^+}$ 

0 0.321 $-6.569$ 

$-7.062$ 

$-6.606$ 

216Rn→212Po 8.198 ${0^+}\to{0^+}$ 

0 0.497 $-4.347$ 

$-4.650$ 

$-4.227$ 

218Rn→214Po 7.263 ${0^+}\to{0^+}$ 

0 0.412 $-1.472$ 

$-1.857$ 

$-1.464$ 

220Rn→216Po 6.405 ${0^+}\to{0^+}$ 

0 0.388 $1.745$ 

$1.334$ 

$1.698$ 

216Ra→212Rn 9.526 ${0^+}\to{0^+}$ 

0 0.416 $-6.740$ 

$-7.121$ 

$-6.682$ 

218Ra→214Rn 8.546 ${0^+}\to{0^+}$ 

0 0.530 $-4.599$ 

$-4.874$ 

$-4.481$ 

216Th→212Ra 8.072 ${0^+}\to{0^+}$ 

0 0.073 $-1.585$ 

$-2.724$ 

$-2.234$ 

218Th→214Ra 9.849 ${0^+}\to{0^+}$ 

0 0.582 $-6.932$ 

$-7.167$ 

$-6.744$ 

220Th→216 Ra 8.953 ${0^+}\to{0^+}$ 

0 0.604 $-5.013$ 

$-5.232$ 

$-4.868$ 

218U→214Th 8.775 ${0^+}\to{0^+}$ 

0 0.199 $-3.260$ 

$-3.961$ 

$-3.470$ 

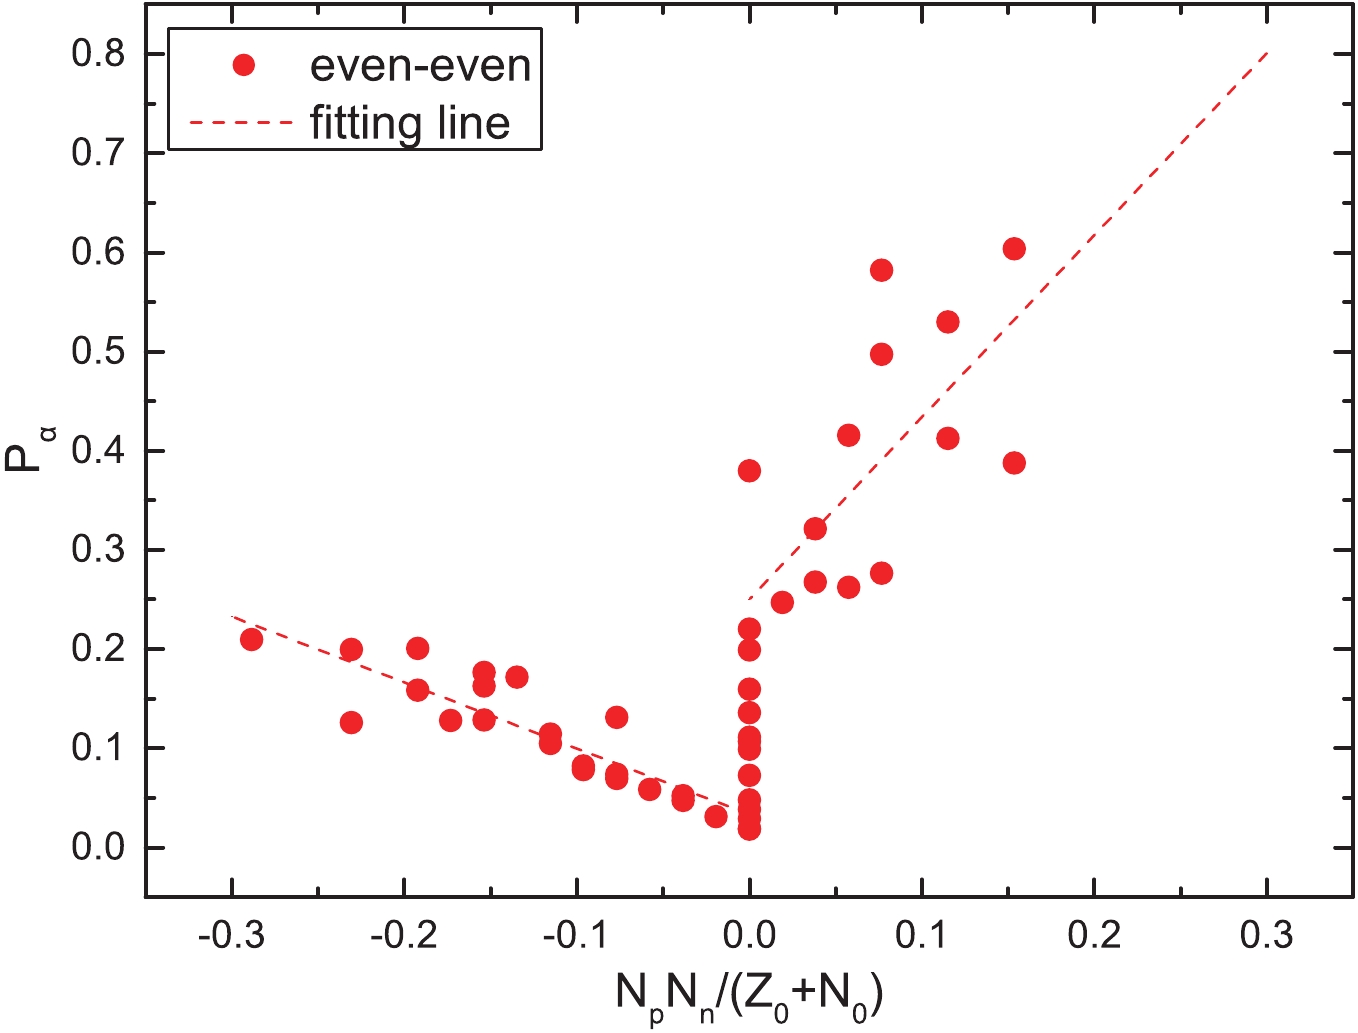
Figure 1. (color online)
$\alpha$ preformation factors of the even–even nuclei around the$Z_0$ = 82 and$N_0$ = 126 shell closures as a function of$\dfrac{N_pN_n}{N_0 + Z_0}$ , where$N_p$ and$N_n$ denote the numbers of valence protons (holes) and neutrons (holes) of the parent nucleus, respectively. The dashed lines are the fittings of the$\alpha$ preformation factors.$\alpha$ transition

$Q_{\alpha}/{{\rm MeV}}$ 

${j^{\pi}_{p}}\to{j^{\pi}_{d}}$ 

$l_{\rm{min}}$ 

${P_{\alpha}}$ 

${\rm{lg}}T^{\rm{expt}}_{1/2}/{{\rm s}}$ 

${\rm{lg}}T_{1/2}^{\rm{calc1}}/{{\rm s}}$ 

${{\rm{lg}}T_{1/2}^{{\rm calc2}}}/{{\rm s}}$ 

nuclei in region I 195Po→191Pb 6.745 ${(3/2^-)}\to{(3/2^-)}$ 

0 0.100 $0.692$ 

$-0.309$ 

$0.687$ 

197Po→193Pb 6.405 ${(3/2^-)}\to{(3/2^-)}$ 

0 0.076 $2.079$ 

$0.960$ 

$2.014$ 

199Po→195Pb 6.075 ${(3/2^-)}\to{3/2^-}$ 

0 0.047 $3.639$ 

$2.314$ 

$3.434$ 

201Po→197Pb 5.799 ${3/2^-}\to{3/2^-}$ 

0 0.042 $4.917$ 

$3.541$ 

$4.740$ 

205Po→201Pb 5.325 ${5/2^-}\to{5/2^-}$ 

0 0.050 $7.185$ 

$5.887$ 

$7.309$ 

207Po→203Pb 5.216 ${5/2^-}\to{5/2^-}$ 

0 0.030 $7.993$ 

$6.473$ 

$8.071$ 

197At→193Bi 7.105 ${(9/2^-)}\to{(9/2^-)}$ 

0 0.155 $-0.394$ 

$-1.205$ 

$-0.347$ 

199At→195Bi 6.778 ${9/2^{(-)}}\to{9/2^{(-)}}$ 

0 0.106 $0.894$ 

$-0.080$ 

$0.841$ 

201At→197Bi 6.473 ${(9/2^-)}\to{(9/2^-)}$ 

0 0.095 $2.076$ 

$1.053$ 

$2.048$ 

203At→199Bi 6.210 ${9/2^-}\to{9/2^-}$ 

0 0.087 $3.152$ 

$2.091$ 

$3.176$ 

205At→201Bi 6.019 ${9/2^-}\to{9/2^-}$ 

0 0.040 $4.299$ 

$2.901$ 

$4.101$ 

207At→203Bi 5.873 ${9/2^-}\to{9/2^-}$ 

0 0.054 $4.814$ 

$3.549$ 

$4.903$ 

209At→205Bi 5.757 ${9/2^-}\to{9/2^-}$ 

0 0.025 $5.672$ 

$4.068$ 

$5.666$ 

211At→207Bi 5.983 ${9/2^-}\to{9/2^-}$ 

0 0.014 $4.793$ 

$2.945$ 

$5.144$ 

195Rn→191Po 7.694 ${3/2^-}\to{(3/2^-)}$ 

0 0.322 $-2.155$ 

$-2.647$ 

$-1.991$ 

197Rn→193Po 7.410 ${(3/2^-)}\to{(3/2^-)}$ 

0 0.289 $-1.268$ 

$-1.807$ 

$-1.099$ 

203Rn→199Po 6.629 ${3/2^-\#}\to{(3/2^-)}$ 

0 0.101 $1.818$ 

$0.825$ 

$1.745$ 

207Rn→203Po 6.251 ${5/2^-}\to{5/2^-}$ 

0 0.076 $3.417$ 

$2.299$ 

$3.458$ 

209Rn→205Po 6.155 ${5/2^-}\to{5/2^-}$ 

0 0.048 $4.000$ 

$2.683$ 

$4.037$ 

199Fr→195At 7.816 ${1/2^+\#}\to{1/2^+}$ 

0 0.298 $-2.180$ 

$-2.706$ 

$-2.063$ 

201Fr→197At 7.519 ${(9/2^-)}\to{(9/2^-)}$ 

0 0.231 $-1.202$ 

$-1.839$ 

$-1.130$ 

203Fr→199At 7.274 ${9/2^-}\to{9/2^{(-)}}$ 

0 0.146 $-0.260$ 

$-1.096$ 

$-0.312$ 

205Fr→201At 7.054 ${9/2^-}\to{(9/2^-)}$ 

0 0.112 $0.582$ 

$-0.370$ 

$0.507$ 

207Fr→203At 6.894 ${9/2^-}\to{9/2^-}$ 

0 0.096 $1.190$ 

$0.171$ 

$1.167$ 

209Fr→205At 6.777 ${9/2^-}\to{9/2^-}$ 

0 0.064 $1.753$ 

$0.561$ 

$1.719$ 

Continued on next page Table 2. Same as Table 1, but for the favored
$\alpha$ decay of the odd-A nuclei around the Z = 82, N = 126 shell closures. “()” represents uncertain spin and/or parity, and “#” represents values estimated from trends in neighboring nuclides with the same Z and N parities.Table 2-continued from previous page $\alpha$ transition

$Q_{\alpha}/{\rm{MeV}}$ 

${j^{\pi}_{p}}\to{j^{\pi}_{d}}$ 

$l_{\rm{min}}$ 

${P_{\alpha}}$ 

${\rm{lg}}T^{\rm{expt}}_{1/2}/{\rm{s}}$ 

${{\rm{lg}}T_{1/2}^{\rm{calc1}}}/{\rm{s}}$ 

${{\rm{lg}}T_{1/2}^{\rm{calc2}}}/{\rm{s}}$ 

211Fr→207At 6.662 ${9/2^-}\to{9/2^-}$ 

0 0.043 $2.328$ 

$0.958$ 

$2.379$ 

213Fr→209At 6.905 ${9/2^-}\to{9/2^-}$ 

0 0.028 $1.535$ 

$-0.014$ 

$2.185$ 

203Ra→199Rn 7.735 ${(3/2^-)}\to{(3/2^-)}$ 

0 0.185 $-1.444$ 

$-2.177$ 

$-1.509$ 

209Ra→205Rn 7.143 ${5/2^-}\to{5/2^-}$ 

0 0.092 $0.673$ 

$-0.363$ 

$0.632$ 

205Ac→201Fr 8.096 ${9/2^-\#}\to{(9/2^-)}$ 

0 0.016 $-1.097$ 

$-2.904$ 

$-2.261$ 

207Ac→203Fr 7.849 ${9/2^-\#}\to{9/2^-}$ 

0 0.197 $-1.509$ 

$-2.214$ 

$-1.477$ 

211Ac→207Fr 7.619 ${9/2^-}\to{9/2^-}$ 

0 0.117 $-0.672$ 

$-1.605$ 

$-0.582$ 

213Pa→209Ac 8.395 ${9/2^-\#}\to{(9/2^-)}$ 

0 0.094 $-2.155$ 

$-3.184$ 

$-2.263$ 

215Pa→211Ac 8.235 ${9/2^-\#}\to{9/2^-}$ 

0 0.116 $-1.854$ 

$-2.791$ 

$-1.591$ 

nuclei in regions II and III 177Tl→173Au 7.066 ${(1/2^+)}\to{(1/2^+)}$ 

0 0.223 $-1.609$ 

$-0.652$ 

$-1.821$ 

179Tl→175Au 6.705 ${1/2^+}\to{1/2^+}$ 

0 0.188 $-0.356$ 

$-0.726$ 

$-0.634$ 

213Po→209Pb 8.536 ${9/2^+}\to{9/2^+}$ 

0 0.177 $-5.431$ 

$-0.752$ 

$-5.641$ 

215Po→211Pb 7.527 ${9/2^+}\to{9/2^+}$ 

0 0.193 $-2.750$ 

$-0.714$ 

$-2.942$ 

219Po→215Pb 5.916 ${9/2^+\#}\to{9/2^+\#}$ 

0 0.179 $3.340$ 

$-0.747$ 

$3.082$ 

213At→209Bi 9.254 ${9/2^-}\to{9/2^-}$ 

0 0.274 $-6.903$ 

$-0.562$ 

$-6.925$ 

215At→211Bi 8.178 ${9/2^-}\to{9/2^-}$ 

0 0.112 $-4.000$ 

$-0.951$ 

$-4.438$ 

217At→213Bi 7.202 ${9/2^-}\to{9/2^-}$ 

0 0.273 $-1.487$ 

$-0.564$ 

$-1.564$ 

219At→215Bi 6.342 ${(9/2^-)}\to{(9/2^-)}$ 

0 0.242 $1.777$ 

$-0.616$ 

$1.623$ 

215Rn→211Po 8.839 ${9/2^+}\to{9/2^+}$ 

0 0.249 $-5.638$ 

$-0.604$ 

$-5.728$ 

217Rn→213Po 7.888 ${9/2^+}\to{9/2^+}$ 

0 0.296 $-3.268$ 

$-0.529$ 

$-3.316$ 

215Fr→211At 9.541 ${9/2^-}\to{9/2^-}$ 

0 0.405 $-7.066$ 

$-0.393$ 

$-6.937$ 

217Fr→213At 8.470 ${9/2^-}\to{9/2^-}$ 

0 0.572 $-4.775$ 

$-0.243$ 

$-4.538$ 

219Fr→215At 7.449 ${9/2^-}\to{9/2^-}$ 

0 0.395 $-1.699$ 

$-0.403$ 

$-1.662$ 

2137Ra→213Rn 9.161 ${(9/2^+)}\to{9/2^+\#}$ 

0 0.286 $-5.788$ 

$-0.544$ 

$-5.845$ 

215Ac→211Fr 7.746 ${9/2^-}\to{9/2^-}$ 

0 0.046 $-0.770$ 

$-1.337$ 

$-1.536$ 

217Ac→213Fr 9.832 ${9/2^-}\to{9/2^-}$ 

0 0.534 $-7.161$ 

$-0.272$ 

$-6.929$ 

219Ac→215Fr 8.827 ${9/2^-}\to{9/2^-}$ 

0 0.480 $-4.928$ 

$-0.319$ 

$-4.800$ 

219Th→215Ra 9.511 ${9/2^+\#}\to{9/2^+\#}$ 

0 0.312 $-5.991$ 

$-0.506$ 

$-6.034$ 

217Pa→213Ac 8.488 ${9/2^-\#}\to{9/2^-\#}$ 

0 0.082 $-2.458$ 

$-1.086$ 

$-2.975$ 

219Pa→215 Ac 10.084 ${9/2^-}\to{9/2^-}$ 

0 0.826 $-7.276$ 

$-0.083$ 

$-6.871$ 

221Pa→217Ac 9.251 ${9/2^-}\to{9/2^-}$ 

0 0.415 $-5.229$ 

$-0.382$ 

$-5.193$ 

221U→217Th 9.889 ${(9/2^+)}\to{9/2^+\#}$ 

0 0.312 $-6.180$ 

$-0.506$ 

$-6.246$ 

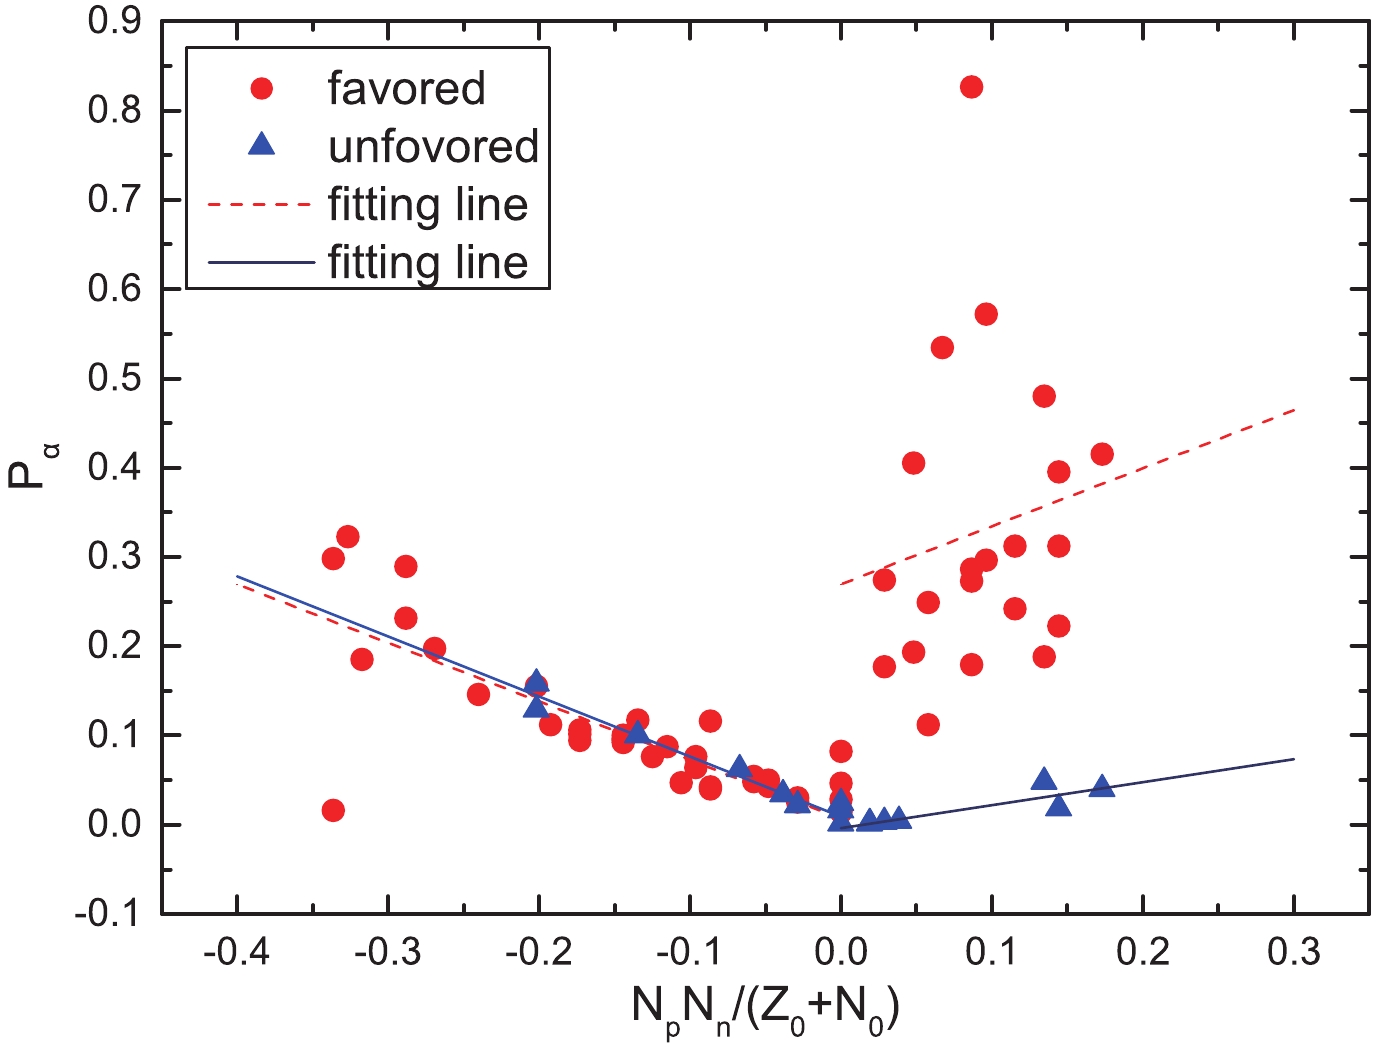
Figure 2. (color online) Same as Fig. 1, but it represents the
$\alpha$ preformation factors as a function of$\dfrac{N_pN_n}{N_0 + Z_0}$ of the odd-A nuclei.$\alpha$ transition

$Q_{\alpha}/{\rm{MeV}}$ 

${j^{\pi}_{p}}\to{j^{\pi}_{d}}$ 

$l_{\rm{min}}$ 

${P_{\alpha}}$ 

${\rm{lg} }T^{\rm{expt} }_{1/2}/{\rm{s} }$ 

${{\rm{lg}}T_{1/2}^{\rm{calc1}}}/{\rm{s}}$ 

${{\rm{lg}}T_{1/2}^{\rm{calc2}}}/{\rm{s}}$ 

nuclei in region I 209Bi→205Tl 3.138 ${9/2^-}\to{1/2^+}$ 

5 0.001 $26.802$ 

$23.934$ 

$25.999$ 

189Po→185Pb 7.694 ${(5/2^-)}\to{3/2^-}$ 

2 0.158 $-2.420$ 

$-3.223$ 

$-2.383$ 

203Po→199Pb 5.496 ${5/2^-}\to{3/2^-}$ 

2 0.062 $6.294$ 

$5.085$ 

$6.353$ 

205Rn→201Po 6.386 ${5/2^-\#}\to{3/2^-\#}$ 

2 0.100 $2.837$ 

$1.840$ 

$2.843$ 

207Ra→203Rn 7.269 ${1/2^-}\to{5/2^-}$ 

2 0.129 $0.205$ 

$-0.683$ 

$0.157$ 

213Ra→209Rn 6.862 ${(1/2^-)}\to{5/2^{(-)}}$ 

2 0.022 $2.309$ 

$0.641$ 

$2.194$ 

215Th→211Ra 7.665 ${1/2^-\#}\to{5/2^-\#}$ 

2 0.034 $0.079$ 

$-1.387$ 

$0.074$ 

nuclei in regions II and III 187Pb→183Hg 6.393 ${3/2^-}\to{1/2^-}$ 

2 0.016 $2.203$ 

$0.406$ 

$2.471$ 

189Pb→185Hg 5.915 ${3/2^-}\to{1/2^-}$ 

2 0.024 $3.989$ 

$2.375$ 

$4.440$ 

213Bi→209Ti 5.988 ${9/2^-}\to{1/2^+}$ 

5 0.001 $5.116$ 

$2.256$ 

$5.214$ 

213Rn→209Po 8.245 ${9/2^+\#}\to{1/2^-}$ 

5 0.002 $-1.710$ 

$-4.444$ 

$-1.486$ 

219Rn→215Po 6.946 ${5/2^+}\to{9/2^+}$ 

2 0.048 $0.598$ 

$-0.720$ 

$0.794$ 

221Rn→217Po 6.162 ${7/2^+}\to{(9/2^+)}$ 

2 0.040 $3.844$ 

$2.442$ 

$3.835$ 

215Ra→211Rn 8.864 ${9/2^+\#}\to{1/2^-}$ 

5 0.003 $-2.777$ 

$-5.364$ 

$-2.916$ 

219Ra→215Rn 8.138 ${(7/2^+)}\to{9/2^+}$ 

2 0.018 $-2.000$ 

$-3.754$ 

$-2.274$ 

217Th→213 Ra 9.435 ${9/2^+\#}\to{1/2^-}$ 

5 0.004 $-3.607$ 

$-6.048$ 

$-3.828$ 

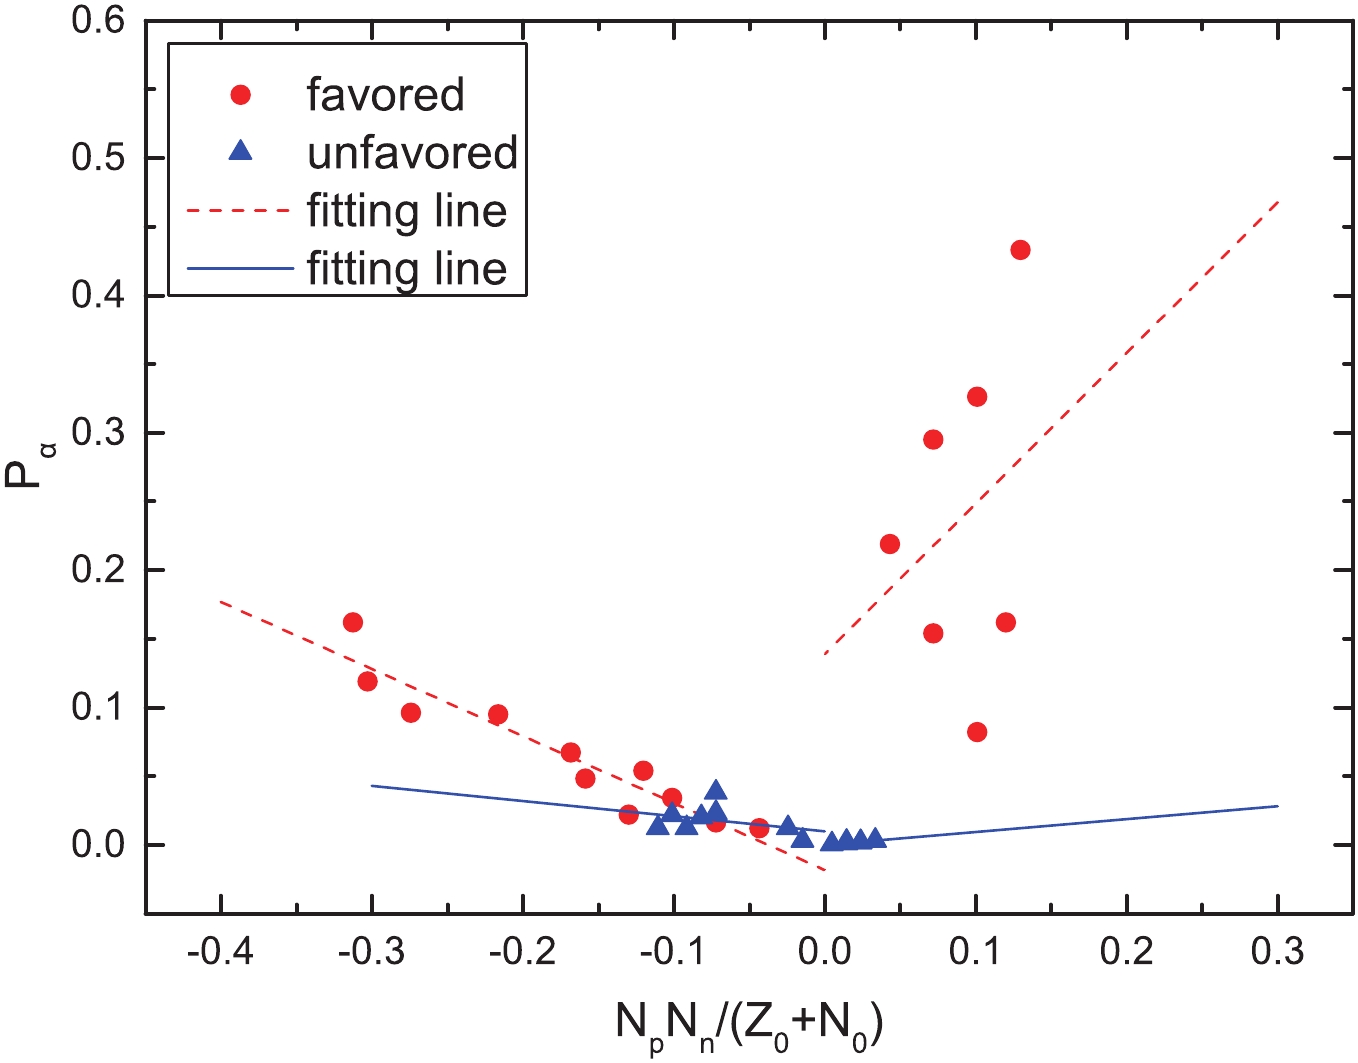
Figure 3. (color online) Same as Fig. 1, but it represents the
$\alpha$ preformation factors as a function of$\dfrac{N_pN_n}{N_0 + Z_0}$ of the doubly-odd nuclei.$\alpha$ transition

$Q_{\alpha}/{\rm{MeV}}$ 

${j^{\pi}_{p}}\to{j^{\pi}_{d}}$ 

$l_{\rm{min}}$ 

${P_{\alpha}}$ 

${\rm{lg}}T^{\rm{expt}}_{1/2}/{\rm{s}}$ 

${{\rm{lg}}T_{1/2}^{\rm{calc1}}}/{\rm{s}}$ 

${{\rm{lg}}T_{1/2}^{\rm{calc2}}}/{\rm{s}}$ 

nuclei in region I 192At→188Bi 7.696 ${3^+\#}\to{3^+\#}$ 

0 0.115 $-1.939$ 

$-2.957$ 

$-2.019$ 

200At→196Bi 6.596 ${(3^+)}\to{(3^+)}$ 

0 0.059 $1.917$ 

$0.594$ 

$1.823$ 

202At→198Bi 6.353 ${3^{(+)}}\to{3^{(+)}}$ 

0 0.045 $3.161$ 

$1.511$ 

$2.857$ 

204At→200Bi 6.071 ${7^+}\to{7^+}$ 

0 0.031 $4.156$ 

$2.689$ 

$4.198$ 

206At→202Bi 5.886 ${(5)^+}\to{5^{(+\#)}}$ 

0 0.017 $5.306$ 

$3.506$ 

$5.279$ 

208At→204Bi 5.751 ${6^+}\to{6^+}$ 

0 0.003 $6.023$ 

$4.114$ 

$6.667$ 

200Fr→196At 7.615 ${(3^+)}\to{(3^+)}$ 

0 0.134 $-1.323$ 

$-2.113$ 

$-1.240$ 

204Fr→200At 7.170 ${3^+}\to{(3^+)}$ 

0 0.087 $0.260$ 

$-0.764$ 

$0.295$ 

206Fr→202At 6.924 ${3^+}\to{3^{(+)}}$ 

0 0.064 $1.258$ 

$0.084$ 

$1.279$ 

208Fr→204At 6.784 ${7^+}\to{7^+}$ 

0 0.040 $1.821$ 

$0.555$ 

$1.950$ 

206Ac→202Fr 7.959 ${(3^+)}\to{3^+}$ 

0 0.129 $-1.602$ 

$-2.528$ 

$-1.640$ 

nuclei in regions II and III 214At→210Bi 8.987 ${1^-}\to{1^-}$ 

0 0.186 $-6.253$ 

$-6.912$ 

$-6.182$ 

216At→212Bi 7.950 ${1^{(-)}}\to{1^{(-)}}$ 

0 0.218 $-3.523$ 

$-4.336$ 

$-3.674$ 

218At→214Bi 6.874 ${1^-\#}\to{1^-}$ 

0 0.249 $0.176$ 

$-0.910$ 

$-0.307$ 

216Fr→212At 9.175 ${(1^-)}\to{(1^-)}$ 

0 0.218 $-6.155$ 

$-6.685$ 

$-6.022$ 

218Fr→214At 8.014 ${1^-}\to{1^-}$ 

0 0.270 $-3.000$ 

$-3.791$ 

$-3.223$ 

218Ac→214Fr 9.374 ${1^-\#}\to{(1^-)}$ 

0 0.249 $-6.000$ 

$-6.487$ 

$-5.884$ 

220Pa→216Ac 9.651 ${1^-\#}\to{(1^-)}$ 

0 0.281 $-6.108$ 

$-6.471$ 

$-5.920$ 

$\alpha$ transition

$Q_{\alpha}/{\rm{MeV}}$ 

${j^{\pi}_{p}}\to{j^{\pi}_{d}}$ 

$l_{\rm{min}}$ 

${P_{\alpha}}$ 

${\rm{lg}}T^{\rm{expt}}_{1/2}/{\rm{s}}$ 

${{\rm{lg}}T_{1/2}^{\rm{calc1}}}/{\rm{s}}$ 

${{\rm{lg}}T_{1/2}^{\rm{calc2}}}/{\rm{s}}$ 

nuclei in region I 186Bi→182Tl 7.757 ${(3^+)}\to{(2^-)}$ 

1 0.012 $-1.830$ 

$-3.749$ 

$-2.092$ 

190Bi→186Tl 6.862 ${(3^+)}\to{(2^-)}$ 

1 0.012 $0.912$ 

$0.688$ 

$3.704$ 

192Bi→188Tl 6.381 ${(3^+)}\to{(2^-)}$ 

1 0.020 $2.442$ 

$2.478$ 

$2.852$ 

194Bi→190Tl 5.918 ${(3^+)}\to{(2^-)}$ 

1 0.023 $4.313$ 

$4.420$ 

$2.697$ 

210At→206Bi 5.631 ${(5)^+}\to{(6)^+}$ 

2 0.003 $7.221$ 

$6.687$ 

$6.125$ 

210Fr→206At 6.672 ${6^+}\to{(5)^+}$ 

2 0.038 $2.427$ 

$2.755$ 

$2.019$ 

212Fr→208At 6.529 ${5^+}\to{6^+}$ 

2 0.012 $3.444$ 

$3.442$ 

$3.626$ 

212Pa→208Ac 8.415 ${7^+\#}\to{(3^+)}$ 

4 0.021 $-2.125$ 

$-3.794$ 

$-2.116$ 

nuclei in regions II and III 210Bi→206Tl 5.037 ${1^-}\to{0^-}$ 

2 2.330E-05 $11.616$ 

$10.343$ 

$21.455$ 

212Bi→208Tl 6.207 ${1^{(-)}}\to{5^+}$ 

5 0.002 $4.005$ 

$4.171$ 

$7.326$ 

214Bi→210Tl 5.621 ${1^-}\to{5^+\#}$ 

5 0.002 $6.753$ 

$6.667$ 

$7.478$ 

212At→208Bi 7.817 ${(1^-)}\to{5^+}$ 

5 0.001 $-0.503$ 

$-0.719$ 

$9.542$ 

214Fr→210At 8.588 ${(1^-)}\to{(5)^+}$ 

5 0.002 $-2.286$ 

$-2.359$ 

$7.413$ 

216Ac→212Fr 9.235 ${(1^-)}\to{5^+}$ 

5 0.003 $-3.357$ 

$-3.423$ 

$6.596$ 

In 2018, based on the single-particle energy spectra obtained by the relativistic Hartree–Bogoliubov mean field model [64], Sun and Zhang defined the microscopic valence nucleon (holes) numbers (
${\Omega}_{\pi}, {\Omega}_{\nu}$ ) and proposed two different formulas to calculate$P_{\alpha}$ , which can be expressed as [65]$P_{\alpha} = a\,{\Omega}_{\pi} {\Omega}_{\nu}\,\left\{1 + b\,\rm{exp} \left[-\frac{({\lambda}_{\pi} - {\lambda}_{\nu})^2} {2 {\sigma}^2}\right]\right\}, $

(14) $P_{\alpha} = a_{{nn},{nh}}\,{\Omega}_{\pi} {\Omega}_{\nu}. $

(15) Here, parameters a, b, and
$\sigma$ in Eq. (14) as well as$a_{{nn},{nh}}$ in Eq. (15) correspond to the valence proton–neutron interaction strength.In their study, using the above formulas, they systematically investigated the
$\alpha$ decay preformation factors,$P_{\alpha}$ , for even–even polonium, radon, radium, and thorium isotopes. Based on the calculated results of their study, we plot$P_{\alpha}$ as a function of$\dfrac{N_pN_n}{Z_0 + N_0}$ in Figs. 4 and 5. In these figures, the blue opened squares represent the even–even nuclei extracted from the study of Sun and Zhang, which are located around the shell closures, and the blue dashed lines represent the fittings of the$P_{\alpha}$ . As we can see from these figures, like Fig. 1, for the case of even–even nuclei, the$P_{\alpha}$ obtained by Eq. (14) and Eq. (15) also have a noticeable linear relationship with$\dfrac{N_pN_n}{Z_0 + N_0}$ . This phenomenon further suggests that this linear relationship is not model-dependent. Furthermore, for the case of unfavored$\alpha$ decay, from Figs. 2 and 3, we find that the values of$P_{\alpha}$ are relatively small relative to those for the favored$\alpha$ decay. The reasons may be the influence of the centrifugal potential, which reduces the$\alpha$ decay width, or the nuclear structure configuration changes. Combining with the analysis results of Figs. 1-3, we suspect the linear relationship between$P_{\alpha}$ and$N_pN_n$ for all kinds of nuclei may be related to the effect of the valence proton–neutron interaction around shell closures. In order to more deeply study the relationship between$\alpha$ preformation factors$P_{\alpha}$ and$N_pN_n$ , all the cases of$P_{\alpha}$ can be obtained by the linear relationship.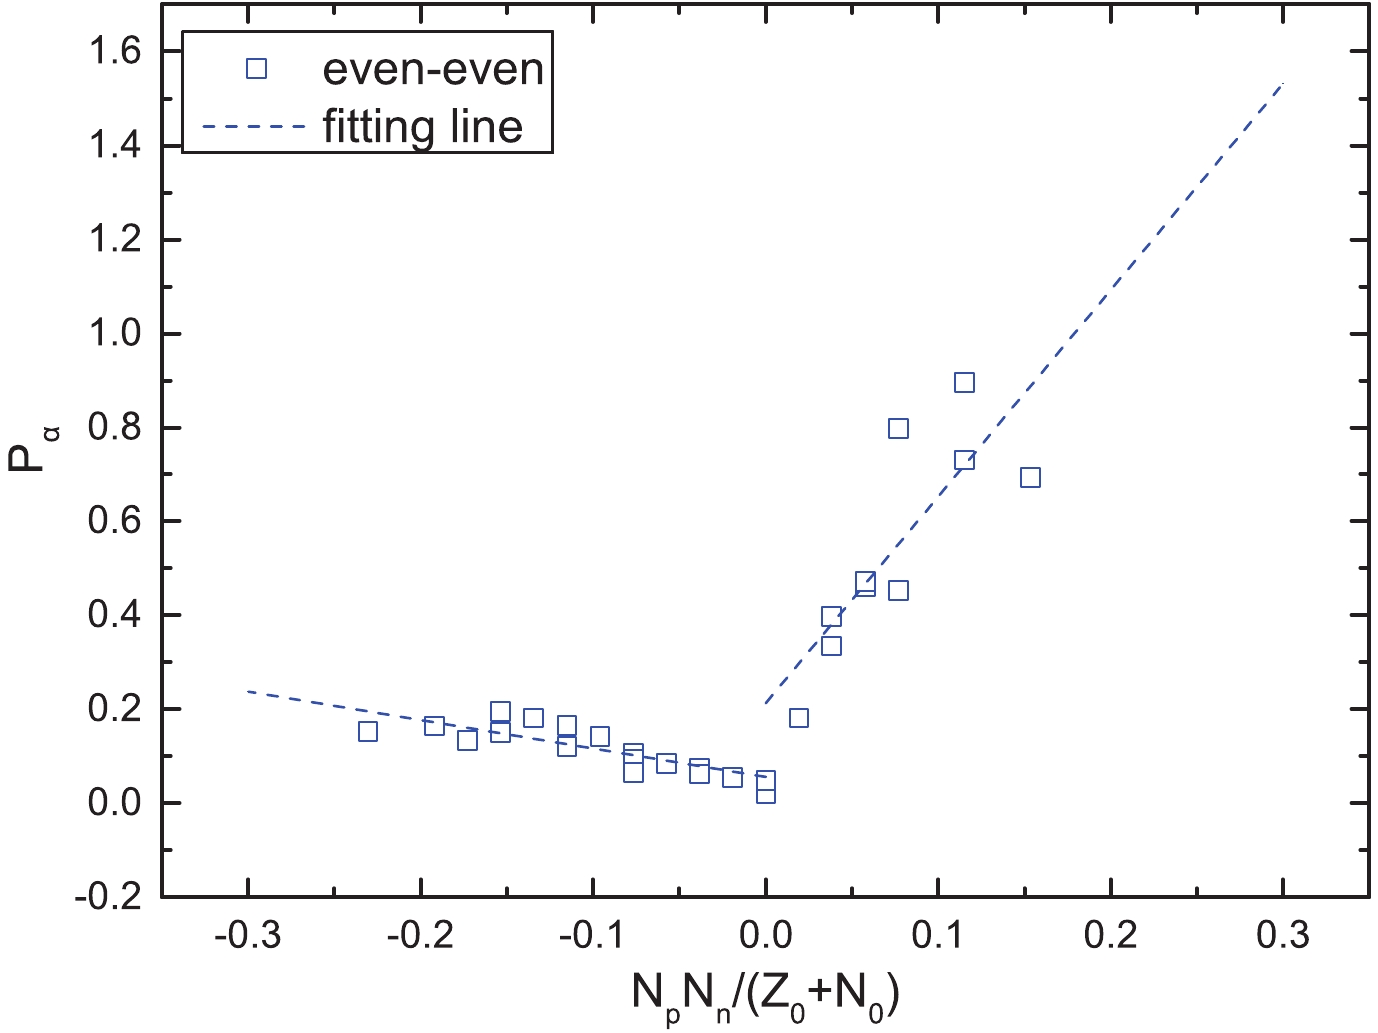
Figure 4. (color online)
$\alpha$ preformation factors$P_{\alpha}$ of the even–even nuclei around the$Z_0$ = 82 and$N_0$ = 126 shell closures as a function of$\dfrac{N_pN_n}{N_0 + Z_0}$ , where$P_{\alpha}$ are obtained by Eq. (14). The blue open squares denote the even–even nuclei around the shell closures, and the blue dashed lines are the fittings of$P_{\alpha}$ .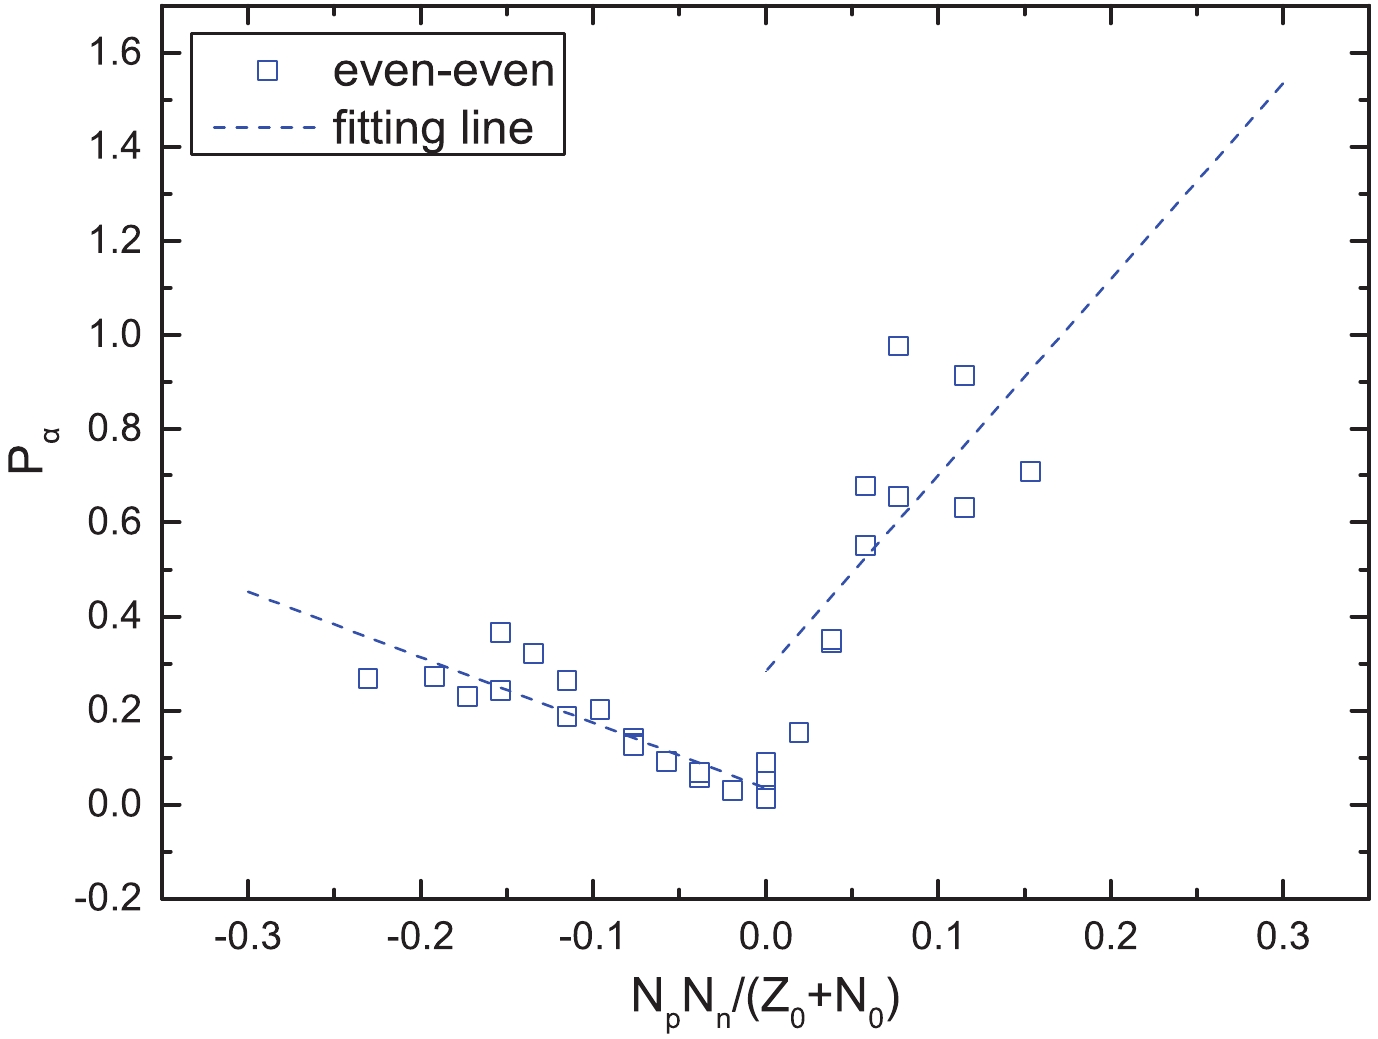
Figure 5. (color online) Same as Fig. 4, but the
$\alpha$ preformation factors,$P_{\alpha}$ , are calculated by Eq. (15).$P_{\alpha} = a \frac{N_pN_n}{Z_0 + N_0}+b. $

(16) Here, a and b are adjustable parameters, which are extracted from the fittings of Figs. 1-3 and listed in Table 6. In theory, combining these parameters and Eq. (15), one can obtain the fitted
$P_{\alpha}$ .region favored decay unfavored decay a b a b even–even nuclei I −0.66547 0.03339 − − II, III 1.8334 0.25035 − − odd-A nuclei I −0.65688 0.00632 −0.67342 0.00862 II, III 0.64805 0.26947 0.2559 −0.00382 doubly-odd nuclei I −0.48781 −0.01831 −0.10994 0.00988 II, III 1.0972 0.13849 0.09388 $-1.34923\times10^{-4}$ 

Table 6. Fitted parameters of Eq. (16).
We systematically calculate the
$\alpha$ decay half-lives of the 152 nuclei using the GLDM. All the numerical results are listed in Tables 1- 5. In these tables, the first five columns denote the$\alpha$ transition,$\alpha$ decay energy$Q_{\alpha}$ as taken from the latest evaluated atomic mass table, AME2016 [60, 61], spin-parity transformation (${j^{\pi}_{p}}\to{j^{\pi}_{d}}$ ), minimum orbital angular momentum$l_{\rm{min}}$ taken away by the$\alpha$ particle, and$\alpha$ preformation factor, respectively. The sixth column denotes the logarithmic form of the experimental$\alpha$ decay half-life denoted as${{\rm{lg}}T_{1/2}^{\rm{exp}}}$ . The last two columns denote the logarithmic form of the calculated$\alpha$ decay half-life using the GLDM without considering$P_{\alpha}$ and with fitting$P_{\alpha}$ calculated by Eq. (15), which are denoted as${{\rm{lg}}T_{1/2}^{\rm{calc1}}}$ and${{\rm{lg}}T_{1/2}^{\rm{calc2}}}$ , respectively. Simultaneously, each table is divided into two parts: region I and regions II and III. As can be seen from Tables 1-5, relative to${{\rm{lg}}T_{1/2}^{\rm{calc1}}}$ ,${{\rm{lg}}T_{1/2}^{\rm{calc2}}}$ can better reproduce the experimental data. More intuitively, we calculate the standard deviation,$\sigma$ =$\sqrt{\sum{({\rm{log}}_{10}{T_{1/2}^{\rm{calc}}} \!-\! {\rm{log}}_{10}{T_{1/2}^{\rm{exp}}})^2}/n}$ , between the calculated$\alpha$ decay half-lives and the experimental data. The calculated results are summarized in Table 7. In this table,$\sigma_1$ and$\sigma_2$ represent the standard deviations between$T^{\rm{calc1}}_{1/2}$ ,$T^{\rm{calc2}}_{1/2}$ and$T^{\rm{exp}}_{1/2}$ , respectively. As we can see from Table 7, it is noticeable that for all the kinds of nuclei, the values of$\sigma_1$ are much larger than the values of$\sigma_2$ . The maximum value of$\sigma_2$ is only 0.40, which suggests that the calculated$\alpha$ decay half-lives using the GLDM with the fitting of$P_{\alpha}$ calculated by Eq. (15) can better reproduce the experimental data. Moreover, for more clearly indicating the agreement between the calculations using the GLDM with the fitting$P_{\alpha}$ and the experimental data, we plot the logarithm deviation between the calculated results and experimental data for all kinds of nuclei in Figs. 6(a)-6(c). In Figs. 6(a)-6(c), the opened blue circles denote the logarithm deviation between the calculated results and the experimental data for the cases of favored$\alpha$ decay for all the kinds of nuclei. The red circles in Figs. 6(b)- 6(c) denote the cases of unfavored$\alpha$ decay for the odd-A and odd–odd nuclei, respectively. One can see from Figs. 6(a)-6(c), the values of${\rm{log}}_{10}T_{1/2}^{\rm{cal}} - {\rm{log}}_{10}T_{1/2}^{\rm{exp}}$ are basically between -0.4 and 0.4. This indicates that the GLDM with the fitting of$P_{\alpha}$ can be treated as a useful tool to study the$\alpha$ decay half-lives of the nuclei around the Z = 82, N = 126 shell closures.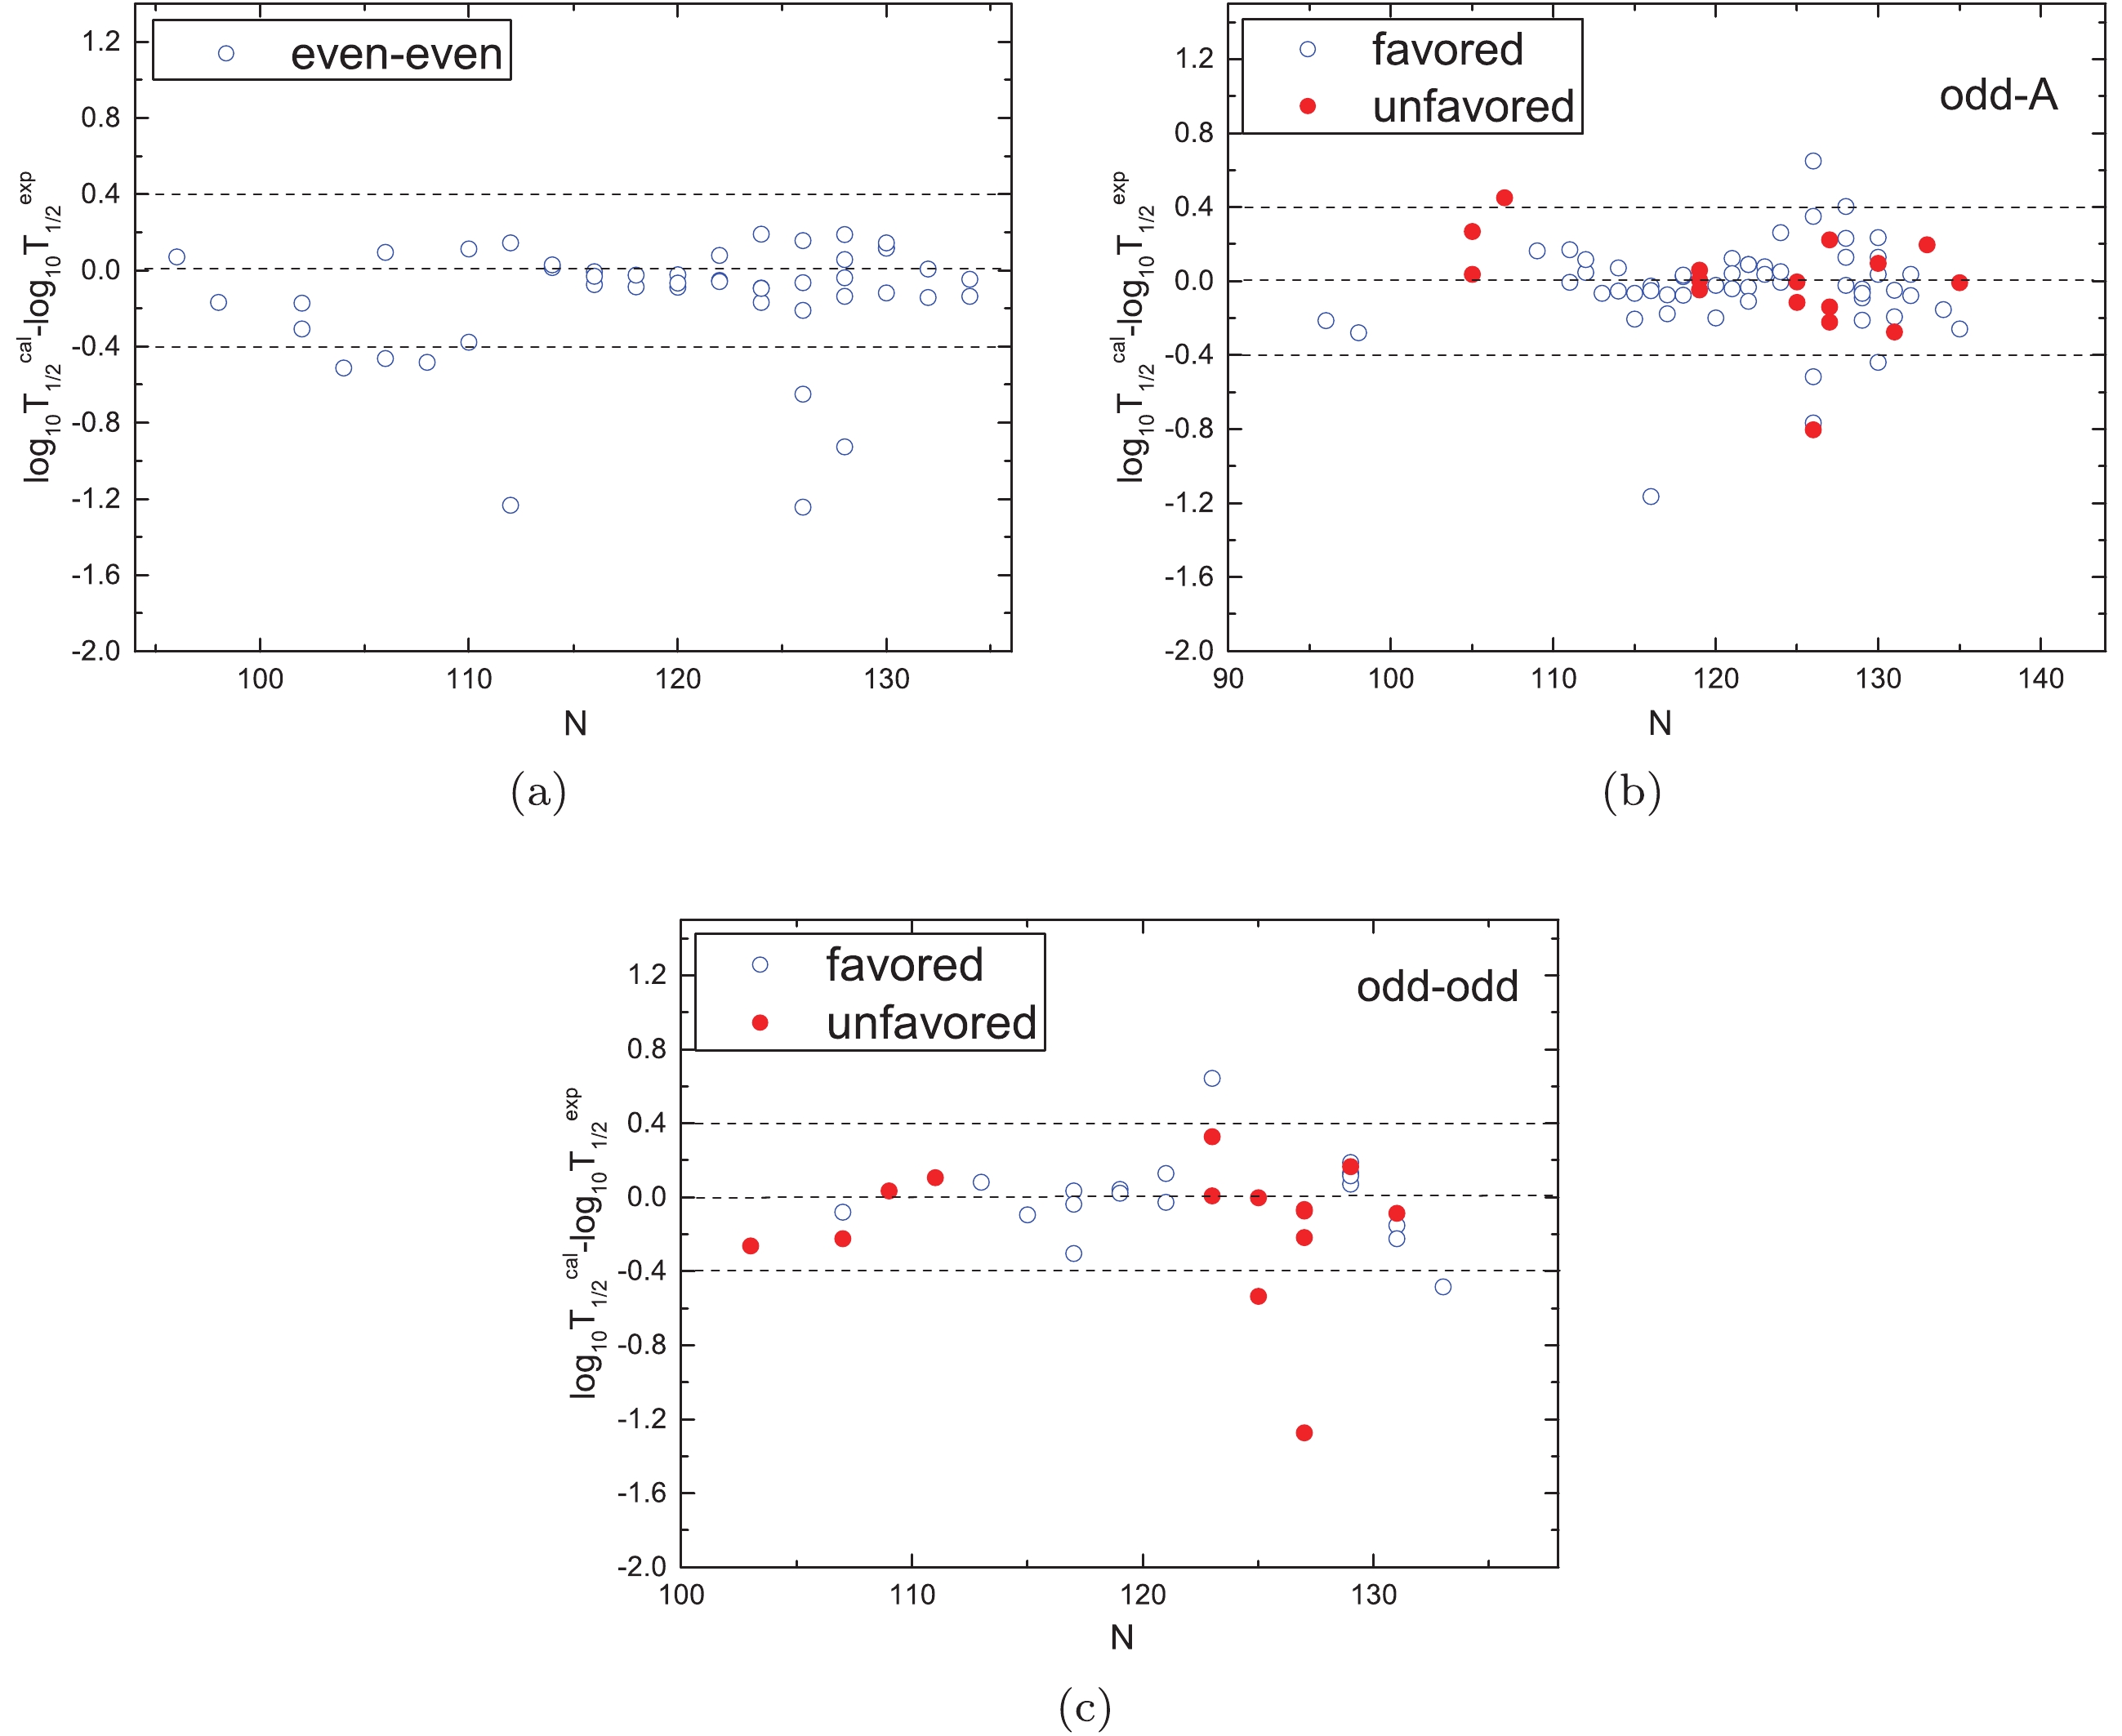
Figure 6. (color online) Deviations of the logarithmic form of the
$\alpha$ decay half-lives between the calculations using the GLDM with the fitting of$P_\alpha$ calculated by Eq. (16) and the experimental data as a function of the neutron number.nuclei favored decay unfavored decay $\sigma_1$ 

$\sigma_2$ 

$\sigma_1$ 

$\sigma_2$ 

even–even nuclei 0.947 0.350 − − ${\rm odd}-A$ nuclei

0.978 0.262 1.90 0.272 doubly odd nuclei 1.145 0.227 2.494 0.400 Table 7. Standard deviation
$\sigma$ between the calculated$\alpha$ decay half-lives and the experimental ones. -
In summary, using the GLDM, we systematically study the
$\alpha$ decay half-lives and the preformation factors of 152 nuclei around Z = 82, N = 126 closed shells. It is found that the preformation factors are linearly related to$N_pN_n$ and the calculated half-lives can reproduce the experimental data well. Meanwhile, the linear relationship between$N_pN_n$ and the preformation factors calculated by two different formulas by defining the concept of the microscopic valence nucleon (hole) number still exists. Combining with the study of Seif${et\ al.}$ and our previous studies, we consider that the linear relationship between$P_{\alpha}$ and$N_pN_n$ around the Z = 82, N = 126 shell closures is model-independent and that the valance proton–neutron interaction may be important to the$\alpha$ particle preformation.We would like to thank X. -D. Sun, J. -G. Deng, J. -H. Cheng, and J. -L. Chen for useful discussion.
Systematic study of the α decay preformation factors of the nuclei around the Z = 82, N = 126 shell closures within the generalized liquid drop model
- Received Date: 2020-02-08
- Available Online: 2020-09-01
Abstract: In this study, we systematically investigate the


 Abstract
 HTML
HTML Reference
 Related
 PDF
PDF




 DownLoad: