-
Neutron-induced reaction cross sections may help understand the mechanisms of nuclear reactions and, in general, nucleon-nuclear interactions. In particular, cross-section data for incident neutron energies around 14 MeV have a critical importance in the domain of fusion reactor technology, radiation damage of metals and alloys, and nuclear heating [1]. Among different alloys, austenitic stainless steel is used in fusion reactors and various industries because they have outstanding mechanical formability with good strength at high temperatures, as well as oxidation and corrosion resistance. However, when these alloys are used in a neutron irradiation environment, their serviceable lifetime is greatly compromised owing to the degradation of their properties. The addition of a small number of elements, including rare earth elements, has a remarkable impact on the performance of austenitic stainless steel. The addition of lutetium (which has the highest atomic number of all rare earth elements) may be important for improving the properties of stainless steel used as a potential first wall material for fusion reactors [2, 3]. When a lutetium-containing material (potentially used as a first wall material for fusion reactors) is exposed to a 14 MeV neutron field, hydrogen and helium are produced in the material (thereby reducing their performance) owing to 175Lu(n, p)175Yb, 175Lu(n,α)172Tm, 176Lu(n,α)173Tm reactions, causing an increase in the number of neutrons due to the 175Lu(n,2n)174mLu and 175Lu(n,2n)174gLu reactions. Therefore, obtaining accurate and reliable cross sections for incident neutron energies around 14 MeV on lutetium isotopes is important for material selection and design of such reactors. Some research groups have determined neutron-induced reaction cross sections for lutetium isotopes [1, 2, 4−16]. Unfortunately, there are large discrepancies between existing experimental cross-section data on lutetium isotopes. For the 175Lu(n,p)175Yb reaction, six research groups have obtained cross section data induced by neutrons from the T(d,n)4He reaction (D-T neutrons) [1, 2, 4−7]. There are extremely large differences in those data at the same or close neutron energy points (e.g., at approximately 14.6 MeV, there exist experimental cross-section data with a maximum difference given by a factor greater than 4). For the 175Lu(n,α)172Tm reaction, only four research groups have obtained induced reaction cross section data of D-T neutrons [1, 2, 4, 8]. There are remarkable differences in those data at the same or close neutron energy points (e.g., at approximately 14.7 MeV, the maximum cross-section value is 1.3 times that of the minimum cross-section value). For the 176Lu(n,α)173Tm reaction, only four research groups have obtained induced reaction cross section data of D-T neutrons [1, 4, 6, 8]. There are notable differences in those data at the same or close neutron energy points (e.g., at approximately 14.6 MeV, the maximum cross-section value is more than two times that of the minimum cross-section value). For the175Lu(n,2n) 174mLu and 175Lu(n,2n)174gLu reactions, induced reaction cross section data of D-T neutrons have been obtained by nine [1, 2, 9−15] and eight [2, 9−14, 16] research groups, respectively. These experimental data are also notably different, e.g., at approximately 14.7 MeV, the maximum cross-section values are more than 8 times and 1.7 times those of the minimum cross-section values, respectively. Since 2007, the experimental cross-section data obtained by only a few research groups (four and three groups for the 175Lu(n,2n)174mLu and 175Lu(n, 2n)174gLu reactions, respectively) are also different, e.g., at approximately 14.1 MeV, the maximum cross-section values of the175Lu(n,2n)174mLu and 175Lu(n,2n)174gLu reactions are more than 1.5 times and 1.2 times those of the minimum cross-section values, respectively. Possible reasons for the large discrepancies in these experimental cross section data are as follows: different measurement methods and experimental conditions (such as neutron field characteristics, radiation detector, and neutron monitoring method), different target-isotope abundances and associated decay parameters of the products, and different monitor reactions and corresponding standard cross-section data.
In addition, for the175Lu(n,2n) 174mLu and 175Lu(n,2n) 174gLu reactions, there are no cross section data in the five major evaluated nuclear data libraries of IAEA [17], namely, ENDF/B-VIII.0 (USA, 2018) [18], JEFF-3.3 (Europe, 2017) [19], JENDL-5 (Japan, 2021) [20], CENDL-3.2 (China, 2020) [21], and BROND-3.1 (Russia, 2016) [22]. For the 175Lu(n,p)175Yb, 175Lu(n,α)172Tm and 176Lu(n,α)173Tm reactions, there are large discrepancies in the evaluated cross section data in four of the five major nuclear data libraries of IAEA (i. e., ENDF/B-VIII.0, JEFF-3.3, JENDL-5, and BROND-3.1). There are no evaluated cross section data for the three reactions in the CENDL-3.2 library. For the 175Lu(n,p)175Yb reaction, the evaluated cross section data of ENDF/B-VIII.0 and BROND-3.1 are the same, but there exist extremely large differences between the other evaluated data (for example, at 14.1 MeV neutron energy, the evaluated data in the four libraries are 3.43, 8.92, 7.25, and 3.43 mb, respectively). For the 175Lu(n,α)172Tm reaction, the evaluated cross section data are all notably different (for example, at 14.1 MeV neutron energy, the evaluated cross section data in the four libraries are 1.07, 1.80, 7.25, and 3.43 mb, respectively). For the 176Lu(n,α)173Tm reaction, there exist also large differences in these evaluated cross section data, except for the data in ENDF/B-VIII.0 and BROND-3.1, which are the same (for example, at 14.1 MeV neutron energy, the evaluated cross section data in the four libraries are 1.07, 1.74, 0.90, and 1.07 mb, respectively). Therefore, it is necessary to perform further measurements for the cross-sections of the abovementioned five reactions on lutetium isotopes at incident neutron energies around 14 MeV to improve the database, resolve discrepancies, and provide curves of excitation functions using the nuclear theoretical model program Talys-1.95.
In the present study, the cross-sections of the 175Lu(n,p)175Yb, 175Lu(n,α)172Tm, 176Lu(n,α)173Tm, 175Lu(n, 2n)174mLu, and 175Lu(n,2n)174gLu reactions were measured in the neutron energy range of 13.57−14.86 MeV using the activation technique and high-resolution off-line gamma-ray spectrometry relative to the reference cross-section data of the 93Nb(n,2n)92mNb reaction. The excitation function curves of the five nuclear reactions mentioned above were calculated up to an incident neutron energy of 20 MeV using the Talys-1.95 code with the relevant parameters properly adjusted [23]. The experimental data obtained were analyzed and compared with previous experimental cross-section data reported by other research groups, data available in the evaluated nuclear data libraries of IAEA, and theoretical data based on Talys-1.95.
-
The studied cross sections were measured by using an activation technique and identifying the radioactive products of neutron-induced nuclear reactions. This method is suitable for investigating low-yield (n,p) and (n,α) reactions and is almost ideal for studying closely spaced low-lying isomeric states, provided that their lifetimes are not too short [24]. The details have been described in several publications [24−26]. Here, only some of the salient features relevant to the present measurements are considered.
-
Disc-shaped natural pure lutetium (with two stable isotopes: 175Lu, 97.401%; 176Lu, 2.599%) plates (99.9% pure, 3 mm thick, 20 mm diameter) and disc-shaped natural pure zirconium plates (99.99% pure, 3 mm thick, 20 mm diameter) were used. Monitor plates (natural niobium plates, each 0.6 mm thick, 99.95% pure) of the same size as the lutetium sample were then attached at the front and back of each lutetium sample. The niobium plates and lutetium samples were procured from ZhongNuo Advanced Material (Beijing) Technology Corporation Ltd. The natural pure zirconium plates were procured from China New Metal Materials Technology Corporation Ltd.
Irradiations were done at the K-400 Neutron Generator of the China Academy of Engineering Physics and lasted 6 h and 10 min. The yield of the quasi-monoenergetic neutrons from the T(d,n)4He reaction was approximately 5×10¹⁰ n.s–1. The deuteron beam energy was 255 keV, beam current was 250−320 μA, and thickness of the T–Ti target in the neutron generator used was approximately 2.19 mg.cm–2 [26]. During the sample irradiation, the neutron flux was monitored by measuring the accompanying α-particles with an Au–Si surface barrier detector to correct small variations of the neutron flux. The groups of samples were placed at different angles of approximately 0°, 45°, 90°, and 135° relative to the deuteron beam direction. The neutron energies were different at different angles. The distances of the samples from the center of the T-Ti target were approximately 40−50 mm.
-
The neutron energy from the T(d,n)4He reaction was approximately 14 MeV. The outgoing neutron energies can be calculated by the following formula, which can be deduced from the Q-equation of the nuclear reaction for the T(d,n)4He reaction:
$ {E_n} = {\left[ {\frac{{\sqrt {2{E_d}} \cos \theta }}{5} + \sqrt {\left(\frac{2}{5} + \frac{2}{{25}}{{\cos }^2}\theta \right){E_d} + \frac{4}{5}Q} } \right]^2}, $

(1) where En denotes the neutron energy (in MeV) at outgoing angle θ relative to the deuteron beam direction, Ed denotes the incident deuteron energy (in MeV), and Q denotes the reaction energy of the T(d,n)4He reaction, which is equal to 17.59 MeV. It can be concluded from the calculation results from Eq. (1) that when incident deuteron energy Ed or/and outgoing angle θ are different, outgoing neutron energy En is different; when incident deuteron energy Ed is low, outgoing neutron energy En from the T(d,n)4He reaction changes very slowly with outgoing angle θ. At an outgoing angle of θ = 100°, the outgoing neutron energy was approximately14 MeV, regardless of the deuteron energy.
The outgoing neutron energy calculated from Eq. (1) is only a theoretical value, listed in Table 1. In a real experiment, given that the neutron energy generated by the T(d,n)4He reaction is related to various factors (such as distribution of tritium in a tritium target, diameter of the deuterium beam incident on a tritium target, and history of the tritium target used), an accurate value of the average outgoing neutron energy cannot be calculated from Eq. (1); it must be measured experimentally. At present, the method of the reaction cross section ratio of 90Zr(n,2n)89g+mZr to 93Nb(n,2n)92mNb or 58Ni(n,p)58g+mCo to 58Ni(n,2n)57Ni is commonly used worldwide to measure the average neutron energy [27−32]. However, the method of the reaction cross section ratio of 90Zr(n,2n)89g+mZr to 93Nb(n,2n)92mNb is more effective than that of 58Ni(n,p)58g+mCo to 58Ni(n,2n)57Ni around a neutron energy of 14 MeV [30, 31].
Outgoing neutron
anglesZr-Nb cross
section ratiosOutgoing neutron energies/MeV Measured data Theoretical data 0° 1.7946 14.86±0.23 15.29 45° 1.6768 14.62±0.22 14.95 90° 1.3245 14.03±0.28 14.17 135° 1.0002 13.57±0.27 13.43 Table 1. Zr-Nb cross section ratios and outgoing neutron energies.
In the present study, the neutron energies at the irradiation positions of the samples were determined via the method of the reaction cross section ratio of 90Zr(n, 2n)89g+mZr to 93Nb(n,2n)92mNb. The evaluated cross section values of the 90Zr(n,2n)89g+mZr and 93Nb(n,2n)92mNb reactions from Ref. [33] were used to fit the curve of the neutron energy and zirconium-niobium cross section ratio. The relation between the neutron energy and zirconium-niobium cross section ratio is as follows:
$ E_{n} = b_{4}x^{4}+b_{3}x^{3}+b_{2}x^{2}+b_{1}x+b_{0 }, $

(2) where En denotes the neutron energy (in MeV); x denotes the zirconium-niobium cross section ratio; and b4, b3, b2, b1, and b0 denote the constants with the following values: b4 = 0.05787, b3 = –0.08916, b2 = 0.14638, b1 = 1.05962, b0 = 12.39727.
The measured zirconium-niobium cross section ratios and corresponding neutron energies at the irradiation positions of the samples are presented in Table 1. The uncertainties of the neutron energies at the irradiation positions were estimated to be 1.5%−2% according to the sample size, diameter of the beam, and zirconium-niobium cross section ratio.
-
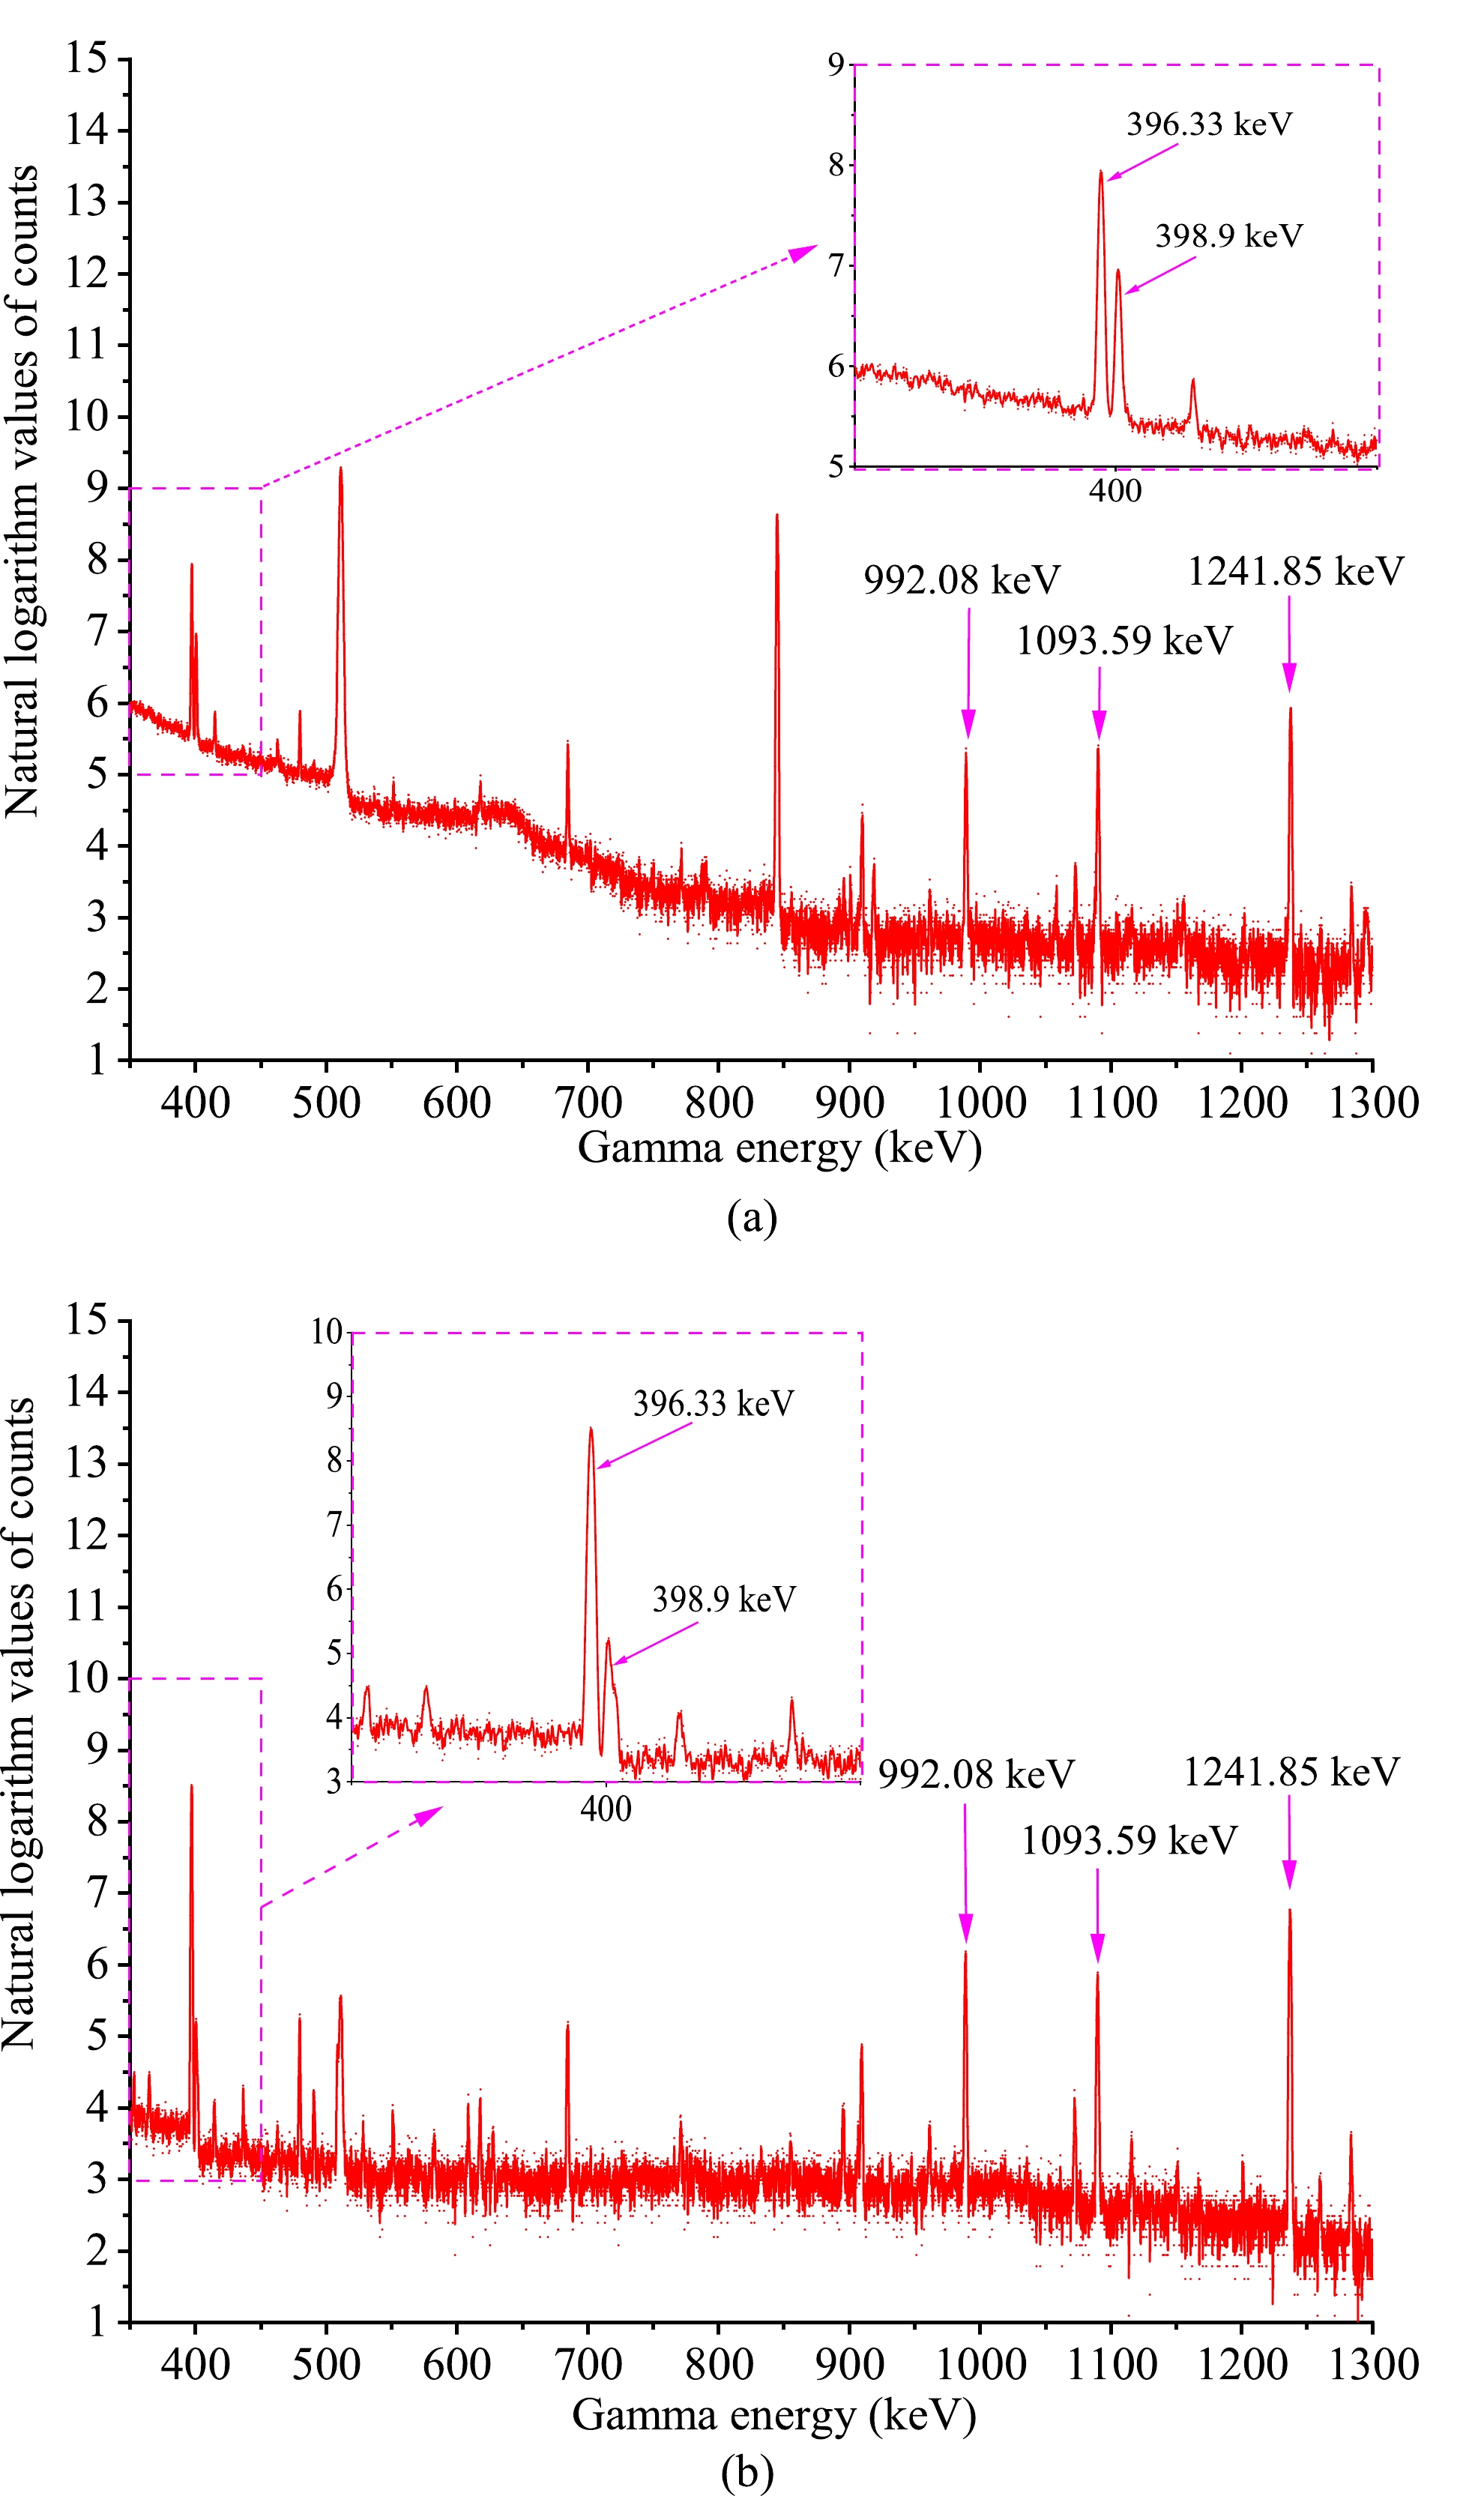
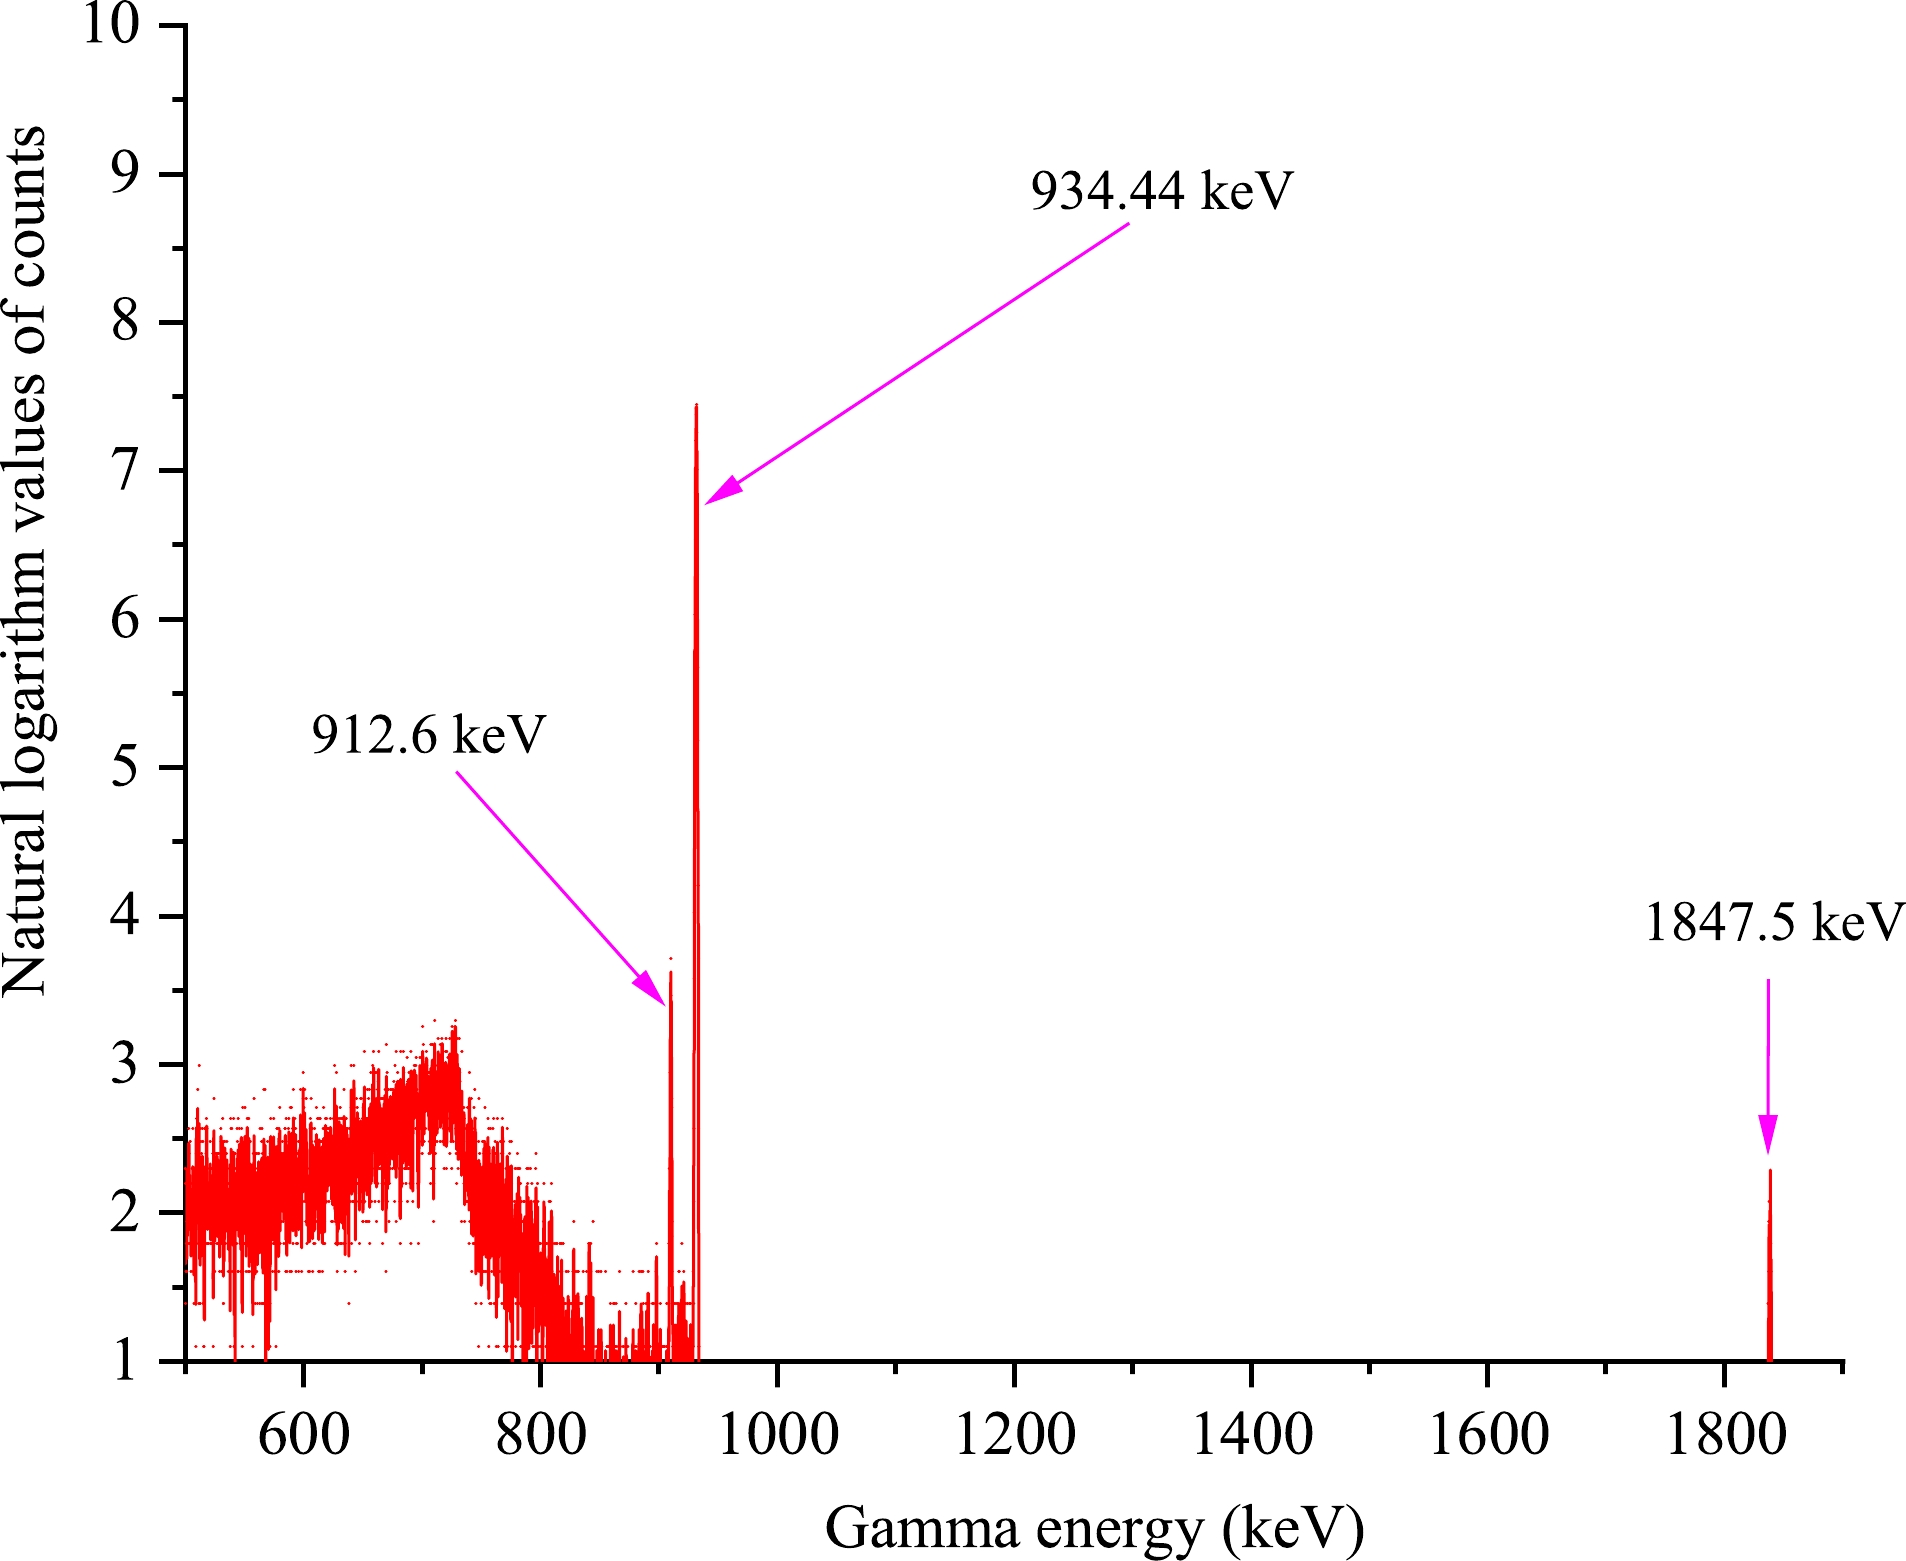
The activation products of the neutron-induced reactions were identified by γ-ray count, and the half-lives of the radioactive products were verified. The γ-ray activities of 92mNb from the irradiated monitor plates and those of 175Yb, 172Tm, 173Tm, 174mLu, and 174gLu from the irradiated lutetium samples were measured by a HPGe detector (ORTEC GEM-60P, made in USA and featuring 70.1 mm crystal diameter and 72.3 mm crystal length), with a relative efficiency of 68% and an energy resolution of 1.69 keV at 1332 keV for 60Co. The lutetium samples placed at angles of 0° and 90° were measured twice, and the remaining two samples were measured once each. Figures 1(a) and (b) show a part of the γ-ray spectrum obtained from the lutetium sample placed at an angle of 0° with cooling durations of 62 and 1809 min, and measurement durations of 155.55 and 367.37 min, respectively. Figure 2 shows a part of the γ-ray spectrum obtained from the niobium plates placed at an angle of 0° with a cooling duration of 1651 min and measurement duration of 1.95 min. The efficiency of the used GEM-60P coaxial HPGe detector was calibrated in advance using the standard sources, with γ-ray energies of 241Am (59.54 keV), 57Co (122.06 and 136.47 keV), 60Co (1173.23 and 1332.49 keV), 109Cd (88.03 keV), 133Ba (81.00, 276.40, 302.85, 356.01, and 383.85 keV), 137Cs (661.66 keV), 152Eu (121.78, 244.70, 344.28, 411.12, 443.96, 778.90, 867.38, 964.06, 1085.84, 1112.08, 1299.14, and 1408.01 keV), and 226Ra (186.21, 242.00, 295.22, 351.93, 609.32, 768.36, 1120.29, 1238.12, 1377.67, 1509.21, 1729.60, 1764.49, 1847.43, and 2204.06 keV). An absolute efficiency calibration curve was obtained at 9 cm distance from the surface of the outermost envelope of the detector, which was the real count position used to measure the γ-ray activities of the reaction products for the lutetium samples and niobium plates.
-
The associated decay data of the reaction products used for the quantitative assessment of the activity, and the natural abundance of the target isotopes used in the present study are listed in Table 2. Most of these data are derived from NuDat 3.0 [34], while the natural abundance of 93Nb is taken from Ref. [35].
Reaction Abundance of target isotope (%) Product Half-life Eγ /keV Iγ (%) 175Lu(n,p) 97.401±0.013 175Yb 4.185±0.001 d 396.33 13.2±0.3 175Lu(n,α) 97.401±0.013 172Tm 63.6±0.3 h 1093.59 6.0±0.6 176Lu(n,α) 2.599±0.013 173Tm 8.24±0.08 h 398.9 87.9 175Lu(n,2n) 97.401±0.013 174mLu 142±2 d 992.08 0.546±0.021 175Lu(n,2n) 97.401±0.013 174gLu 3.31±0.05 Y 1241.85 5.14±0.13 93Nb(n,2n) 100 92mNb 10.15±0.02 d 934.44 99.15 Table 2. Nuclear reactions, abundances of the target isotopes, and associated decay data of the products.
The measured cross-section data of nuclear reactions on lutetium isotopes were deduced from the following formula [36, 37]:
$ {\sigma _{\rm Lu}} = \frac{{{{[S\varepsilon {I_\gamma }\eta KMD]}_{\rm Nb}}}}{{{{[S\varepsilon {I_\gamma }\eta KMD]}_{\rm Lu}}}}\frac{{{{[\lambda AFC]}_{\rm Lu}}}}{{{{[\lambda AFC]}_{\rm Nb}}}}{\sigma _{\rm Nb}}, $

(3) where the terms denoted by “Nb” are the relevant parameters of the monitor reaction 93Nb(n,2n)92mNb, the terms denoted by “Lu” are related to the measured reactions; ε is the full-energy peak (FEP) efficiency of the measured characteristic γ-ray, Iγ is the γ-ray intensity, η is the abundance of the target nuclide, M is the mass of sample,
$D = {{\rm e}^{ - \lambda {t_1}}} - {{\rm e}^{ - \lambda {t_2}}}$ is the count collection factor, t1 is the time interval from the end of the irradiation to the start of the measurement of the characteristic gamma-ray (cooling duration), t2 is the time interval from the end of the irradiation to the end of the measurement of the characteristic gamma-ray (cooling plus measurement durations), and K is the neutron fluctuation factor:$ K = {{\Big[\sum\limits_i^L {{\phi _i}} (1 - {{\rm e}^{ - \lambda \Delta {t_i}}}){{\rm e}^{-\lambda {T_i}}}\Big]} \Big/ {(\phi S}}), $

(4) where L denotes the time interval number into which the irradiation time is divided, Δti is the i-th time interval, Ti denotes the time interval from the end of the i-th interval to the end of the irradiation, ϕi denotes the neutron flux averaged over the sample during the i-th time interval, ϕ is the neutron flux averaged over the sample during the total irradiation time T,
$S = 1 - {{\rm e}^{ - \lambda T}}$ denotes the growth factor of the nuclear reaction product, A is the atomic weight, C denotes the FEP count of the measured characteristic γ-ray, λ is the decay constant of the product of the nuclear reaction, and F is the total correction factor of the activity of the measured characteristic γ-ray:$ F = {F_s} \times {F_c} \times {F_g} ,$

(5) where Fs, Fc, and Fg denote the correction factors for the self-absorption of the γ-ray, coincidence summing of the cascade γ-rays of the studied nuclide, and measurement geometry of lutetium samples and niobium plates, respectively. Fs and Fg were calculated using the following expressions [37]:
$ {F_s} = \frac{\mu_m d_m}{1 - {\rm e}^{-\mu_m d_m}}, $

(6) $ {F_g} = \frac{{{{(h + d/2)}^2}}}{{{h^2}}}, $

(7) where μm (in cm2/g) denotes the mass attenuation coefficient for a γ-ray energy, dm (in g/cm2) is the area density of the lutetium samples and niobium plates, d (in mm) denotes the thickness of the lutetium samples and niobium plates, and h (in mm) is the distance from the surface of the lutetium samples and niobium plates to the effective detection cross section of the crystal in the used HPGe detector. Fc was calculated using the correction equations reported in Ref. [38]. The correction equations of the coincidence summing of the cascade γ-rays concerning simple, more complex, and universal decay schemes were deduced based on basal concepts. Details were provided in Ref. [38].
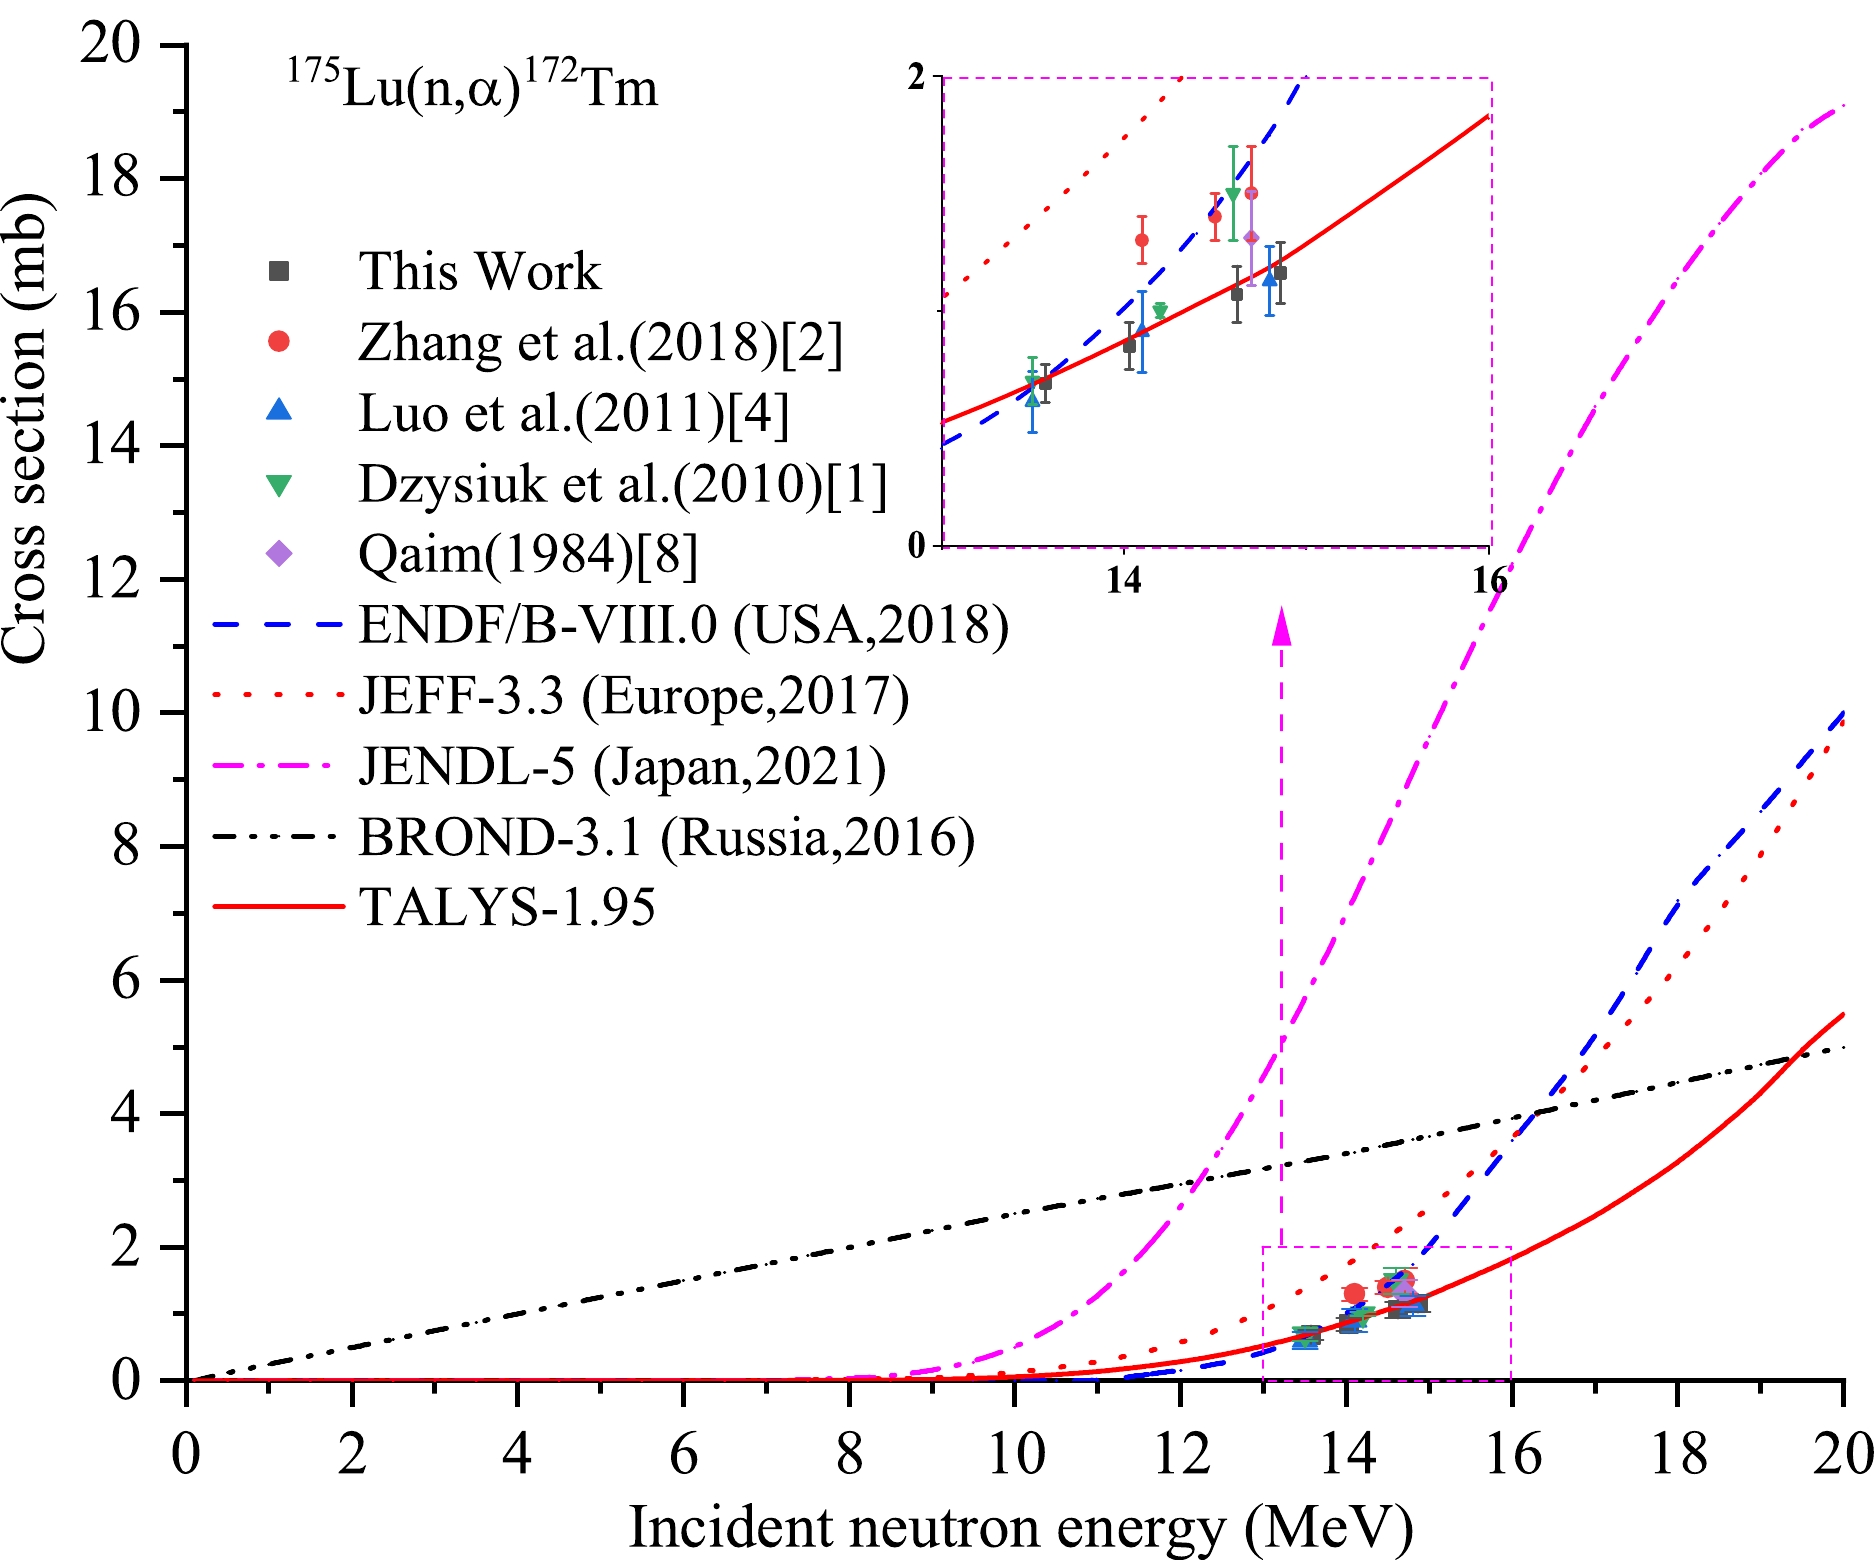
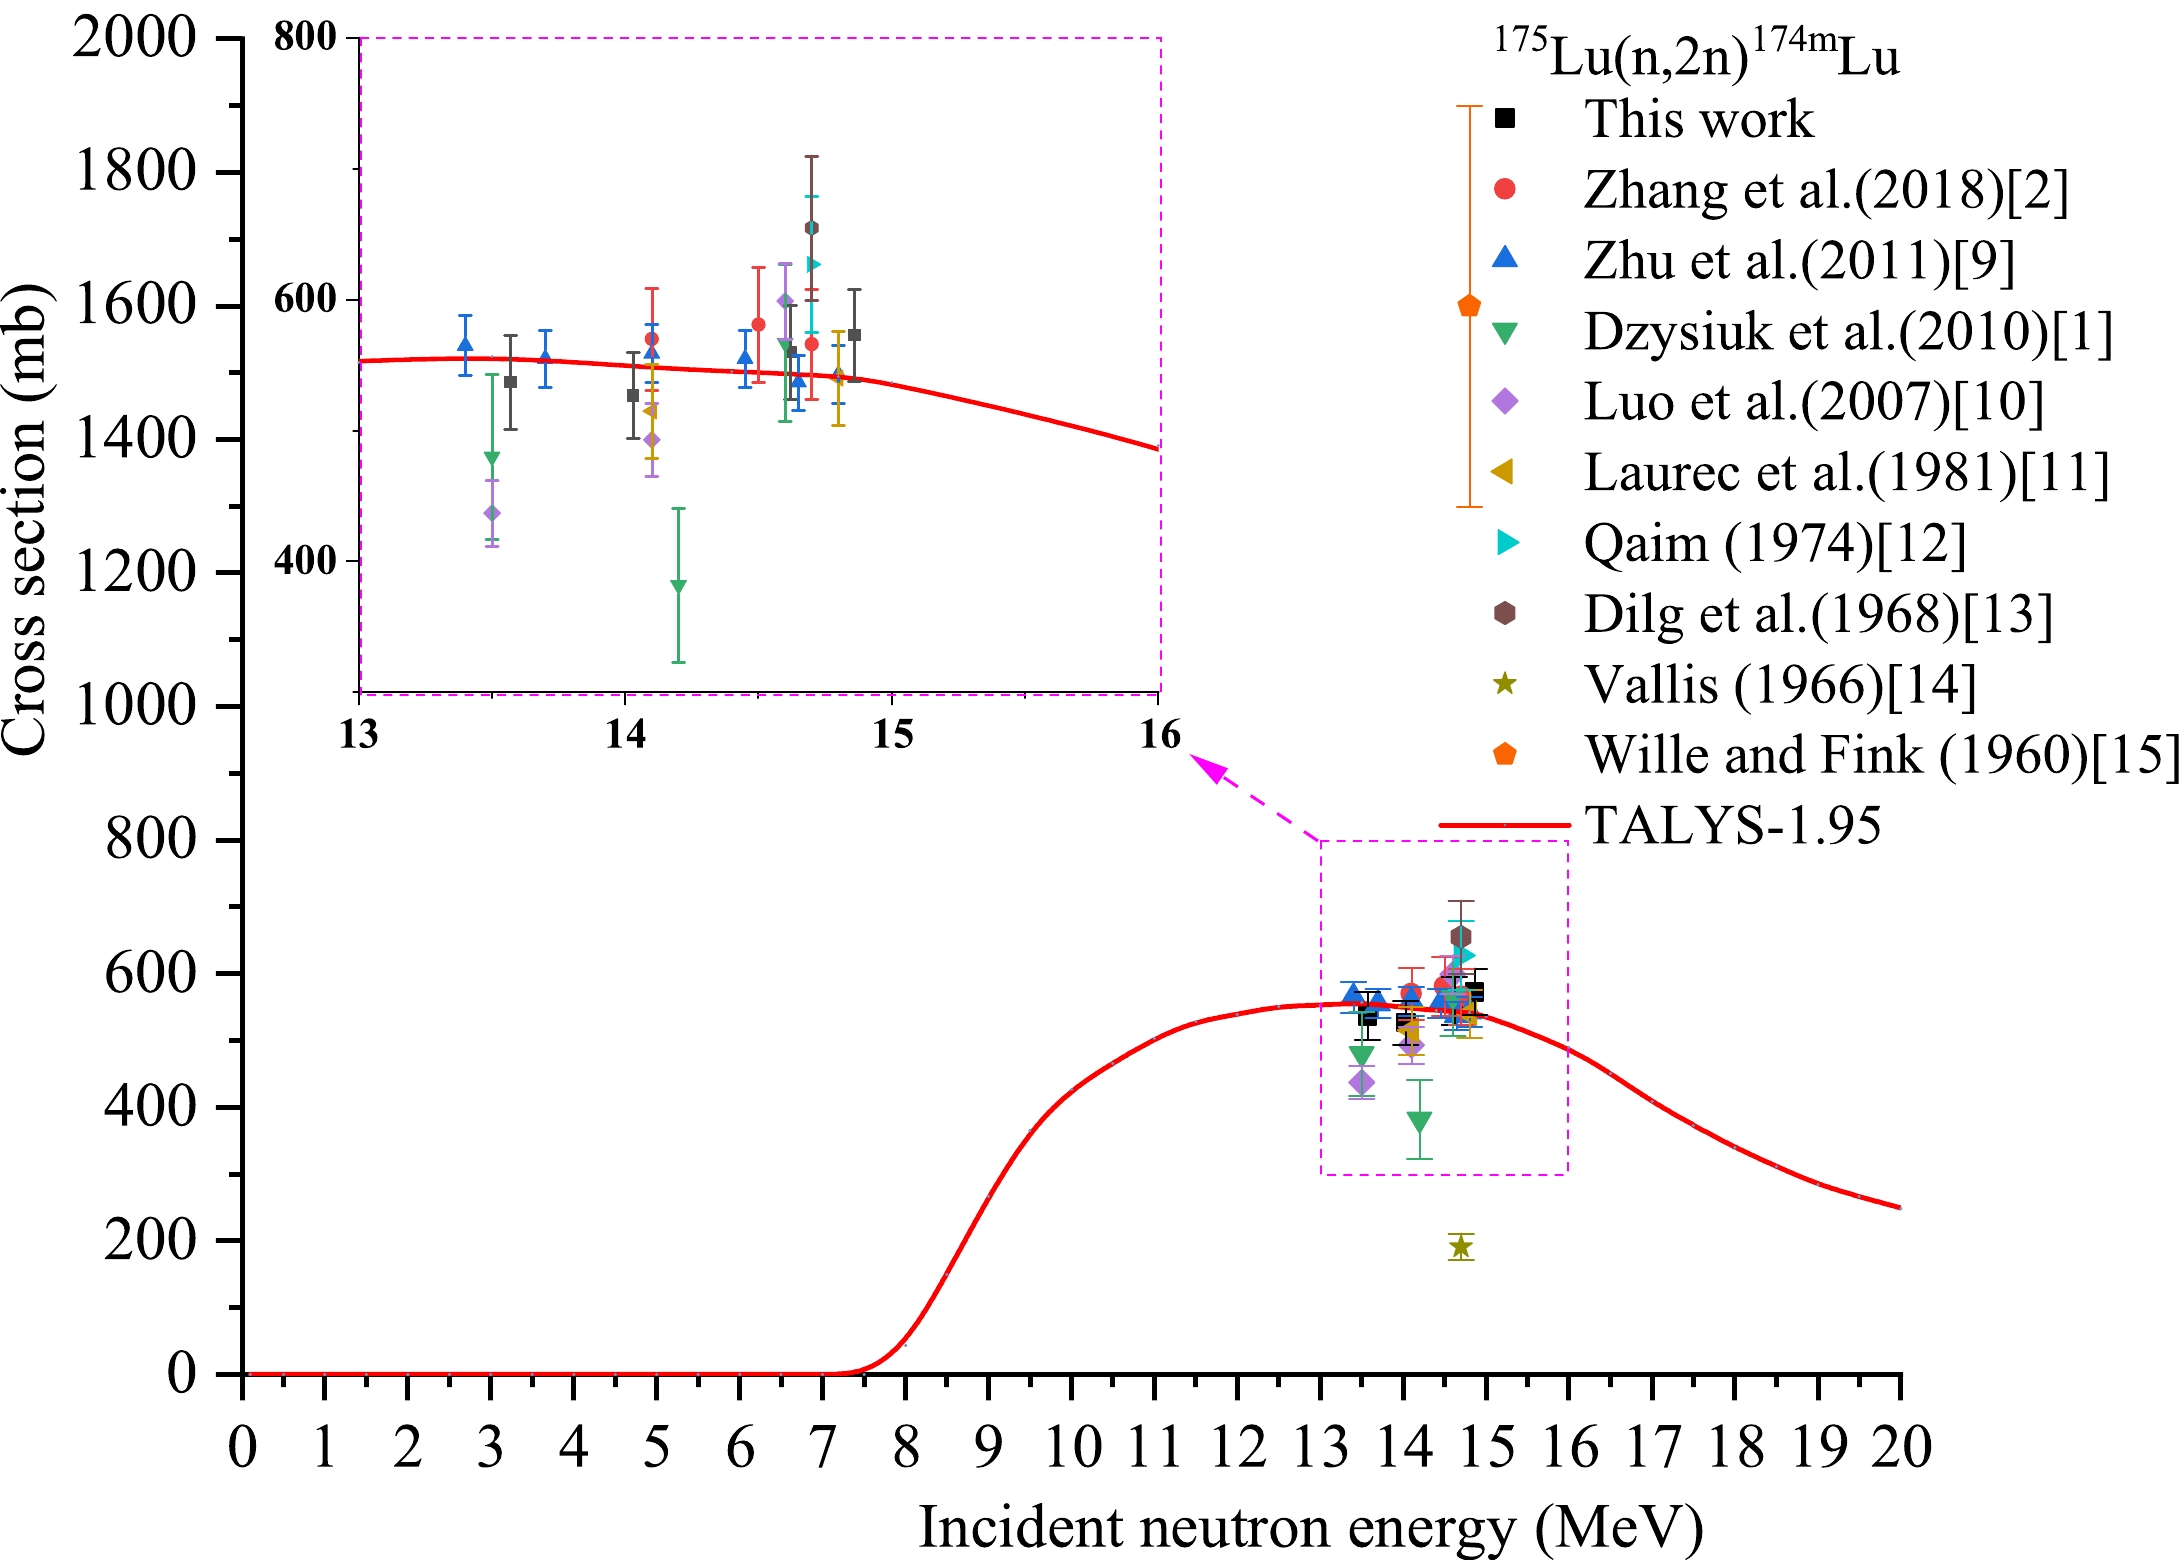
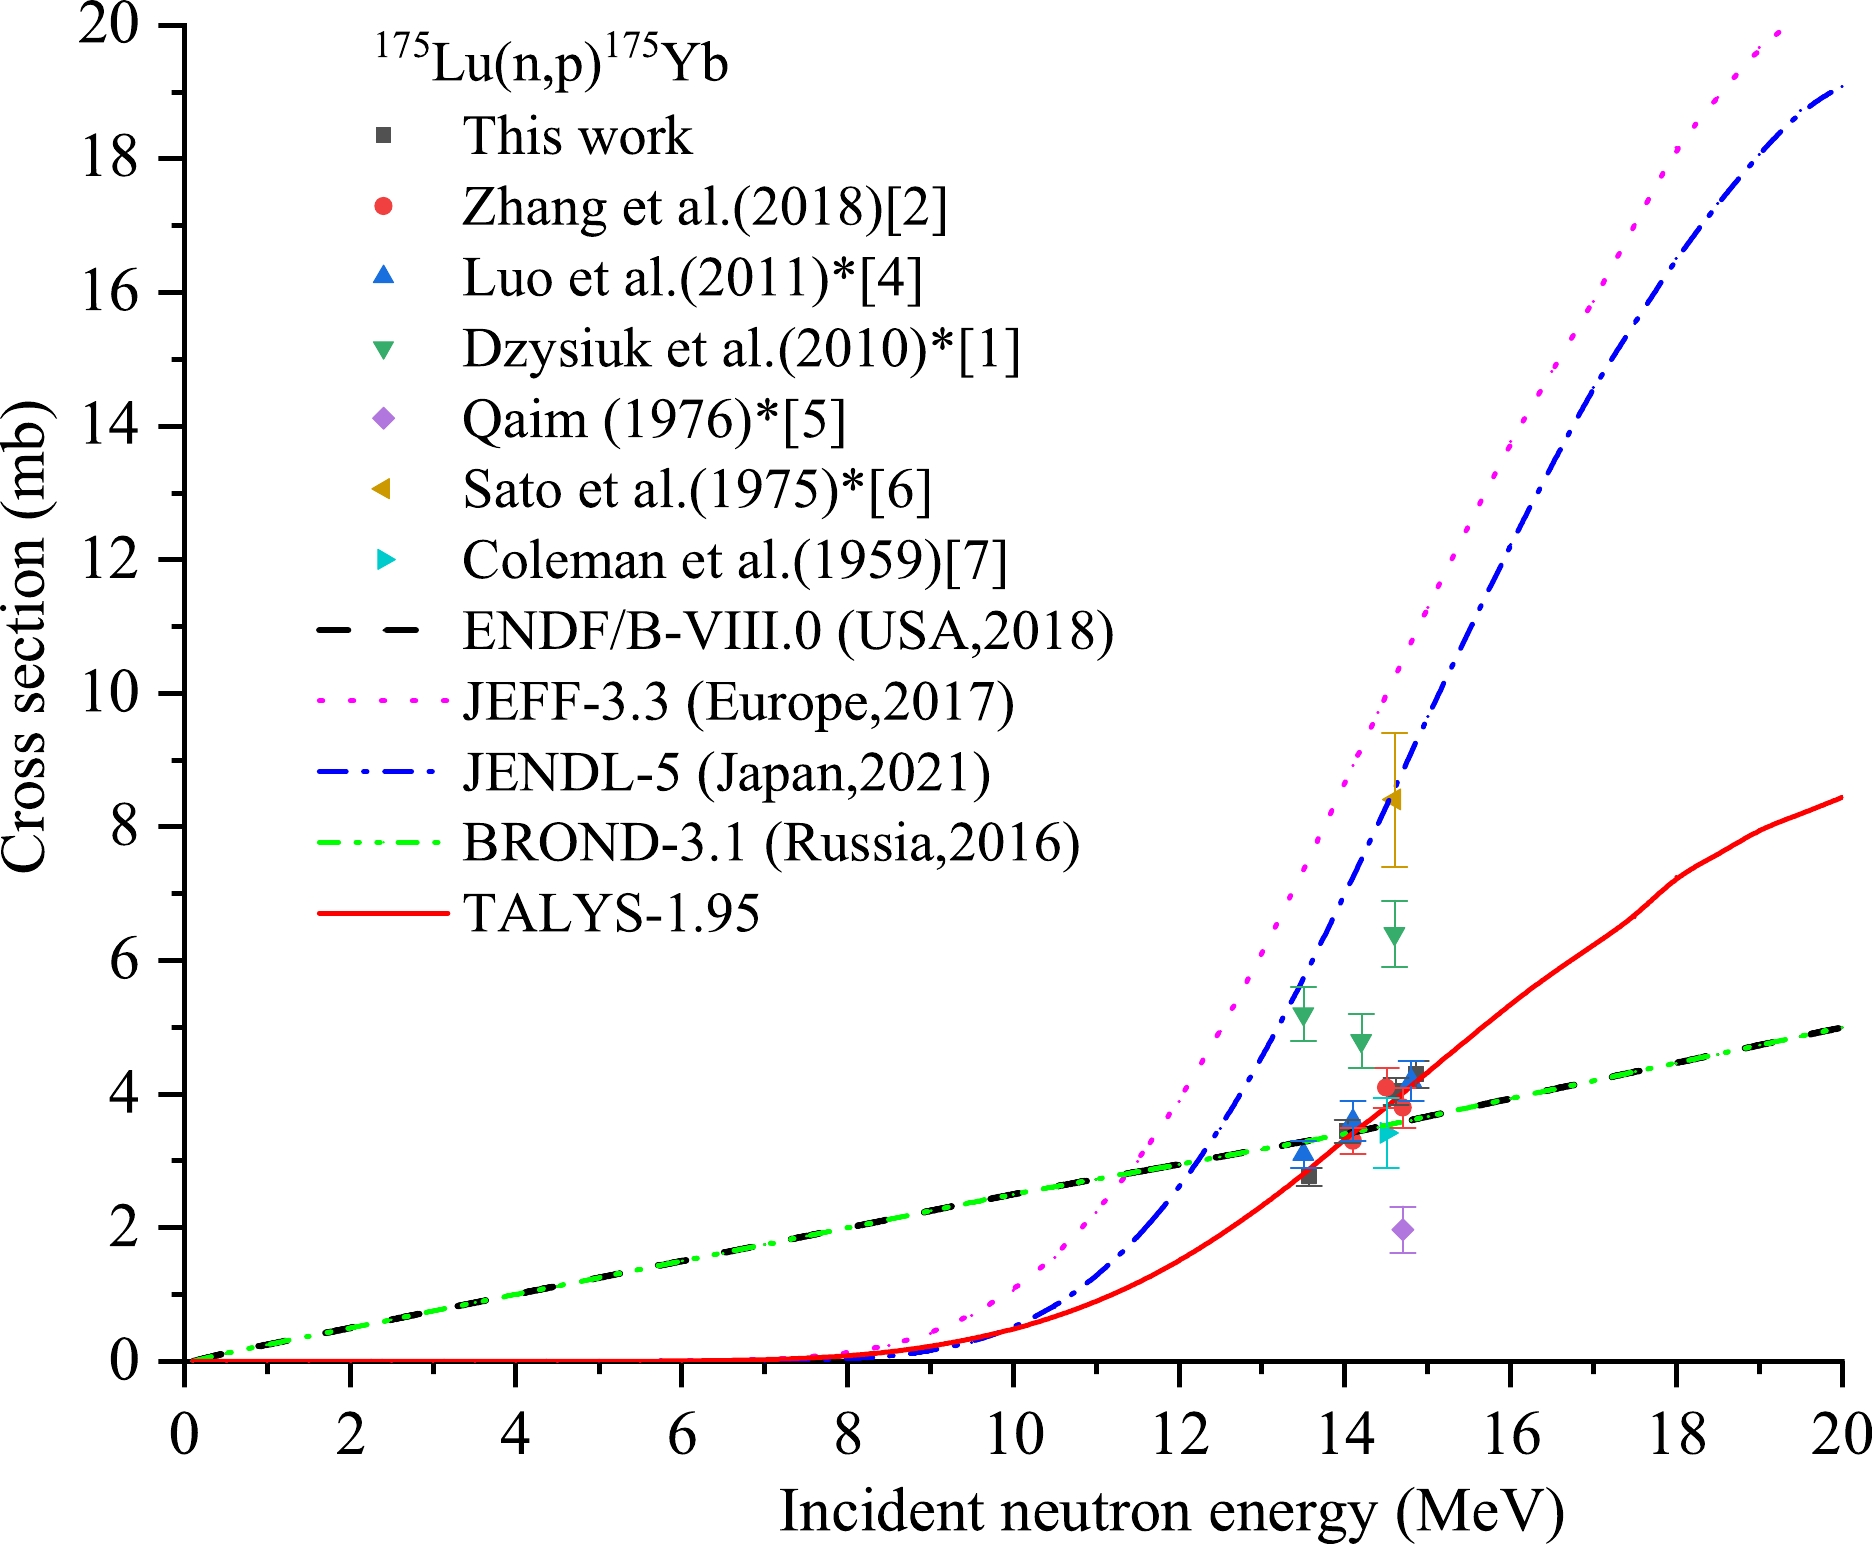
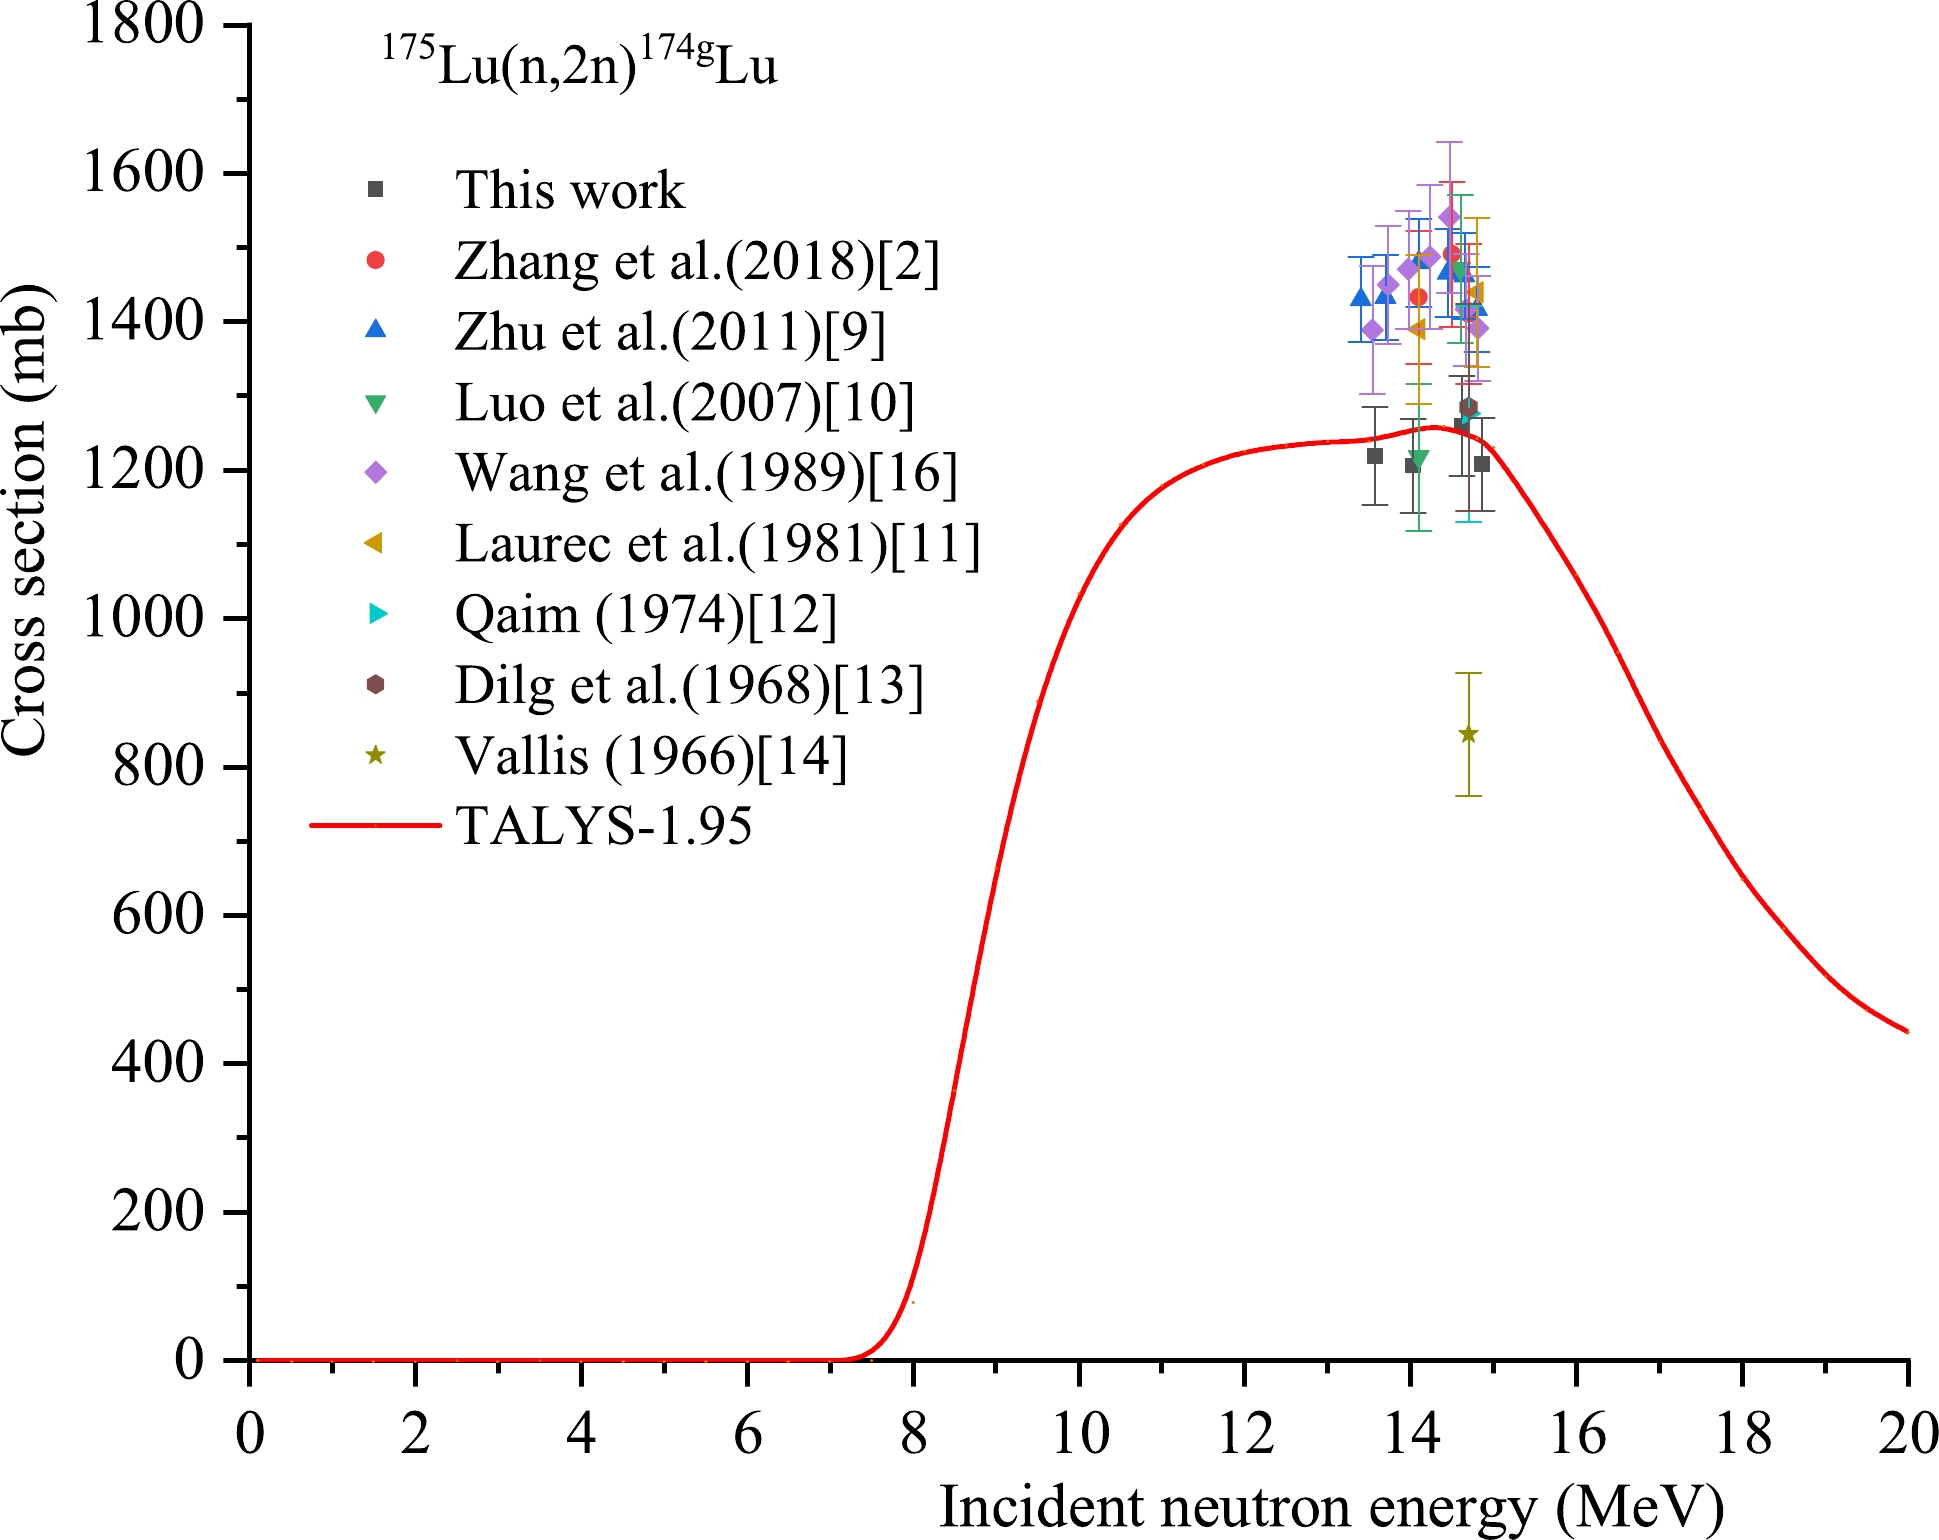
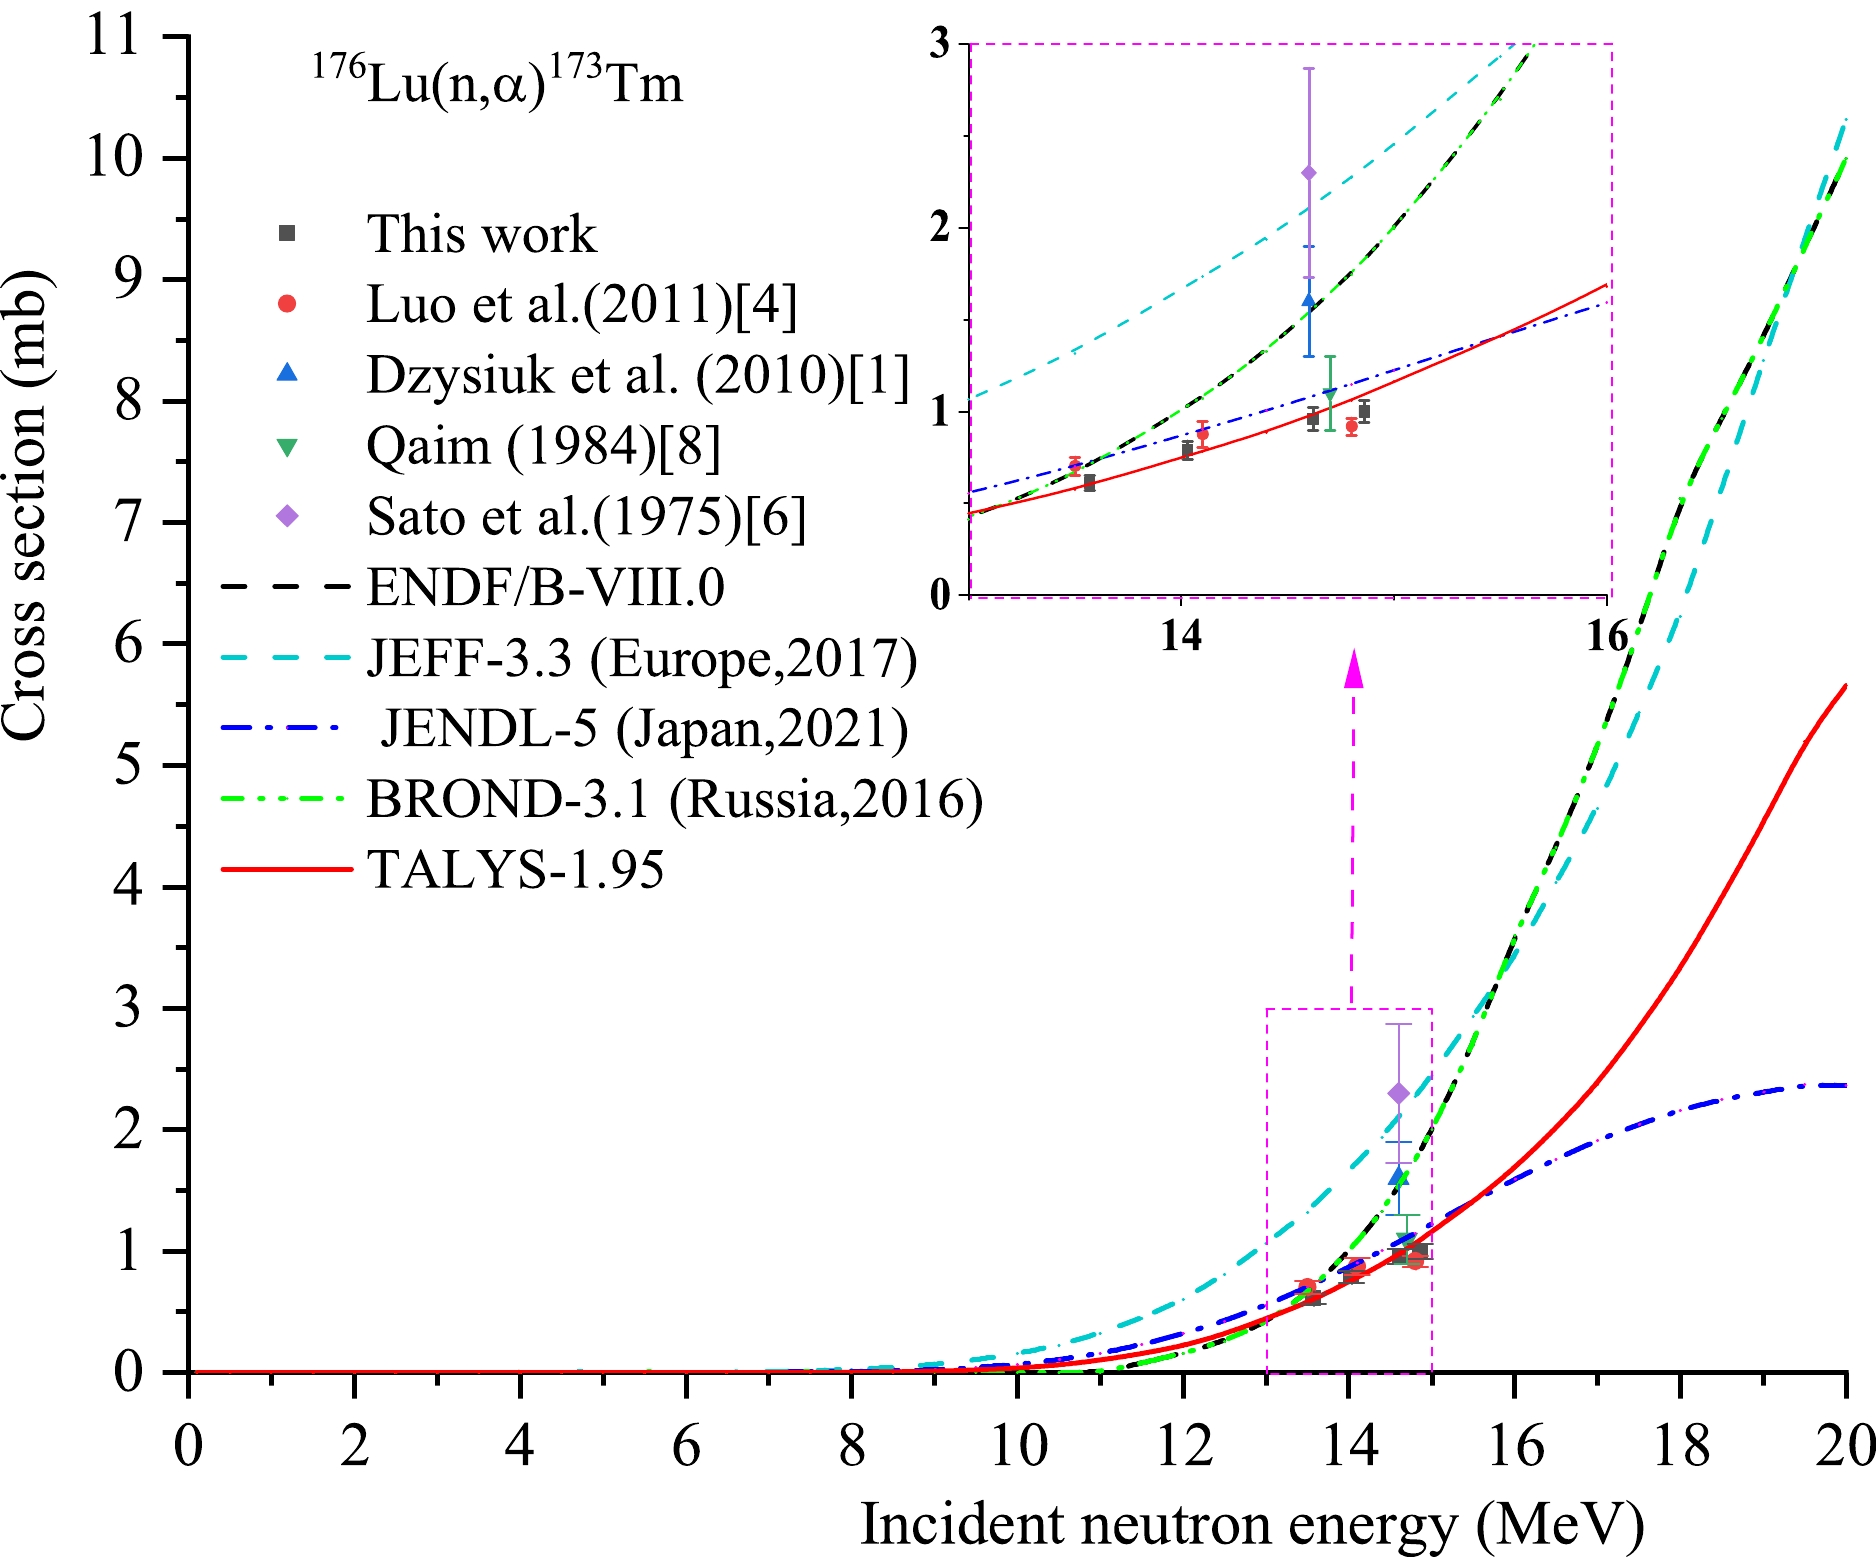
The cross section data of the 175Lu(n,p)175Yb, 175Lu(n,α)172Tm, 176Lu(n,α)173Tm, 175Lu(n,2n)174mLu, and 175Lu(n,2n)174gLu reactions are summarized in Tables 3−7 and charted in Figs. 3−7. The cross-section data of the monitor reaction 93Nb(n, 2n)92mNb were 457.9± 6.8, 459.8 ± 6.8, 459.7 ± 5.0, and 459.7 ± 5.0 mb at neutron energies of 13.57, 14.03, 14.62, and 14.86 MeV, respectively, according to Ref. [33]. The previous experimental cross-section data of these nuclear reactions induced by D-T neutrons are also summarized in Tables 3−7 and charted in Figs. 3−7 for comparison. In addition, regarding the 175Lu(n, p)175Yb, 175Lu(n,α)172Tm and 176Lu(n,α)173Tm reactions and the data of cross sections in the five major evaluated nuclear data libraries of IAEA, their evaluation curves of excitation functions in ENDF/B-VIII.0, JEFF-3.3, JENDL-5, and BROND-3.1 libraries (no evaluation curve of excitation function in CENDL-3.2 library) are charted in Figs. 3−5 for comparison. Note that an γ-ray intensity of 6.4% at 396.33 keV energy was used in Refs. [1,4]. Moreover, γ-ray intensities of 6.5% and 6% at 96.33 keV energy were used in Refs. [5] and [6], respectively. The values marked with superscript * in Table 3 are recalculated results using the latest γ-ray intensity of 13.2% at 396.33 keV energy from NuDat 3.0. The previous experimental cross-section data from Refs. [1, 4−6] charted in Fig. 3 are the values marked with superscript * in Table 3; these values are the recalculated results using the latest γ-ray intensity of 13.2% from NuDat 3.0.
Reaction This study References values En /MeV σ/mb En /MeV σ/mb Reference 175Lu(n,p)175Yb 13.57±0.27 2.76± 0.14 14.1 3.3±0.2 Zhang et al.(2018) [2] 14.03±0.28 3.44±0.17 14.5 4.1±0.3 Zhang et al. (2018) [2] 14.62±0.22 4.04 ±0.20 14.7 3.8±0.3 Zhang et al. (2018) [2] 14.86±0.23 4.30±0.20 13.5 6.4±0.4 3.1±0.2* Luo et al. (2011) [4] 14.1 7.4±0.6 3.6±0.3* Luo et al. (2011) [4] 14.8 8.2±0.5 4.2±0.3* Luo et al. (2011) [4] 13.5 10.7±0.7 5.2±0.4* Dzysiuk et al. (2010) [1] 14.2 9.8±0.7 4.8±0.4* Dzysiuk et al. (2010) [1] 14.6 13.2±0.9 6.4±0.5* Dzysiuk et al. (2010) [1] 14.7 4±0.7 1.97±0.35* Qaim (1976) [5] 14.6 18.5±2.2 8.41±1.00* Sato et al. (1975) [6] 14.5 3.42±0.52 Coleman et al. (1959) [7] Note: ①In the process of calculating the cross section of the 175Lu(n,p)175Yb reaction in this study, the contribution of the 176Lu[(n,d)+ (n,n+p)] 175Yb reaction with its evaluated values (which are 0.66, 1.31, 1.71, 2.39 mb at 13.5, 14.1, 14.4, and 14.8 MeV, respectively) from JEFF-3.3 was subtracted.②An γ-ray intensity of 6.4% at 396.33 keV energy was used in Refs. [1, 4], and γ-ray intensities of 6.5% and 6% at 396.33 keV energy were used in Ref. [5] and Ref. [6], respectively. The values marked with superscript * were recalculated using the latest γ-ray intensity of 13.2% at 396.33 keV energy from NuDat 3.0. Table 3. Summary of activation cross section of the 175Lu(n,p)175Yb reaction.
Reaction This study References values En/MeV σ/mb En/MeV σ/mb Reference 175Lu(n,α)172Tm 13.57±0.27 0.69± 0.08 14.1 1.3±0.1 Zhang et al. (2018) [2] 14.03±0.28 0.85±0.10 14.5 1.4±0.1 Zhang et al. (2018) [2] 14.62±0.22 1.07 ±0.12 14.7 1.5±0.2 Zhang et al. (2018) [2] 14.86±0.23 1.16±0.13 13.5 0.612±0.129 Luo et al. (2011) [4] 14.1 0.910±0.173 Luo et al. (2011) [4] 14.8 1.126±0.146 Luo et al. (2011) [4] 13.5 0.7±0.1 Dzysiuk et al. (2010) [1] 14.2 1.0±0.03 Dzysiuk et al. (2010) [1] 14.6 1.5±0.2 Dzysiuk et al. (2010) [1] 14.7 1.31±0.2 Qaim. (1984) [8] Table 4. Summary of activation cross section of the 175Lu(n,α) 172Tm reaction.
Reaction This study References values En/MeV σ/mb En/MeV σ/mb Reference 176Lu(n,α) 173Tm 13.57±0.27 0.61± 0.04 13.5 0.704±0.049 Luo et al. (2011) [4] 14.03±0.28 0.79±0.05 14.1 0.876±0.070 Luo et al. (2011) [4] 14.62±0.22 0.96 ±0.06 14.8 0.919±0.046 Luo et al. (2011) [4] 14.86±0.23 1.00±0.06 14.6 1.6±0.3 Dzysiuk et al. (2010) [1] 14.7 1.1±0.2 Qaim (1984) [8] 14.6 2.3±0.57 Sato et al. (1975) [6] Table 5. Summary of activation cross section of the 176Lu(n,α) 173Tm reaction.
Reaction This study References values En/MeV σ/mb En/MeV σ/mb Reference 175Lu(n,2n)174mLu 13.57±0.27 537± 36 14.1 570±39 Zhang et al. (2018) [2] 14.03±0.28 527±33 14.5 581±44 Zhang et al. (2018) [2] 14.62±0.22 560 ±36 14.7 566±42 Zhang et al. (2018) [2] 14.86±0.23 573±35 13.40 565±23 Zhu et al. (2011) [9] 13.70 555±22 Zhu et al. (2011) [9] 14.10 559±22 Zhu et al. (2011) [9] 14.45 555±22 Zhu et al. (2011) [9] 14.65 537±21 Zhu et al. (2011) [9] 14.80 543±22 Zhu et al. (2011) [9] 13.5 480±63 Dzysiuk et al. (2010) [1] 14.2 382±59 Dzysiuk et al. (2010) [1] 14.6 567±60 Dzysiuk et al. (2010) [1] 13.5 437±25 Luo et al. (2007) [10] 14.1 493±28 Luo et al. (2007) [10] 14.6 599±29 Luo et al. (2007) [10] 14.1 515±36 Laurec et al. (1981) [11] 14.8 540±36 Laurec et al. (1981) [11] 14.7 627±52 Qaim (1974) [12] 14.7 655±55 Dilg et al. (1968) [13] 14.7 191±20 Vallis (1966) [14] 14.8 1600±300 Wille and Fink (1960) [15] Table 6. Summary of activation cross section of the 175Lu(n,2n) 174mLu reaction.
Reaction This study References values En /MeV σ/mb En /MeV σ/mb Reference 175Lu(n,2n)174gLu 13.57±0.27 1219± 66 14.1 1433±90 Zhang et al. (2018) [2] 14.03±0.28 1206±63 14.5 1491±98 Zhang et al. (2018) [2] 14.62±0.22 1260 ±67 14.7 1411±94 Zhang et al. (2018) [2] 14.86±0.23 1208±62 13.40 1430±57 Zhu et al. (2011) [9] 13.70 1433±57 Zhu et al. (2011) [9] 14.10 1480±59 Zhu et al. (2011) [9] 14.45 1466±59 Zhu et al. (2011) [9] 14.65 1462±58 Zhu et al. (2011) [9] 14.80 1417±57 Zhu et al. (2011) [9] 14.1 1218±99 Luo et al. (2007) [10] 14.6 1472±100 Luo et al. (2007) [10] 13.54 1388.7±86.1 Wang et al. (1989) [16] 13.73 1450.0±78.9 Wang et al. (1989) [16] 13.97 1470.7±79.9 Wang et al. (1989) [16] 14.23 1487.8±96.7 Wang et al. (1989) [16] 14.47 1541.2±102.0 Wang et al. (1989) [16] 14.67 1416.7±75.1 Wang et al. (1989) [16] 14.81 1391.4±70.2 Wang et al. (1989) [16] 14.1 1390±100 Laurec et al. (1981) [11] 14.8 1440±100 Laurec et al. (1981) [11] 14.7 1276±146 Qaim (1974) [12] 14.7 1285±140 Dilg et al. (1968) [13] 14.7 844±83 Vallis (1966)[14] Table 7. Summary of activation cross section of the 175Lu(n,2n) 174gLu reaction.
The 175Lu(n,p)175Yb, 176Lu(n,d)175Yb, and 176Lu(n, n+p)175Yb reactions produced the same product, 175Yb, because the natural isotopic composition lutetium samples (containing two stable isotopes: 175Lu and 176Lu) were used as the targets in the experiment. Thus, it is necessary to subtract the effects of the interference reactions 176Lu(n,d)175Yb and 176Lu(n,n+p)175Yb (i. e., 176Lu [(n,d)+(n,n+p)] 175Yb) using the following formula (a similar expression can be found in a previous study of ours [39]):
$ {C_{\rm Lu - 176}} = \frac{{{{[M\eta {I_\gamma }\varepsilon KSD]}_{\rm Lu - 176}}}}{{{{[M\eta {I_\gamma }\varepsilon KSD\sigma ]}_{\rm Nb}}}} \cdot \frac{{{{[F\lambda AC]}_{\rm Nb}}}}{{{{[F\lambda A]}_{\rm Lu - 176}}}}{\sigma _{\rm Lu - 176}} , $

(8) where the terms denoted by “Lu-176” are the relevant parameters of the reaction 176Lu[(n,d)+(n,n+p)] 175Yb, the terms denoted by “Nb” are related to the 93Nb(n,2n)92mNb reaction, CLu-176 is the FEP count of the characteristic γ-ray from the 176Lu[(n,d)+(n,n+p)]175Yb reaction, σNb denotes the cross section values of the 93Nb(n,2n)92mNb reaction, and σLu-176 denotes the reliable experimental or evaluated cross section values of the 176Lu[(n,d)+(n,n+p)]175Yb reaction. The other letters (such as M, η, Iγ, ε, K, S, D, F, λ, A, C) have the same meanings as those in Eq. (3). In the calculation of the cross section of the 175Lu(n,p)175Yb reaction in this study, the effect (i.e., the FEP count of the γ-ray of 175Yb from the 176Lu[(n,d)+(n,n+p)]175Yb reaction, that is, CLu-176) on the cross-section measurement of the 175Lu(n,p)175Yb reaction was obtained using Eq. (8) and the evaluated cross section values of the 176Lu[(n,d)+(n,n+p)] 175Yb reaction (which are 0.73, 1.20, 2.05, 2.46 mb at 13.57, 14.03, 14.62, and 14.86 MeV, respectively) were obtained from JEFF-3.3.
The 175Lu(n,2n)174mLu and 176Lu(n,3n)174mLu reactions produced the same product 174mLu because natural lutetium samples were used as targets in the experiment. The effect of the 176Lu(n,3n)174mLu reaction (with reaction threshold energy of 14.206 MeV) on the cross-section measurement of the 175Lu(n,2n)174mLu reaction at neutron energies of 14.62 and 14.86 MeV were deduced using Eq. (8) and reliable experimental or evaluated cross section values of the 176Lu(n,3n)174mLu reaction. However, it is impossible to deduce this effect owing to the lack of experimental or evaluated cross section values of the 176Lu(n,3n)174mLu reaction. In other words, the cross-section values of the 175Lu(n,2n)174mLu reaction in the present study include the contribution of the 176Lu(n,3n)174mLu reaction at neutron energies of 14.62 and 14.86 MeV. In fact, all previous experimental cross-section data of the 175Lu(n,2n)174mLu reaction using natural isotopic composition samples included the contribution of the 176Lu(n,3n)174mLu reaction.
The decay of the excited state 174mLu from the 175Lu(n,2n)174mLu reaction has an influence on the cross-section measurement of the 175Lu(n,2n)174gLu reaction. Thus, it is also necessary to subtract the decay influence of the excited state 174mLu on the cross-section measurement of the 175Lu(n,2n)174gLu reaction using the following formula (a similar expression can be found in a previous study of us [40]):
$ {\text{C}}_{g}^{\text{'}}=\frac{{I}_{rg}{\epsilon }_{g}{X}_{it}({\lambda }_{g}^{2}{S}_{m}{D}_{m}{K}_{m}-{\lambda }_{m}^{2}{S}_{g}{D}_{g}{K}_{g}){F}_{ms}{F}_{mg}{F}_{mc}}{{I}_{rm}{\epsilon }_{m}{K}_{m}{S}_{m}{D}_{mm}{F}_{gs}{F}_{gg}{F}_{gc}{\lambda }_{g}({\lambda }_{g}-{\lambda }_{m})}{C}_{m}, $

(9) where the terms denoted by “g” are the relevant parameters of the 175Lu(n,2n)174gLu
reaction, the terms denoted by “m” are related to the 175Lu(n,2n)174mLu reaction, Cm in Eq. (9) is the FEP count of any characteristic γ-ray of 174mLu from the 175Lu(n,2n)174mLu reaction, $ C_g^{'} $ is the part that we deduce from the total FEP count of the characteristic γ-ray of 174gLu in the cross-section measurement of the 175Lu(n,2n)174gLu reaction, Irg is the intensity of the characteristic γ-ray of 174gLu, εg is the FEP efficiency of the characteristic γ-ray of 174gLu in the detector, Irm is the intensity of the characteristic γ-ray of 174mLu, εm is the FEP efficiency of the characteristic γ-ray of 174mLu in the detector, Xit is the branching ratio (i.e., the fraction of the decay of the excited state 174mLu that produces the ground state 174gLu), and F and λ have the same meanings as in Eq. (3).$ {S_m} = 1 - {{\rm e}^{ - {\lambda _m}{T_1}}}, $

(10) $ {D_m} = {{\rm e}^{ - {\lambda _m}{T_{2g}}}}(1 - {{\rm e}^{ - {\lambda _m}{T_{3g}}}}) ,$

(11) $ {K_m} = {{\Big[\sum\limits_i^L {{\phi _i}} (1 - {{\rm e}^{ - {\lambda _m}\Delta {t_i}}}){{\rm e}^{ - {\lambda _m}{T_i}}}\Big]}/{\phi {S_m}}}, $

(12) $ {S_g} = 1 - {{\rm e}^{ - {\lambda _g}{T_1}}}, $

(13) $ {D_g} = {{\rm e}^{ - {\lambda _g}{T_{2g}}}}(1 - {{\rm e}^{ - {\lambda _g}{T_{3g}}}}), $

(14) $ {K_g} = {{\Big[\sum\limits_i^L {{\phi _i}} (1 - {{\rm e}^{ - {\lambda _g}\Delta {t_i}}}){{\rm e}^{ - {\lambda _g}{T_i}}}\Big]}/{\phi {S_g}}}, $

(15) $ {D_{mm}} = {{\rm e}^{ - {\lambda _m}{T_{2m}}}}(1 - {{\rm e}^{ - {\lambda _m}{T_{3m}}}}). $

(16) When the cross-section data of the 175Lu(n,2n)174gLu reaction were deduced from Eq. (1), we obtained that the FEP count CLu-174g of the characteristic γ-ray equals the total FEP count CLu-174gtotal of the characteristic γ-ray minus the
$ C_g^{'} $ from Eq. (9),$ C_{\rm Lu-174g}= C_{\rm Lu-174gtotal} - C'_{g} .$

(17) In addition, for the 175Lu(n,2n)174gLu reaction, similar to the 175Lu(n,2n)174mLu reaction described above, the 176Lu(n,3n)174gLu reaction (with reaction threshold energy of 14.034 MeV) has an influence on the cross-section measurement of the 175Lu(n,2n)174gLu reaction at neutron energies of 14.62 and 14.86 MeV. Thus, the effect of the 176Lu(n,3n)174gLu reaction on the cross-section measurement of the 175Lu(n,2n)174gLu reaction must be deduced from Eq. (8) and reliable experimental or evaluated cross section values of the 176Lu(n,3n)174gLu reaction. However, this contribution is negligible. According to the evaluated cross-section value of the 176Lu(n,3n)174Lu reaction given by JEFF-3.3, the result after deducing the contribution of the 176Lu(n,3n)174Lu reaction is basically the same as the result obtained without considering such contribution.
In this study, the main sources of uncertainty and their estimated values are as follows: weight of samples (0.1%), neutron fluctuation (1.0%), γ-ray detection efficiency of the detector (2.0%), standard cross sections (1.1%–1.5%), counting statistics (0.87%–4.46%), sample geometry (1.0%), self-absorption of γ-ray (1.0%), relative γ-ray intensities (2.27%−10%), half-lives of products (0.024%−1.511%), and abundances of target isotopes (0.013%−0.5%). The individual uncertainties mentioned above were combined in a quadratic sum to obtain an overall uncertainty of 4.64%–11.7%.
-
The theoretical calculations of the excitation functions for the 175Lu(n,p)175Yb, 175Lu(n,α)172Tm, 176Lu(n,α)173Tm, 175Lu(n,2n)174mLu, and 175Lu(n,2n)174gLu reactions at neutron energies from the reaction threshold to 20 MeV were performed using the nuclear theoretical model program system Talys-1.95. The theoretical curves of excitation functions are charted in Figs. 3–7 for comparison.
TALYS is a versatile tool in nuclear physics for the analysis of basic nuclear reaction experiments or generation of nuclear data for applications. TALYS is a copyleft free software that is always under development and can be used to simulate nuclear reactions involving neutrons, photons, protons, deuterons, tritons, 3He, and α-particles in the energy range of 0.001−200 MeV and target nuclides of mass 12 and heavier [23]. The first official version was Talys -1.0, released on December 21, 2007. Talys-1.95 and Talys-1.96 are newer versions. We used Talys-1.95, whose complete description can be found in the Talys-1.95 user manual [23].
In the simulations of excitation functions for the 175Lu(n,p)175Yb, 175Lu(n,α)172Tm, 176Lu(n,α)173Tm, 175Lu(n,2n)174mLu, and 175Lu(n,2n)174gLu reactions, the different parameters in Talys-1.95 were adjusted according to our measured data and those of previous experiments conducted by other researchers. For the 175Lu(n,p)175Yb reaction, the m2constant (overall constant for the matrix element or optical model strength in the exciton model) was adjusted to 2.01. For the 175Lu(n,α)172Tm, 176Lu(n,α)173Tm, and 175Lu(n,2n)174gLu reactions, the values of the optical model potential (OMP) parameter rV were adjusted to 0.5, 0.8, and 1.2, respectively. For the 175Lu(n,2n)174mLu reaction, the values of the level density parameter a at the neutron separation energy was adjusted to 14.65. All other parameters were set to default values.
-
The cross section data for the 175Lu(n, p)175Yb reaction are shown in Table 3 and Fig. 3. It can be seen that there are significant differences in the evaluation curves of excitation functions of ENDF/B-VIII.0, JEFF-3.3, JENDL-5, BROND-3.1, and the theoretical curve based on the Talys-1.95 code, except for those of ENDF/B-VIII.0 and BROND-3.1, which are the same. The evaluated curve of JEFF-3.3 does not pass through any experimental point. The evaluated curve of JENDL-5 passes only through the experimental point reported by Sato et al. (1975) [6] (the cross section value was recalculated using the latest γ-ray intensity 13.2%) within experimental uncertainty. The evaluated curve of ENDF/B-VIII.0 and BROND-3 passes through the two experimental points reported by Zhang et al. (2018) [2], the two experimental points reported by Luo et al. (2011) [4] (the cross section values were recalculated using the latest γ-ray intensity 13.2%), the experimental point reported by Coleman et al. (1959) [7], and one experimental point of our experimental cross-section values within experimental uncertainty. Our results are consistent, within experimental uncertainty, with the cross-section data reported by Luo et al. (2011) [4] (which were recalculated using the latest γ-ray intensity 13.2%) at close neutron energies, and with the value reported by Zhang et al. (2018) [2] at approximately neutron energies of 14.1 and 14.6 MeV. The theoretical curve based on Talys-1.95 matches well our results, the data reported by Zhang et al. (2018) [2], the data reported by Luo et al. (2011) [4] (which were recalculated using the latest γ-ray intensity 13.2%), and the data reported by Coleman et al. (1959) [7]. The consistency of the theoretical excitation curve of the 175Lu(n, p)175Yb reaction with most of the experimental cross-section data is higher than that of the evaluation curves of excitation functions of IAEA.
For the 175Lu(n, α)172Tm reaction, Table 4 and Fig. 4show that the evaluation curves of excitation functions of IAEA and the theoretical curve based on the Talys-1.95 code differ enormously. The evaluation curves of excitation functions of JEFF-3.3, JENDL-5, and BROND-3.1 do not pass through any experimental point; the evaluated curve of ENDF/B-VIII.0 passes through the two experimental points reported by Dzysiuk et al. (2010) [1], the two experimental points reported by Zhang et al. (2018) [2], one experimental point reported by Luo et al. (2011) [4], and one point from our experiments within experimental uncertainty. Our results are consistent, within experimental uncertainty, with the data reported by Luo et al. (2011) [4] at close neutron energies, and with the value reported by Dzysiuk et al. (2010) [1] at an approximate neutron energy of 13.5 MeV. The theoretical curve based on Talys-1.95 agrees well with our results, with experimental data reported by Luo et al. (2011) [4], and with data reported by Dzysiuk et al. (2010) [1] at a neutron energy of 13.5 MeV, as well as with the experimental data reported by Qaim (1984) [8]. The consistency of the theoretical curve with most of the experimental data is higher than that of the evaluation curves of excitation functions of IAEA.
For the 176Lu(n,α)173Tm reaction, Table 5 and Fig. 5show that there are significant differences in the evaluation curves of excitation functions of IAEA and theoretical curve based on the Talys-1.95 code, except for those of ENDF/B-VIII.0 and BROND-3.1, which are the same. The evaluated excitation curve of JEFF-3.3 passes only through the experimental point reported by Sato et al. (1975) [6] within experimental uncertainty. The evaluated excitation curve of ENDF/B-VIII.0 and BROND-3.1 passes through the experimental point reported by Dzysiuk et al. (2010) [1] and one experimental point reported by Luo et al. (2011) at a neutron energy of 13.5 MeV [4]. The evaluated excitation curve of JENDL-5 passes through the two experimental points reported by Luo et al. (2011) at neutron energies of 13.5 and 14.1 MeV [4], and the experimental point reported by Qaim (1984) [8] within experimental uncertainty. Our experimental cross-section values are consistent, within experimental uncertainty, with the data reported by Luo et al. (2011) [4] at close neutron energies. The theoretical excitation curve based on Talys-1.95 agrees well with our experimental data, experimental data reported by Luo et al. (2011) [4], and experimental data reported by Qaim (1984) [8]. The consistency of the theoretical excitation curve with most of the experimental cross-section data is higher than that of the evaluation curves of excitation functions in the five major nuclear data libraries of IAEA.
For the 175Lu(n,2n)174mLu reaction, there are no cross section data in the five major evaluated nuclear data libraries of IAEA. Figure 6 shows that the theoretical curve based on Talys-1.95 matches most of the experimental data well. Table 6 and Fig. 6 also show that our results are consistent, within experimental uncertainty, with those of the fitting curves of the results reported by Zhu et al. (2011) [9] and those of the theoretical curve at the corresponding energies. In addition, our value is consistent, within experimental uncertainty, with that of the results reported by Dzysiuk et al. (2010) [1] at a neutron energy of approximately 13.5 MeV; at a neutron energy of approximately 14.1 MeV, our value is consistent with that of the results reported by Zhang et al. (2018) [2], that of the results reported by Zhu et al. (2011) [9], that of the results reported by Luo et al. (2007) [10], and that of the results reported by Laurec et al. (1981) [11]; at a neutron energy of approximately 14.6 MeV, our value is consistent, within experimental uncertainty, with that of the results reported by Dzysiuk et al. (2010) [1] and that of the results reported by Luo et al. (2007) [10]; at a neutron energy of approximately 14.8 MeV, our value is consistent, within experimental uncertainty, with that of the results reported by Laurec et al. (1981) [11].
For the 175Lu(n,2n)174gLu reaction, there are no data of cross sections in the five major evaluated nuclear data libraries of IAEA either. Table 7 and Fig. 7 show that the theoretical excitation curve based on Talys-1.95 matches well with our experimental data, with the result reported by Luo et al. (2007) at a neutron energy of 14.1 MeV [10], and with the values reported by Qaim (1974) [12] and Dilg et al. (1968) [13]. At a neutron energy of approximately 14.1 MeV, our experimental value is consistent, within uncertainty, with that of the results reported by Luo et al. (2007) [10]. Similarly, at a neutron energy of 14.62 MeV, our value within uncertainty is consistent with the results reported by Qaim (1974) [12] and Dilg et al. (1968) [13] at an energy of 14.7 MeV. In contrast, the experimental value of Vallis (1966) [14] is much lower than that of other experimental values and that of the theoretical excitation curve based on Talys-1.95 at the corresponding energy, whereas the results reported by Zhang et al. (2018) [2], Zhu et al. (2011) [9], Laurec et al. (1981) [11], and Wang et al. (1989) [16] are notable higher than the values of our experimental cross-section data and those of the theoretical excitation curve based on Talys-1.95 at the corresponding energy. The reason for these high experimental cross-section values reported in Refs. [2, 9, 11, 16] is still unclear. At present, we only know that the monitor reaction used in Refs. [2, 9, 11, 16] is 27Al (n,2n)24Na, while the monitor reaction that we used is 93Nb(n,2n)92mNb. Whether the extremely large discrepancies between our experimental cross-section values and these high experimental cross-section values are caused by the monitor reaction needs further investigation. The 175Lu(n,2n)174gLu reaction is a special reaction with a long-lived product nucleus 74gLu (3.31Y half-life), and only two relatively strong γ-rays are emitted by the product nucleus 74gLu, i.e., 76.5 keV (5.9% intensity) and 1241.8 keV (5.14% intensity). The γ-ray at 76.4 keV exhibits large self-absorption due to the low energy, and the full-energy peak of the γ-ray at 76.5 keV overlaps with the full-energy peak of another γ-ray at 76.5 keV from 174mLu. Thus, only the γ-ray at 1241.8 keV can be used to measure the cross-section of the 175Lu(n,2n)174gLu reaction using the activation technique and off-line gamma-ray spectroscopy.
-
The cross section data of the 175Lu(n,p)175Yb, 175Lu(n,α)172T, 176Lu(n,α)173Tm, 175Lu(n,2n)174mLu, and 175Lu(n,2n)174gLu reactions were obtained at four neutron energies, namely, 13.57, 14.03, 14.62, and 14.86 MeV, using an activation technique in combination with high-resolution off-line gamma-ray spectroscopy. The theoretical curves of the excitation functions of these neutron-induced nuclear reactions were calculated up to an incident neutron energy of 20 MeV using the Talys-1.95 code with the relevant parameters adjusted properly. The data obtained from nuclear reactions were analyzed and compared with those of previous experiments reported by other research groups, with the evaluated data available from IAEA, and with the theoretical values based on Talys-1.95. For the aforementioned five nuclear reactions, our experimentally obtained cross section values at some neutron energies agree with some results of previous experiments at close energies and those of the theoretical excitation curves at the corresponding energies; the theoretical curves of excitation functions based on Talys-1.95 match well with our results and with some results of previous experiments. Regarding the 175Lu(n,p)175Yb, 175Lu(n,α)172 Tm, and 176Lu(n,α)173Tm reactions, the consistency of these theoretical curves of excitation functions based on Talys-1.95 with most of experimental cross-section data is higher than that of the evaluation curves of excitation functions in the evaluated nuclear data libraries ENDF/B-VIII.0, JEFF-3.3, JENDL-5, and BROND-3.1 of IAEA. This study is helpful because it provides new evaluated reaction cross-section data on the fusion reactor material lutetium, improves the quality of the neutron-induced reaction cross section data libraries, and advances the research on related applications.
Cross sections for 14 MeV neutron interaction with lutetium isotopes and their theoretical excitation functions
- Received Date: 2023-12-27
- Available Online: 2024-05-15
Abstract: The cross-sections for the 175Lu(n,p)175Yb, 175Lu(n,α)172Tm, 176Lu(n,α)173Tm, 175Lu(n,2n)174mLu, and 175Lu(n,2n)174gLu reactions at 13.57, 14.03 14.62, and 14.86 MeV neutron energies were measured using an activation technique. The theoretical excitation functions of these reactions were calculated using the Talys-1.95 code. The reaction cross-section data experimentally obtained were analyzed and compared with experimental data reported in the literature, data from five major evaluated nuclear data libraries of IAEA, and theoretical values based on Talys-1.95. The data obtained at some neutron energies agree with some of the data reported in the literature and theoretical values based on Talys-1.95. The consistency of the theoretical curves of excitation functions based on Talys-1.95 with the data obtained in this study and those reported in the literature is higher than that of the evaluation curves of excitation functions for the 175Lu(n,p)175Yb, 175Lu(n,α)172 Tm, and 176Lu(n,α)173Tm reactions. This study is helpful because it provides new evaluated reaction cross-section data on lutetium (which is a fusion reactor material), improves the quality of neutron-induced reaction cross section data libraries, and advances the research on related applications.


 Abstract
 HTML
HTML Reference
 Related
 PDF
PDF




 DownLoad: