


 Abstract
 HTML
 Reference
 Related
 PDF



-
New isotopes of the elements Rf, Db, and Sg have been previously synthesized in the cold-fusion reactions of the doubly-magic nuclei 208Pb and 209Bi with massive ions having proton numbers Z=22−30 and neutron numbers N=28−40. In addition, new elements from Bh to Nh (Z=107−113) with cross sections ranging from 530 pb to 22 fb (see Reviews [1−4] and the references therein) have been reported. Progress toward more heavy elements was achieved through the fusion reactions of doubly magic 48Ca with nuclei from 238U to 249Cf. In these reactions, approximately 40 new nuclides with Z=104−113 and isotopes of new elements from Fl to Og (Z=114−118) with cross sections from 17 pb to 0.5 pb were synthesized (see Reviews [5, 6] and the references therein).
Since 2007, attempts have been made to synthesize even heavier elements 119 and 120. However, they did not lead to a positive result [7−11]. The reasons for such a relentless interest in the synthesis of new elements is not limited to the desire of researchers to claim the naming rights. The properties of the decay of new elements and, especially, the cross sections of their formation can shed light on one of the fundamental properties of nuclear matter - the magic proton number Zmag for the heaviest nuclei. As is known, there is still no agreement among theoreticians regarding the Zmag value; some consider Zmag = 114, whereas others consider Zmag = 120−126. It may be expected that as we approach or move away from Zmag, the value of the fission barrier will increase or decrease, respectively. The magnitude of the fission barrier plays a determining role in the survival probability of the compound nucleus (CN) and, ultimately, in the value of the reaction cross section.
Recently, several studies have focused on choosing the optimal reaction for the synthesis of new elements or testing the facilities where these investigations can be carried out [12−16]. The reactions 249Bk(50Ti, 3−4n)295,296119, 248Cm(51V, 3−4n)295,296119, 243Am(54Cr, 3−4n)293, 294119 are considered optimal for the synthesis of element 119.
The first two reactions, after the probable α decay of isotopes 295,296119, lead to unknown nuclei 291,292Ts, and then to the known chain of 287,288Mc – 267,268Db [17]. The reliable identification of the mother nuclei will be based on the method of genetic relations [17]. The decays of the 243Am(54Cr,3n)294119 reaction products also lead to the known chain of 286Mc – 266Db. However, among the potential products of the 4n reaction channel, i.e., 293119, only spontaneously fissioning 261Lr is considered known. However, it may not be realized if 265Db is also spontaneously fissioning.
In this case, it is important to measure in advance the decay properties of isotopes starting from 285Mc or 281Nh, which are products of the 4n channel of reactions of 48Ca with 241Am or 237Np, as well as the reaction excitation function. Then, combinations of criteria related to cross-bombardments (or cross-reactions in Ref. [17]), excitation functions or yield curves, properties of heavy ion separators, systematics of experimental results, and theoretical predictions can be used to more reliably prove the synthesis of a new element 119.
The relatively short half-life of 241Am (432.6 y [18]) creates some difficulties when using it in an experiment. Therefore, we decided to repeat the 237Np+48Ca experiment that was performed in 2006 with use of position-sensitive detectors and a low time resolution (0.1 ms) [19] but at a slightly higher beam energy, which would correspond to the expected maximum of the 4n-reaction channel. The choice was based on the previously measured excitation functions of the 48Ca-induced reactions with the nuclei of actinide elements [5, 6].
In addition to the properties of the new isotopes in the chain 281Nh-265Db, clarifying the properties of the nuclei in the chain starting with 282Nh was of interest. In Refs. [19, 20], we observed two decay chains of 282Nh in the 237Np(48Ca, 3n) reaction and one after the decay of 286Mc, which is the 243Am(48Ca, 5n) reaction product.
However, in the first chain of the 237Np+48Ca reaction, the α-particle energy Eα of 274Mt was measured only by the side detector with a low accuracy (1.08 MeV). In the second chain, the α particle of 278Rg was registered by the focal detector and the energy of 274Mt was 9.76 MeV, although one would expect a value of 10.45±0.23 MeV, almost 0.7 MeV higher, according to Ref. [21]. In the decay chain of 286Mc, the α particle of 274Mt escaped the focal detector, leaving 0.963 MeV, and did not enter the side detector (the location of similar detectors is described below). In addition, from the extrapolation of the half-life Tα of 275,276,278Mt, one would expect Tα of several milliseconds for 274Mt [1−6, 16, 18−20]. However, the decay times of 274Mt in the three decay chains were in the range of 0.47−1.48 s. Such differences in the energy and half-life of 274Mt from the expected values may indicate the presence of a long-lived state. Thus, the clarification of the decay properties of 274Mt was also of interest from the point of view of studying the structure of superheavy nuclei.
-
The 237Np+48Ca reaction was studied using the Dubna gas-filled separator DGFRS-2 [22, 23] and the cyclotron DC280 of the SHE Factory at FLNR, JINR [24]. Some parameters of the experiment and results are listed in Table 1.
Target
thickness
/(mg·cm−2)Elaba
/MeVE* b
/MeVBeam dose
×1019No. of chains
3n / 4nσ3n
/pbσ4n
/pb0.89 248.3 40.2−44.5 1.0 3 / 0 $0.43^{+0.46}_{-0.25}$ $\leqslant $ 0.280.37 244 36.9−41.3 1.1 2 / 0 $ 0.85^{+1.61}_{-0.59}$ − a The beam energy was measured with a systematic uncertainty of 1 MeV. b The excitation-energy ranges of the CN 285Nh were estimated by the Monte Carlo method taking into account the beam-energy resolution, small variation in the beam energy during irradiation, and energy loss in the target. Table 1. 237Np target thickness; reaction-specific laboratory-frame 48Ca energy Elab in the middle of the target layer; interval of resulting excitation energy E* (using the mass tables [18] for 237Np and 48Ca and [25] for 285Nh; Q value is 164.17 MeV); total beam dose; number of observed decay chains of 282Nh (3n) and 281Nh (4n); and production cross section σ. Data in the last row are from Ref. [19].
Similar to the experiments [13, 14, 20], the 237Np target consisted of twelve segments, which were produced by electrodeposition on 0.6-mg/cm2 Ti backing and mounted on a disk with a diameter of 24 cm, rotated at 980 rpm. The reaction products, before implantation into focal detectors, passed through the H2 gas-filled DGFRS-2 separator at a pressure of 0.9 mbar. The separator had a 0.7-μm mylar separating foil and two multiwire proportional chambers located in pentane at a pressure of 1.6 mbar. For reducing the counting rate of low-energy particles, which are the dominant background source on the detectors, a 0.2 mg/cm2 thick Al foil was installed in front of the detectors before observing the third chain of 282Nh in this experiment (see below). Al foil led to a slight decrease in the implantation energy of the nucleus and a 6-fold decrease in the background. The transmission efficiency was estimated to be approximately 0.35 for a 0.89 mg/cm2 thick target and the detector used in the experiment [23]. The typical beam intensity in front of the target was approximately 3 pμA.
After the experiment, an analysis of the target material was conducted. In the 238U+48Ca experiment [26] with a maximum beam intensity of 6.5 pμA and beam dose of 2.6×10¹⁹, the target thickness decreased by 3%, and the thickness of the backing increased slightly. In this experiment, the layers of Np and Ti were damaged after a total beam dose of 2.1×10¹⁹. Approximately 20% of the thick Np material was lost in the beam spot area, and the Ti backing was damaged by 5%−80% across different sectors. For this reason, the data of the first part of the experiment with the dose of 1×10¹⁹ ions were used in the analysis. Beyond this point, the experimental conditions changed, as both the beam energy inside the target and amount of target material became poorly defined. No events were observed after a dose of 1×10¹⁹ ions.
Two double-sided silicon strip detectors (DSSDs) with an active area of 60 mm×120 mm and a thickness of 0.3 mm were installed close to each other in the focal plane of the separator. Thus, the total horizontal width was 240 mm. These detectors had 48 1.25-mm horizontal strips at the front of the detector and 48 2.5-mm vertical strips at the back, which were used to determine the vertical and horizontal positions of the nuclei on the detectors, respectively. The focal detector was surrounded by ten 60 mm×120-mm side silicon detectors (SSDs), each with eight strips, constituting a box with a depth of 120 mm. The signals in the focal and side detectors with amplitudes above the thresholds of ≈0.5 and ≈2.7 MeV, respectively, were recorded independently by digital and analog data acquisition systems.
The analog system, along with ordinary signal processing, was also used for the online registration of the correlations of the evaporation residues (ERs) and α particles registered with full energy in the DSSD, with the energies and ER-α time interval expected for implantation in the DSSD and subsequent α decays of the parent or daughter nuclei. This pair of events caused the beam to be switched off in approximately 0.1 ms to observe the decays of the descendant nuclei under low background conditions.
-
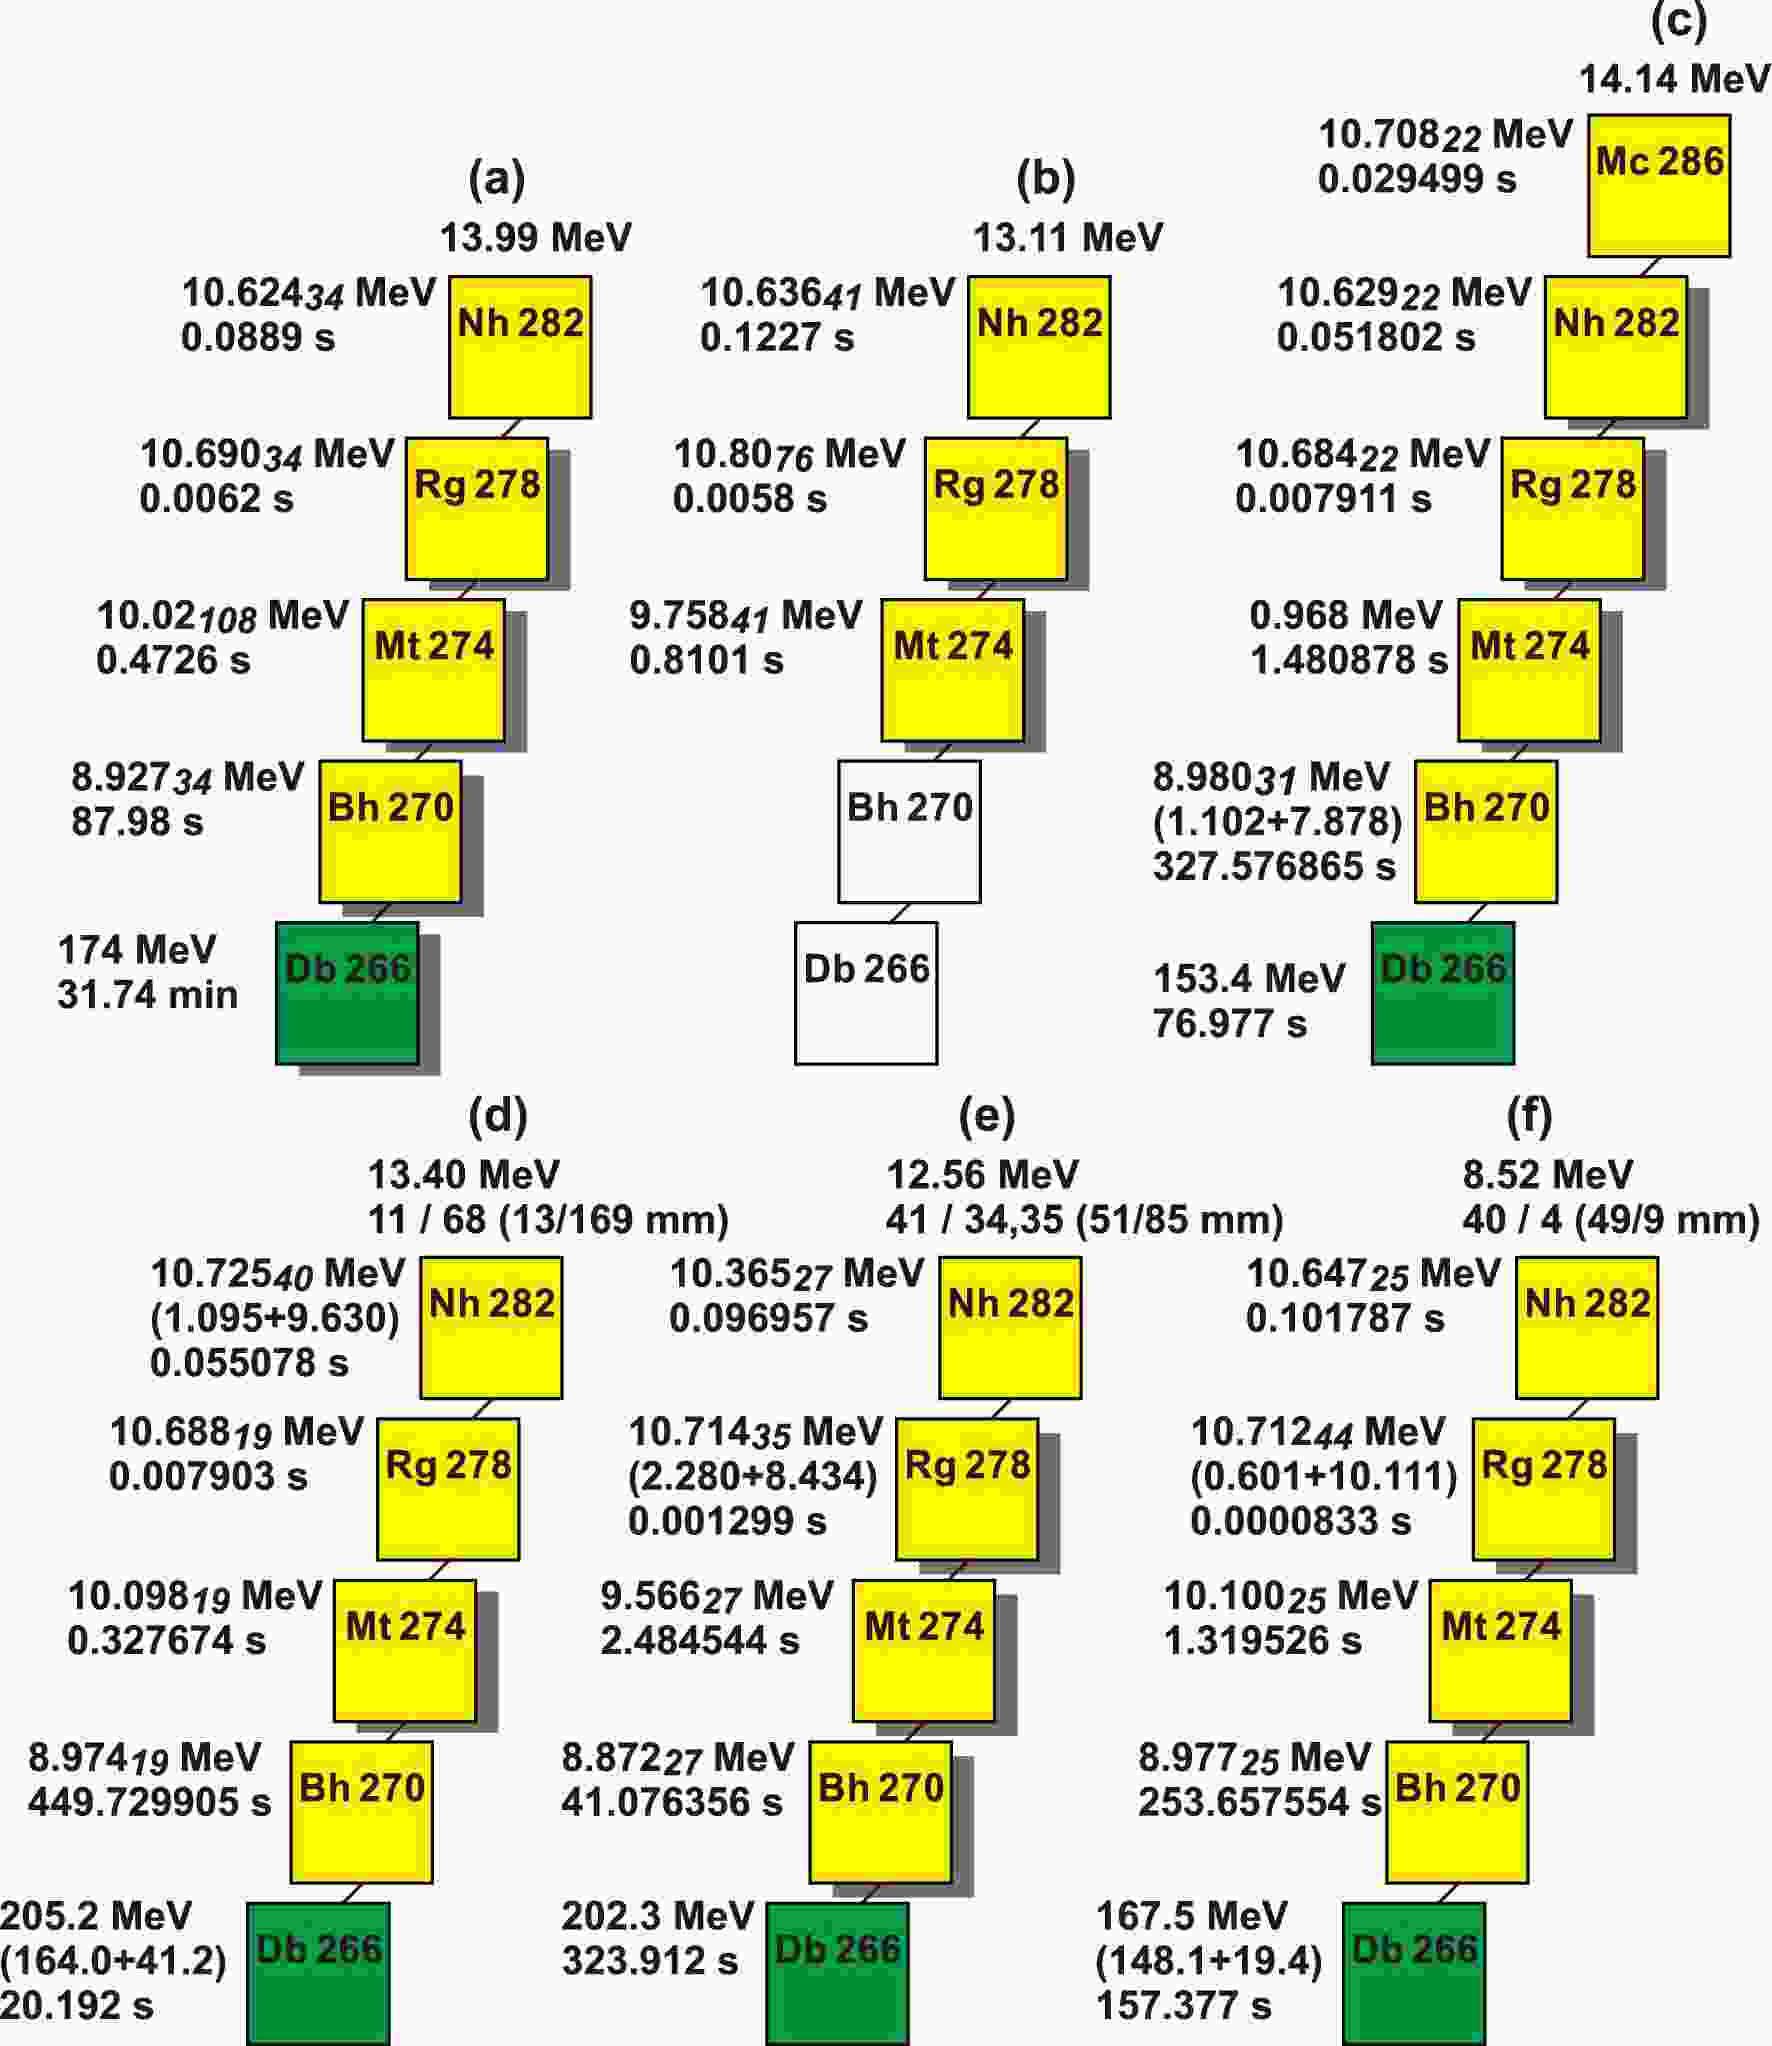
The energies of the α particles and spontaneous fission (SF) fragments and decay times of the nuclei in the decay chains observed in this study are shown in Fig. 1(d-f). The same details are shown for the nuclei obtained in Ref. [19] and Ref. [20] in Fig. 1(a,b) and Fig. 1(c), respectively, for comparison.
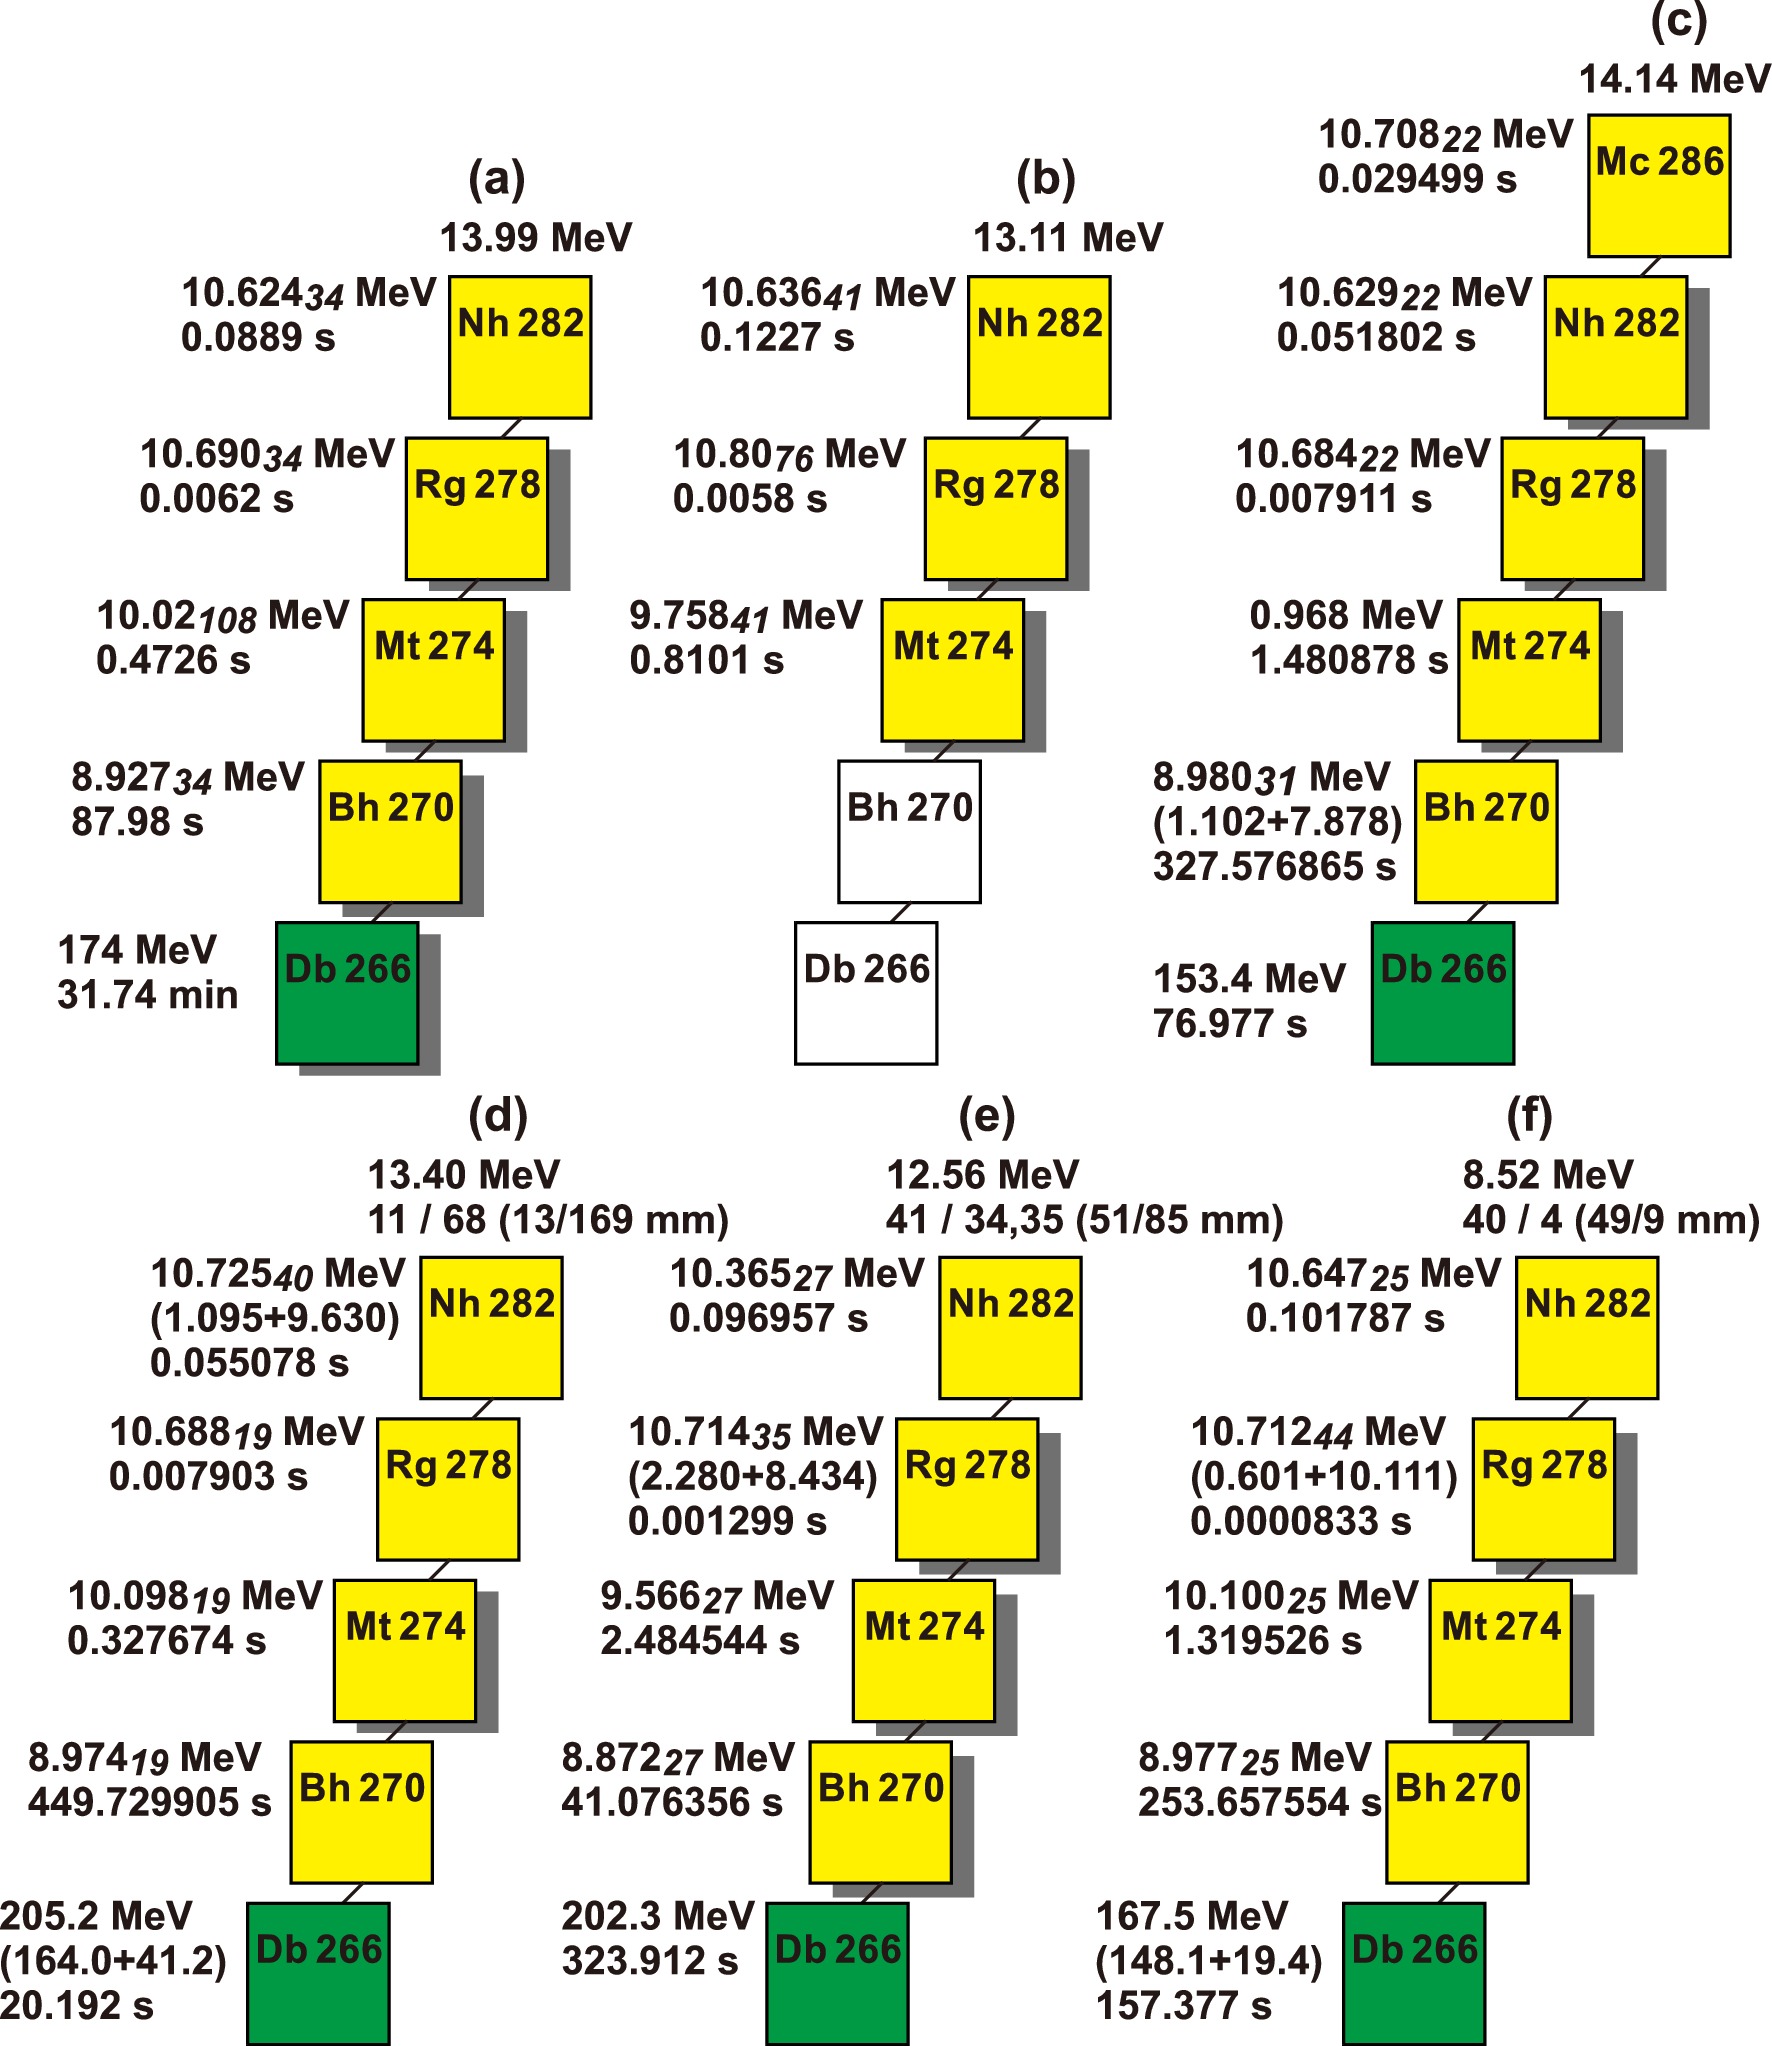
Figure 1. (color online) Decay chains originating from 286Mc and 282Nh observed in the 243Am + 48Ca and 237Np + 48Ca reactions, respectively. Chains (a, b) and (c) were published in Ref. [19] and Ref. [20], respectively. Chains (d-f) are results of this study. The upper rows show the ER energy in chains (a-f) and vertical and horizontal positions on the detector in chains (d-f). The left rows provide the α-particle [in yellow (light gray)] and SF [in green (dark gray)] energies and time intervals between the events. The energies of the summed signals (in DSSD + SSD) are given in parentheses. The events marked with a shadow were registered during the beam-off period. The α-particle energy errors (standard deviations) are shown by smaller italic numbers. The decays of 270Bh and 266Db in chain (b) were not recorded in Ref. [19].
The number of random sequences imitating any of the chains in Fig. 1(d-f) was estimated based on the average counting rates of the beam-on full energy α particles (Eα = 8.5−11 MeV) and SF events registered in the DSSD (ESF > 120 MeV). Time intervals of 10 s for the first three α decays and 1000 s for the fourth α decay and SF were used. Under these conditions, the number of random sequences was found to be less than 10–14 [27]. Observing each α particle during the beam-off interval or registering it simultaneously by the DSSD and SSD reduces this probability by an additional factor of 10 or 2, respectively.
The energy spectra and lifetime distributions of the α particles of 282Nh, 278Rg, 274Mt, 270Bh, and 266Db (only lifetime distribution) observed in Refs. [19, 20] and this study are shown in Fig. 2. Note that the distributions of the decay times for all of the observed isotopes from 282Nh to 266Db satisfy the criterion for a single radioactive species suggested in Ref. [28].
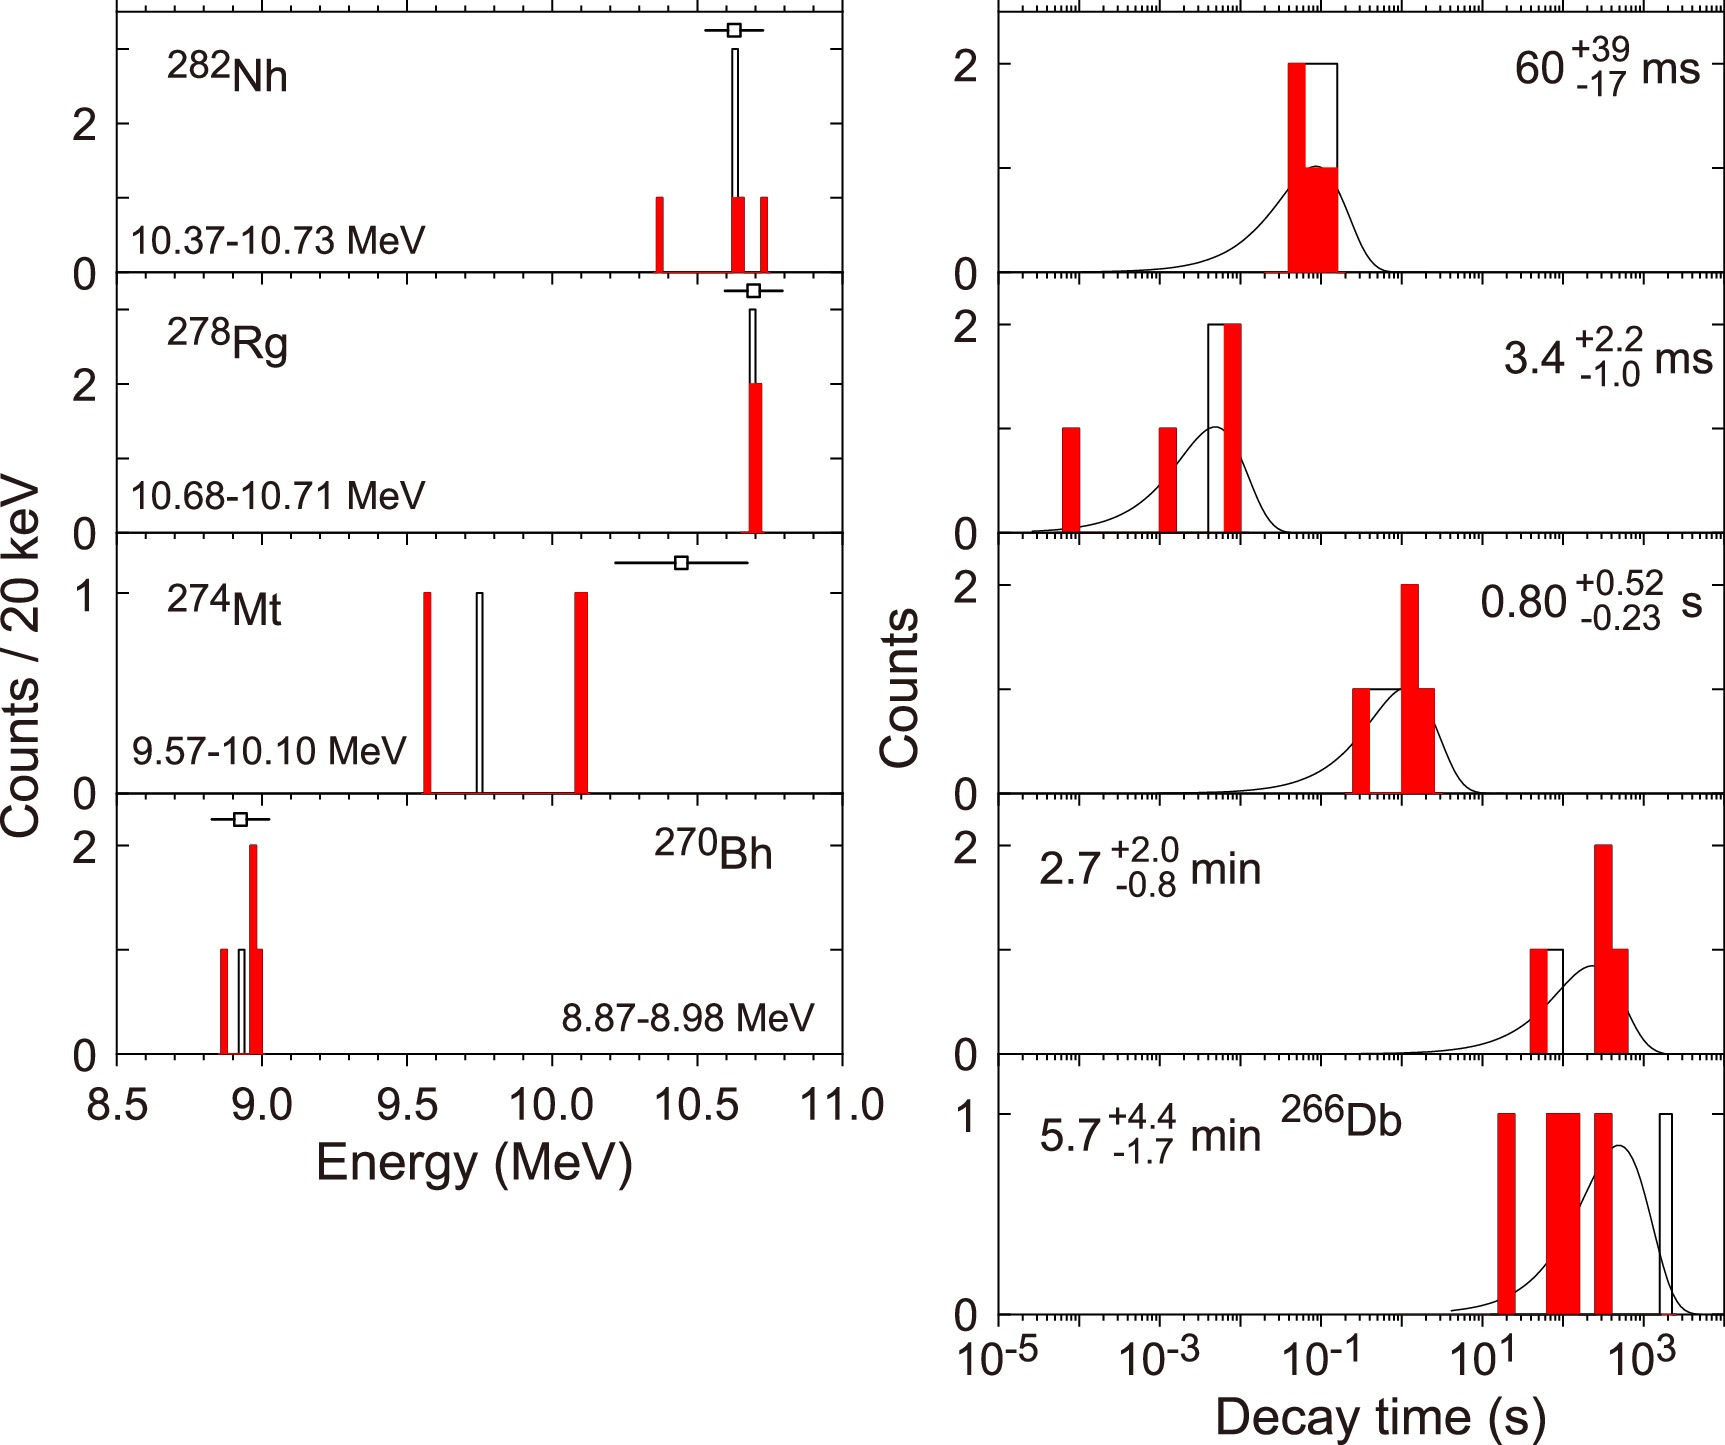
Figure 2. (color online) Alpha-particle energy spectra (left-hand panel) and decay-time distributions on a logarithmic scale (right-hand panel) for 282Nh and descendant nuclei. The events originating from 282Nh observed at DGFRS-2 in Ref. [20] and this study are shown by full red histograms; previous results obtained at DGFRS [19] are shown by open histograms. For α-particle spectra, events with an energy resolution of
$\leqslant $ 45 keV were selected. At the top of each spectrum, the average Eα value and uncertainty interval recalculated from the Qα value according to Ref. [21] are shown. Alpha-particle energy intervals given on the left-hand panels for each isotope are determined from all known events. Regarding the distribution of the decay times, the smooth curves are the time distributions for exponential decays calculated with the half-lives T1/2 shown in the figures.The α-particle energies of the nuclei observed in this study are consistent with those in Refs. [19, 20]. In addition, the measured decay times in this and previous experiments do not contradict each other. The energies Eα and intervals recalculated from the α-decay energies Qα according to Ref. [21] are shown above the energy spectra. There is a good agreement between the experimental results and calculations for all nuclei except 274Mt. From Ref. [21], the Eα value of 10.45±0.23 MeV is obtained, although the measured values range from 9.57 to 10.10 MeV.
In addition, the decay times of 274Mt are in the range of 0.3−2.5 s, which is significantly higher than the half-life according to the systematics of T1/2 for neighboring odd-Z nuclei (Fig. 3). As stated above, from the dependence of T1/2 of isotopes 275,276,278Mt on the number of neutrons, this value for 274Mt could be several milliseconds. However, the T1/2 value determined for all six decays was
$0.8^{+0.52}_{-0.23} $ s, i.e., two orders of magnitude higher.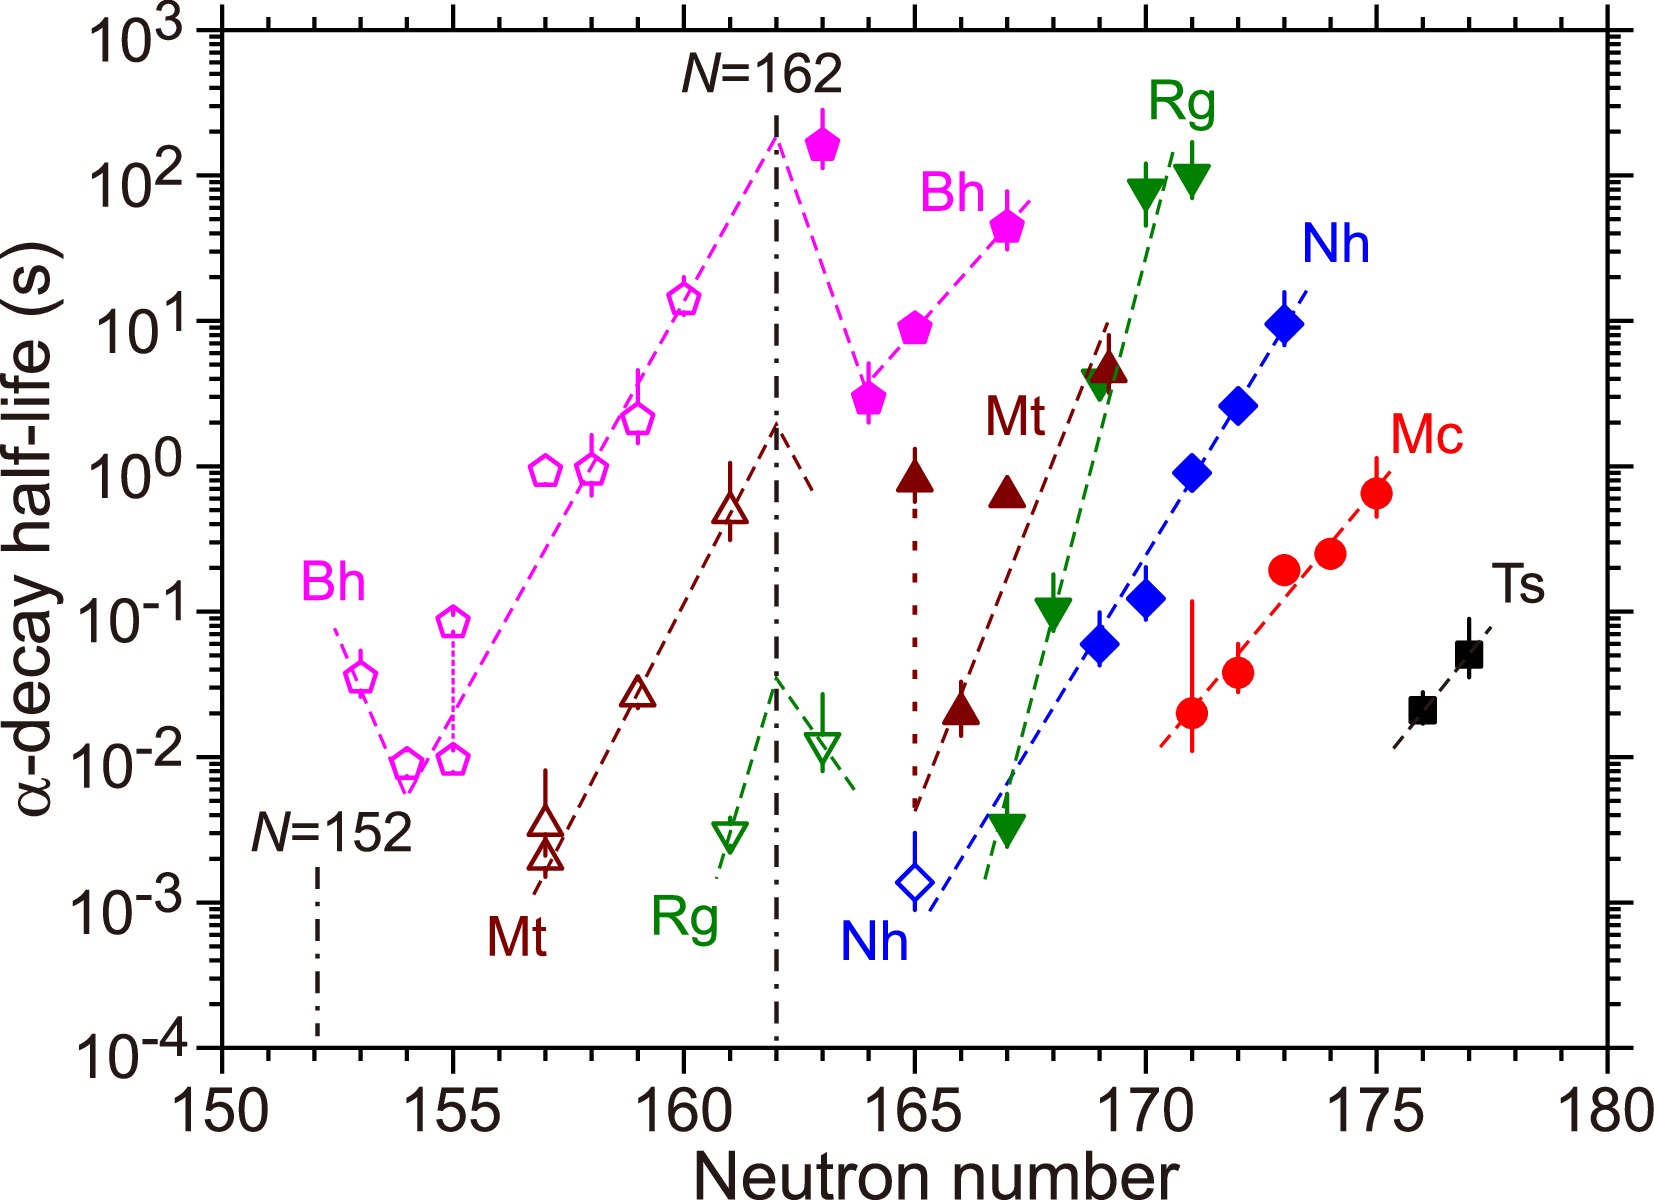
Figure 3. (color online) Partial half-lives Tα vs neutron number N for the isotopes of odd-Z elements Bh–Ts (Refs. [1-6, 16, 18-20]. Full and open symbols refer to nuclei produced in the reactions with 48Ca and other reactions, respectively. The lines are drawn to guide the eye. Vertical dotted brown line shows the deviation of Tα for 274Mt from the systematics.
In addition to 274Mt, among the remaining 37 odd-Z nuclei with Z=107−117, two states with different half-lives are known only for 262Bh and presumably for its precursor 266Mt (see, e.g., Refs. [18, 29−32]). Furthermore, it remains unclear which of the states belongs to the ground one (g.s.) and which is an isomeric (i.s.) state [32].
To extract information about the nuclear structure from our experimental data, we used a cluster model based on a dinuclear system approach. As shown in Refs. [33−38], the cluster model well describes the experimental half-lives of the α decay and SF from the ground and isomeric states of nuclei with even atomic numbers Z. Moreover, new calculations within the cluster model also demonstrate good descriptions of Tα and TSF for odd-Z nuclei (see Table 2).
Nucleus K $ T_{a}^{\rm th} $ /s$ T_{\rm SF}^{\rm th} $ /sTα/s TSF/s 243Am 5/2 4.29 × 10¹¹ 8.06 × 10²² 2.32 × 10¹¹ 6.28 × 10²¹ 249Bk 7/2 7.05 × 10¹² 9.87 × 10¹⁵ 2.06 × 10¹² 6.01 × 10¹⁶ 253Es 7/2 2.36 × 10⁶ 8.88 × 10¹² 1.77 × 10⁶ 2.03 × 10¹³ 256Md 1 8.78 × 10⁴ 3.04 × 10⁵ 5.07 × 10⁴ >1.55 × 10⁵ 267Db 7/2 5.26 × 10⁴ 3.08 × 10³ $\geqslant $ 1.90 × 1044.74 × 103 Table 2. Calculated half-lives of α decay (
$ T_{a}^{\rm th} $ ) and SF ($ T_{\rm SF}^{\rm th} $ ) from the ground state for various odd-Z nuclei in comparison with experimental data (Tα and TSF) [39]. The K value represents the projection of the total nuclear spin along the symmetry axis of the nucleus.Within the cluster model, one can determine the possible K value of a nuclear state using the experimental values of the Qα energy and α decay half-life Tα, as well as the SF half-life TSF. In this regard, we vary the K value so that the calculated
$ T_{a}^{\rm th} $ values and/or$ T_{\rm SF}^{\rm th} $ half-lives become close to the experimental values of Tα and/or TSF, respectively. The same extraction method was used in Ref. [40] for the α-decay chains of 273,275Ds.In some cases, the experimental uncertainties in Tα are large enough to affect the K value. In that case, the corresponding K range can be obtained. All calculated half-lives compared with experimental values, along with the respective K, are presented in Table 3. A decay scheme is also proposed and shown in Fig. 4. Note, that the cluster model cannot provide definite information about the state (ground, isomeric or low-lying ones) of a nucleus.
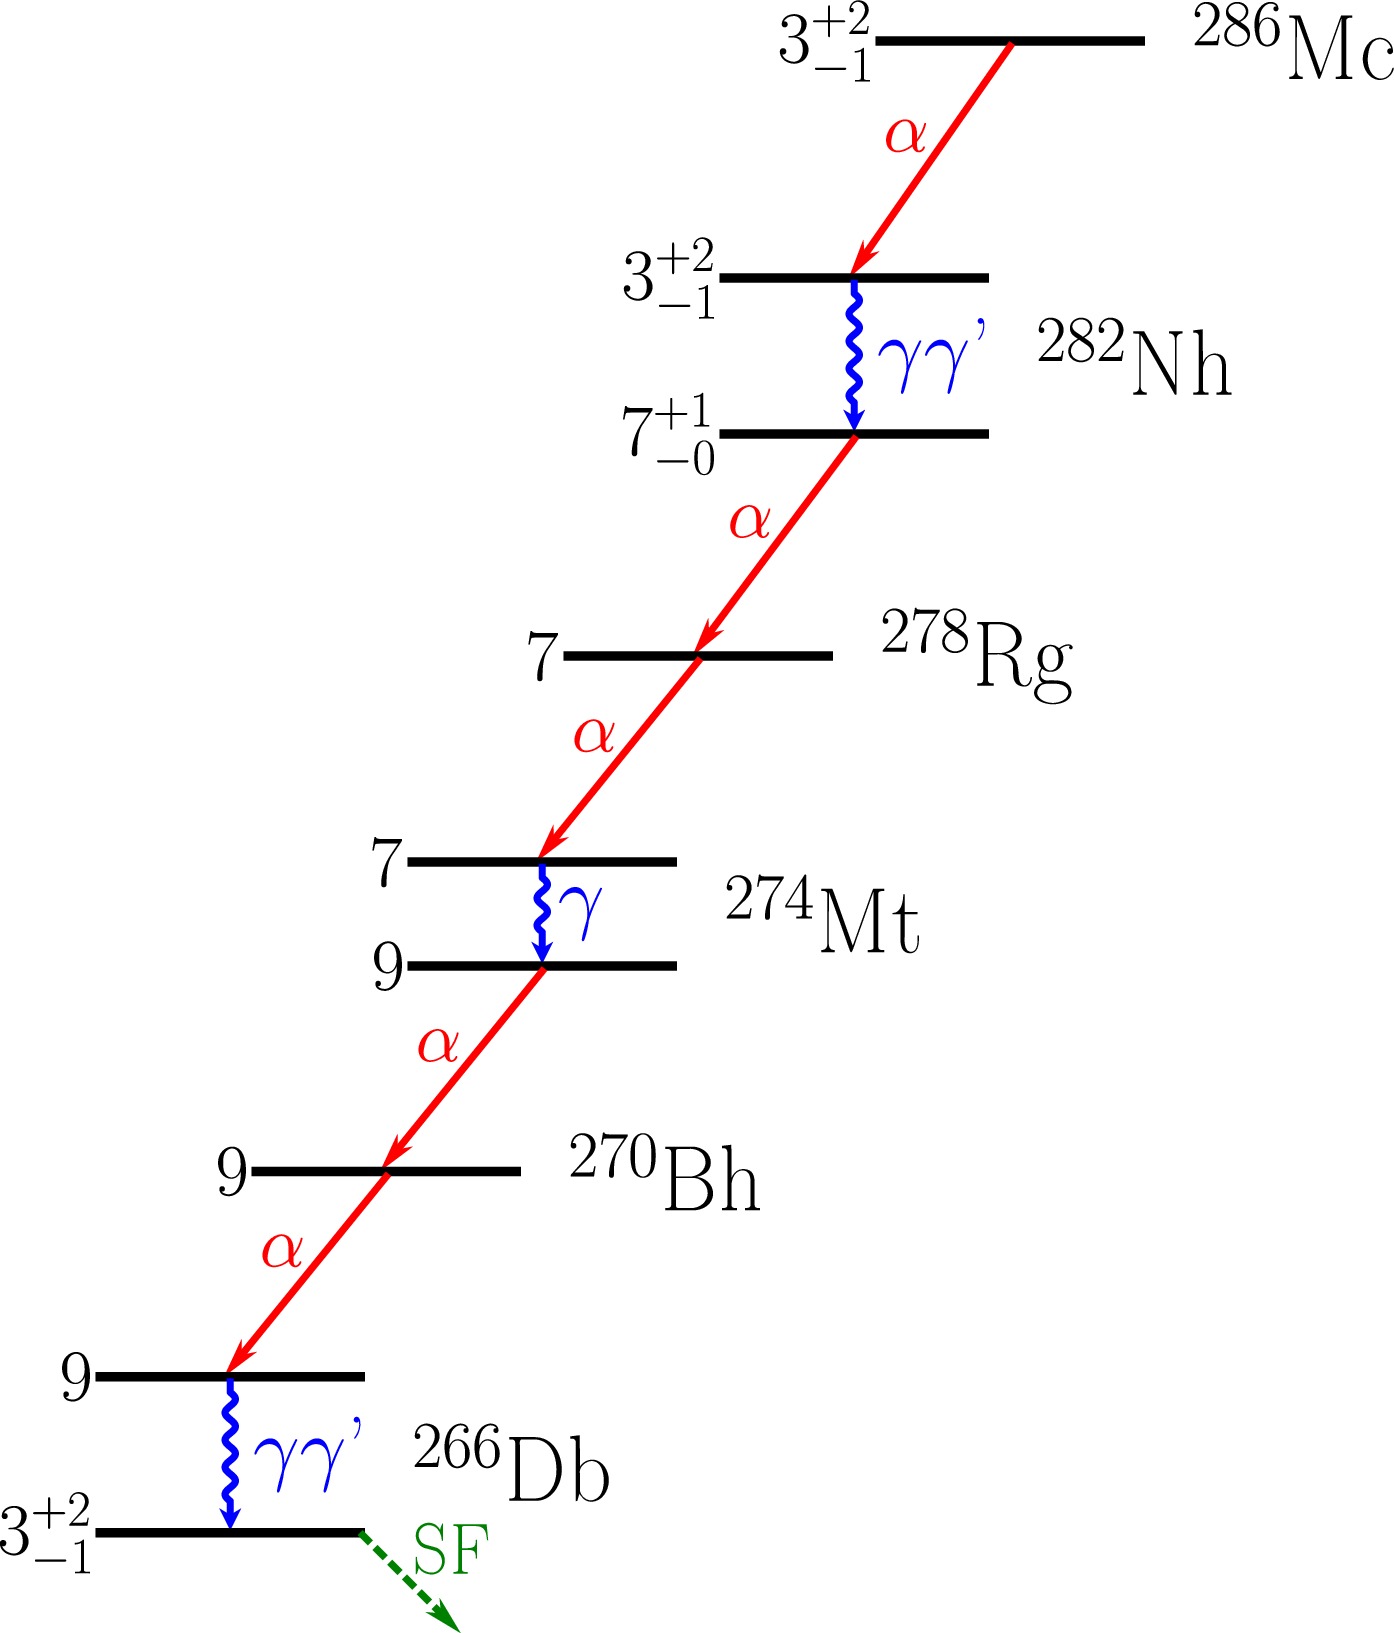
Figure 4. (color online) Possible α-decay scheme for 286Mc. γγ’ represents γ-cascade. Extracted spin values with their corresponding uncertainties are shown. For the nuclei 278Rg, 274Mt, and 270Bh, only one spin value is possible according to the experimental half-life error bars.
Nucleus Decay
modeT1/2/s K $ T_{a}^{\rm th} $ /s$ T_{\rm SF}^{\rm th} $ /s286Mc α $2.0^{+9.8}_{-0.9} $ × 10−2 a3 2.46 × 10⁻² 1.98 × 10⁵ 282Nh α $6.0^{+3.9}_{-1.7} $ × 10−27 5.30 × 10⁻² 2.02 × 101 278Rg α $3.4^{+2.2}_{-1.0} $ × 10−37 3.67 × 10⁻³ 4.63 × 10² 274Mt α $0.80^{+0.52}_{-0.23}$ 9 0.896 6.78 × 10⁵ 270Bh α $ 1.6^{+1.2}_{-0.5}$ × 1029 2.41 × 10² 2.22 × 10⁶ 266Db SF $3.4^{+2.6}_{-1.0} $ × 1023 4.47 × 10⁴ 1.04 × 10² a Value is taken from Ref. [20]. Table 3. Calculated half-lives of α decay and SF and values of K for the nuclei in the α-decay chain of 286Mc.
For the observed decays of 274Mt, with K = 9, which is higher than that of the neighboring nuclei in the isotopic chain, e.g., for 275Mt, the K of around 3/2 is predicted. Therefore, its robustness to α decay is lower. This is the main reason for the “increased” stability of this transition of 274Mt.
The energies of the observed decays of 274Mt are noticeably lower than that obtained from the Qα value predicted in Ref. [21] (Qα = 10.60±0.23 MeV), as shown in Fig. 2. For this Qα value and Tα of a few ms (in particular, 6.7 ms according to calculations), we get K = 7. Thus, we can assume an α transition from the state with K = 7 in 274Mt to the state with K = 7 in 270Bh. This transition was not observed in this and previous [19, 20] experiments, which may be because of insufficient statistics. One may assume that K=9 is the isomeric state for 274Mt and 270Bh, and the ground state in 274Mt will be at K=7. However, in this case, a short decay would be observed in the experiment, as the transition from 278Rg is from the state with K=7. In the case where K=7 lies higher, the transition to a lower-energy state with K=9 is acceptable and probably proceeds quickly enough. Thus, no decay from K=7 is observed in the experiment.
Similarly, we can propose a decay scheme for the isotope 262Bh, for which two states are assumed. The 258Db nucleus is formed as a result of the α decay of 262Bh. As is known, 258Db has a state with an energy of 156.5 keV and a spin range from 4 to 7 [32]. The half-lives obtained from the cluster model show (see Table 4) that the shorter-lived state in 262Bh can be well described as an isomer with an energy of 0.25 MeV and K = 7. Moreover, Qα = 10.41 MeV, which is consistent with the experimental value of Qα for this state (in the range from 10.4 to 10.53 MeV) [41]. Therefore, the longer-lived state of the 262Bh nucleus is assumed to be the ground state. In this case, α decay can occur to the 222 or 358 keV levels [32], leading to Qα = 10.1 or 9.95 MeV, which are consistent with the experimental data (covering the range from 9.8 to 10.22 MeV) [32]. The α-decay scheme of 262Bh is shown in Fig. 5 and Table 4. The higher stability of the ground state of 262Bh is explained by the higher spin K = 9, corresponding to
$ T_{a}^{\rm th} $ = 1.40 × 10⁻¹ s.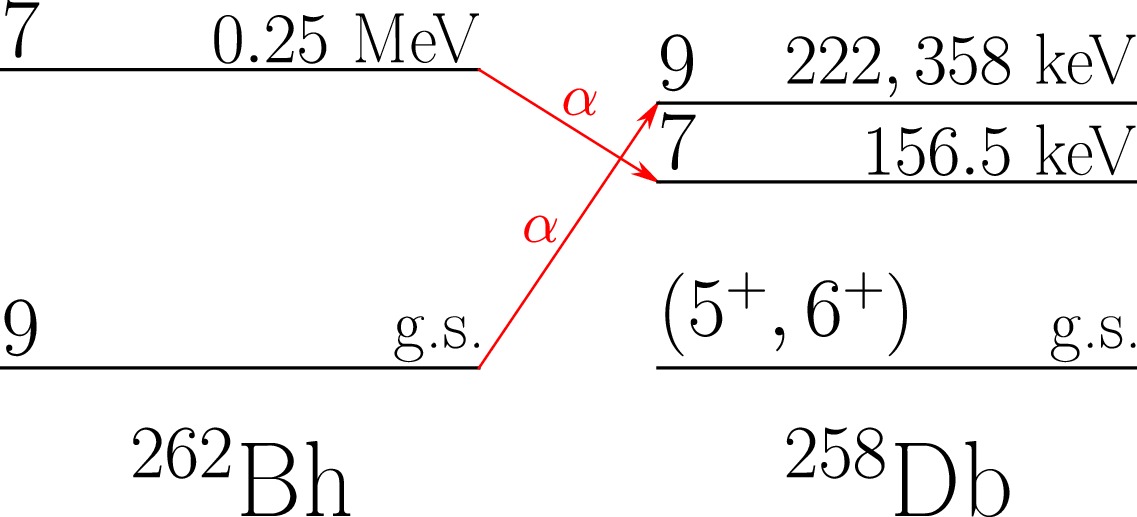
Figure 5. (color online) Possible α-decay scheme for 262Bh.
State Eis/MeV K Tα/s $ T_{a}^{\rm th} $ /s$ T_{\rm SF}^{\rm th} $ /sg.s. − 9 8.80 × 10⁻² 1.40 × 10⁻¹ 3.01 × 10³ i.s. 0.25 7 9.40 × 10⁻³ 6.59 × 10⁻³ 5.43 × 10² Table 4. Calculated half-lives of α decay and SF from g.s. and i.s. of 262Bh. The Eis value is the energy of the isomeric state.
The 237Np+48Ca reaction cross sections, measured in Ref. [19] and this study, are listed in Table 1 and Fig. 6. An increase in E* of the 285Nh CN by 3 MeV led to a decrease in the cross section of the 3n channel by approximately 2 times. Only the upper limit is set for the 4n reaction channel (Table 1). These cross sections are consistent with the predictions [49] made before the experiment [19] (see, e.g., Refs. [5, 6]). In numerous subsequent theoretical studies, the measured cross sections were reproduced well by different authors.
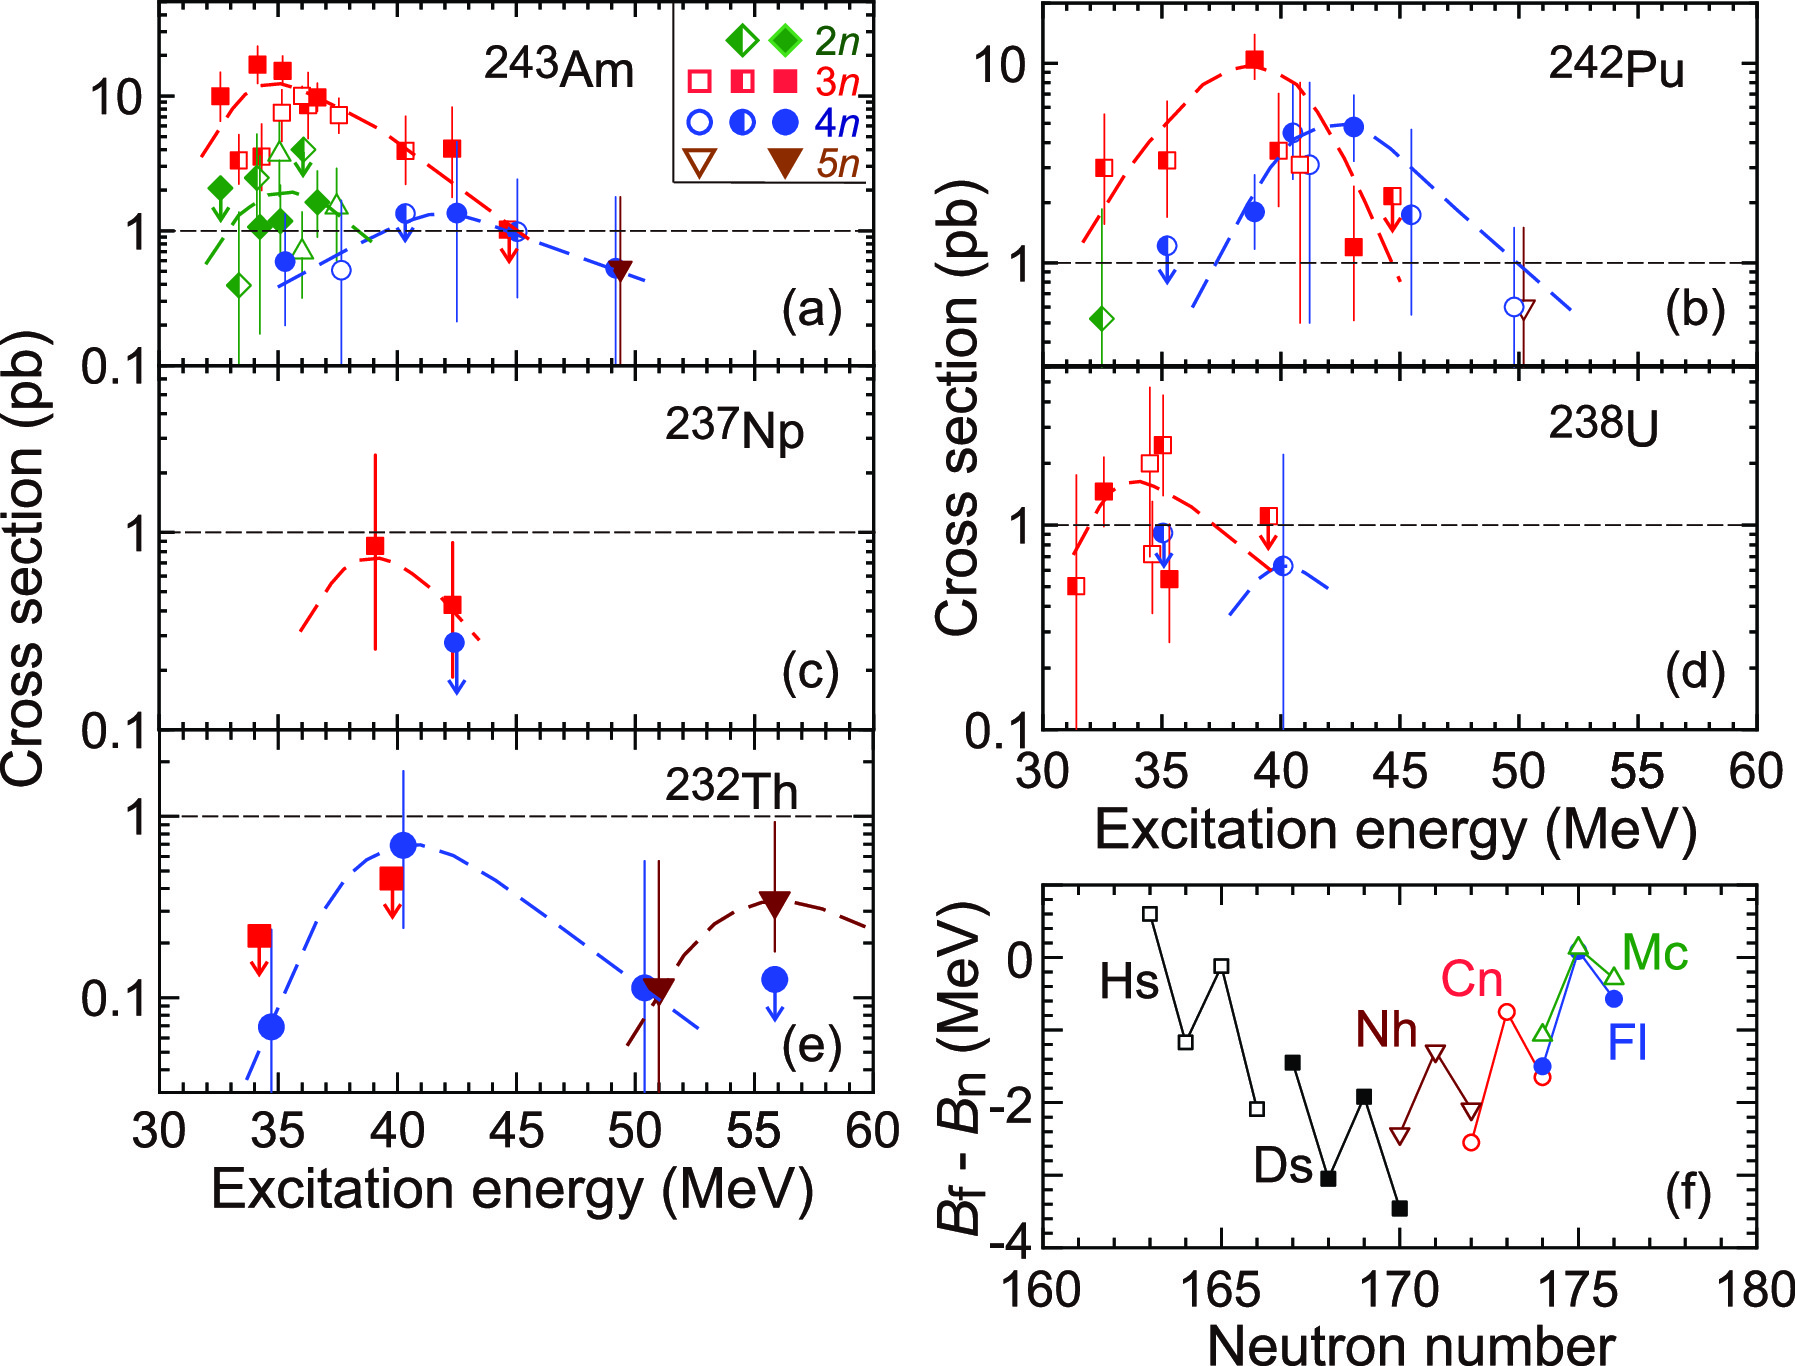
Figure 6. (color online) Cross sections for the 2n- to 5n-evaporation channels for the 243Am (a), 242Pu (b), 237Np (c), 238U (d), and 232Th+48Ca (e) reactions. Vertical error bars correspond to total uncertainties. The symbols with arrows show the upper cross-section limits. The data are represented by open (from Refs. [42−45]), half-closed (from Refs. [46, 47]), and closed symbols (from Refs. [19, 20, 26, 40] and this study). The dashed lines through the data are drawn to guide the eye. Panel (f) shows the difference between the fission barriers Bf and neutron binding energy Bn for the compound nuclei and neutron evaporation products of the 243Am, 242Pu, 237Np, 238U, 232Th, and 226Ra reactions with 48Ca [48].
As can be seen in Fig. 7, the 237Np+48Ca reaction cross section was slightly smaller than the cross sections for the nuclei of the neighboring elements Cn and Fl. The reason for this may be the lower number of neutrons in 237Np than those in 238U and 242.244Pu. Thus, the reaction with 237Np leads to a more neutron-deficient compound nucleus 285Nh, which is farther from the influence of the magical neutron shell at N=184. As a result, there is a smaller difference (Bf-Bn), which determines the survival probability of CN in the process of deexcitation, as shown in Fig. 6(f). The cross sections for the elements Hs-Og (the maximum total cross section of the xn-channels), shown in Fig. 7, were obtained from the fusion-evaporation reactions of 226Ra, 232Th, 238U, 237Np, 242,244Pu, 243Am, 245,248Cm, 249Bk, and 249Cf with 48Ca projectiles, which led to the synthesis of isotopes with Z=108, 110, and 112−118.
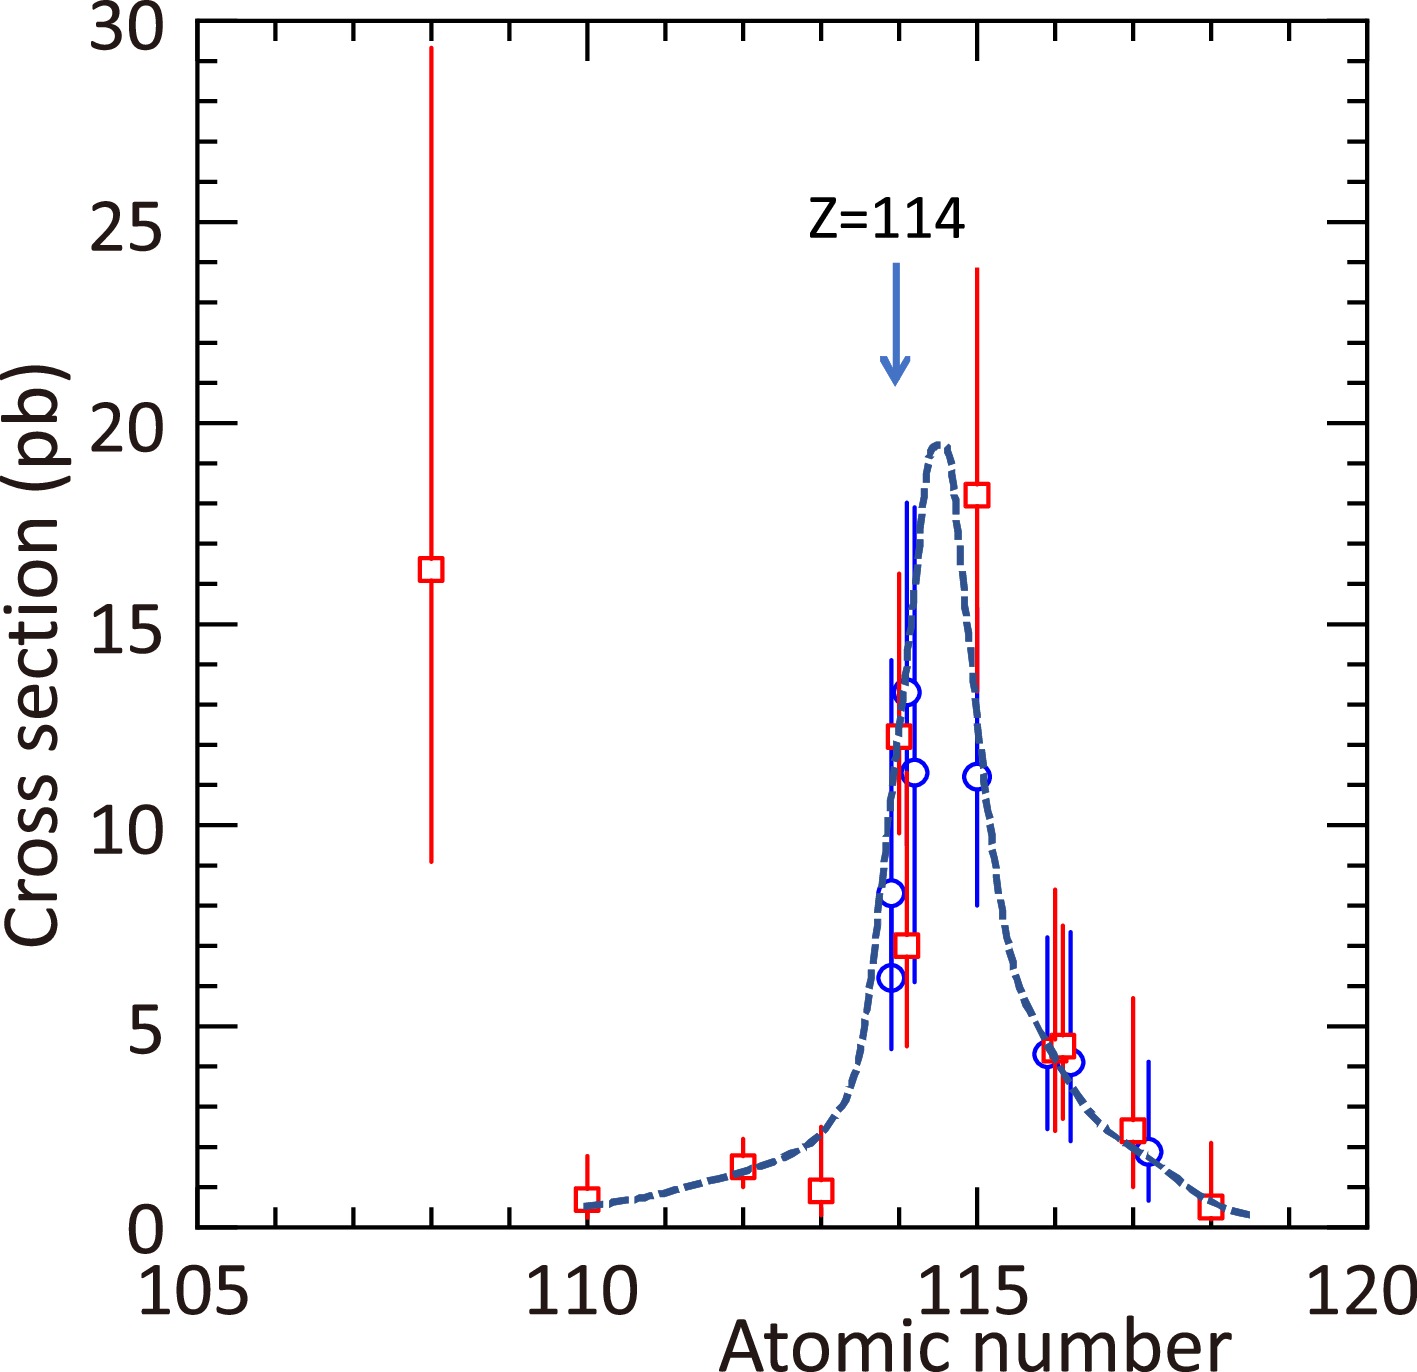
Figure 7. (color online) Maximum production cross sections for the isotopes of heavy elements in the 48Ca-induced reactions with 226Ra, 232Th, 238U, 242,244Pu, 243Am, 245,248Cm, 249Bk, and 249Cf. Data measured at DGFRS and DGFRS-2 are shown by red squares [5, 6, 19, 20, 26, 40, 46, 47, 50], whereas the results obtained at SHIP, BGS, TASCA, and GARIS are shown by blue circles [15, 41, 45, 51-53]. The dashed line through the data is drawn to guide the eye.
Cross-section variations, seen in Fig. 7, depend on both the properties of the interacting nuclei and the CN resulting from their complete fusion. These features of the nuclei determine the capture of interacting nuclei, formation of an almost spherical CN, and its survival during deexcitation. According to the theory (see e.g., Refs. [54−56] and recent papers [57−60]), the drop in the 48Ca-induced complete-fusion reaction cross sections, caused by the survivability of CN during deexcitation, are by orders of magnitude higher than the drop owing to the formation probability of compound nuclei. Thus, the changes in the reaction cross sections are largely determined by the survival of CN, which, in turn, depends on their fission barriers. As can be seen in Fig. 7, the dependence of the cross sections on the atomic number of CN is a rather narrow function. A deviation from the presumed magic number Z=114 by 1−2 units leads to noticeable drops in the cross sections. This fact may indicate the magical value of Z = 114. The increase in the reaction cross section for Hs, produced in the 226Ra+48Ca reaction, may also be due to the influence of the shells at Z = 108 and N = 162.
-
The objective of this study was to measure the decay properties of the daughter products of the 243Am + 54Cr reaction, which can be used for the synthesis of element 119. The 237Np+48Ca reaction has been studied using the gas-filled separator DGFRS-2 at the SHE Factory (FLNR, JINR). We obtained three chains of consecutive α decays of 282Nh, 278Rg, 274Mt, and 270Bh, which stopped by the SF of 266Db. The results of this experiment are consistent with our previous data [19, 20]. The half-lives of 282Nh, 278Rg, and 270Bh are consistent with the values that can be expected for them based on the systematics of the experimental properties of odd-Z nuclei. However, the half-life of 274Mt is two orders of magnitude longer than expected. Such a large difference has been observed for the first time for the heaviest nuclei.
The decay schemes for some heavy odd-Z nuclei were extracted by using the experimental Qα and Tα values and the cluster model based on the dinuclear system approach. As it follows from the model, the observation of a lower Eα value for 274Mt, when compared with the predictions [21], and longer decay times than those expected from systematics (Fig. 3), may be owing to the decays of 274Mt and 270Bh into i.s. with K=9. The transition to g.s. from K=7 to the state with K=9 may occur owing to a rapid γ decay, as a result of which the decay from the state with K=7 was not observed.
The measured cross section of
$0.43^{+0.46}_{-0.25}$ pb at E* = 42 MeV is consistent with the behavior of the excitation functions for the 3n channel in the 48Ca-induced reactions. An increase in E* of the 285Nh CN by 3 MeV when compared with the observation in Ref. [19] at E* = 39 MeV led to a decrease in the cross section of the 3n channel by approximately 2 times.The upper cross-section limit of the 4n reaction channel was 0.28 pb. The decay chain of the unknown isotope 281Nh has not been detected, although the decay properties of the odd-even isotopes 281Nh, 277Rg, 273Mt, and 269Bh are of great interest. The isotope 277Rg (N = 166) may be the least stable of all odd-Z heavy nuclei (see Fig. 3), as the Rg isotopes have the largest drop in T1/2 with decreasing N. The half-life of 273Mt (N = 164) may correspond to the T1/2 trend for the isotopes of Mt and reach approximately 1 ms if its decay is not hindered to the extent as in the case of 274Mt. Isotope 269Bh (N=162) may be the first of the isotopes of odd-Z elements with a magic number N = 162. However, the small reaction cross section may cause a serious challenge for future research.
The previously observed lower cross section for Nh than those for the isotopes of neighboring elements Cn and Fl (Fig. 7) may be owing to the relatively small number of neutrons in 237Np and CN, respectively (Fig. 6). This should lead to a decrease in the fission barriers of CN when moving away from the magic neutron number N = 184 and a decrease in the survival probability of CN.
Investigation of the 237Np(48Ca, xn)285-xNh reaction: Long-lived state in 274Mt
- Received Date: 2026-07-21
- Available Online: 2027-01-15
Abstract: The 237Np+48Ca reaction was studied using the gas-filled separator DGFRS-2 of the SHE Factory at the Flerov Laboratory of Nuclear Reactions, Joint Institute for Nuclear Research. We observed three α-decay chains of 282Nh and its descendant nuclei 278Rg, 274Mt, and 270Bh terminated by the spontaneous fission of 266Db. The half-life Tα of the isotopes 282Nh, 278Rg, and 270Bh correspond to the values expected from the experimental systematics for the odd-Z nuclei; however, Tα for 274Mt exceeds this value by two orders of magnitude. These results are in agreement with those previously measured by Oganessian et al. [Phys. Rev. C 76, 011601(R) (2007); Phys. Rev. C 106, 064306 (2022)]. Such a significant difference in the measured Tα for 274Mt is observed for the first time for the heaviest nuclei with Z ≥ 107. The decay properties of a few heavy odd-Z nuclei are compared with the predictions of a cluster model based on a dinuclear system approach, and their corresponding decay schemes are proposed. The reaction cross section is measured to be $0.43^{+0.46}_{-0.25} $ pb, which is consistent with the expectation for the excitation functions of the 3n channel in 48Ca-induced reactions. The upper cross-section limit of the 4n reaction channel is 0.28 pb.



 DownLoad: