


 Abstract
 HTML
 Reference
 Related
 PDF



-
The hierarchy problem—the vast disparity between the electroweak scale
$ M_{{\rm{EW}}} \sim 10^{2} $ GeV and the Planck scale$ M_{{\rm{Pl}}} \sim 10^{19} $ GeV—remains one of the central open questions of contemporary fundamental physics. Among the theoretical scenarios proposed to address this hierarchy problem, the model with large extra spatial dimensions introduced by Arkani-Hamed, Dimopoulos and Dvali (ADD) [1, 2, 3] provides a particularly striking resolution: the apparent weakness of four-dimensional gravity is interpreted as a dilution effect, with the true fundamental scale of gravity$ M_D $ lowered to the TeV range by the presence of n compactified extra dimensions in which only the graviton propagates.In the ADD framework, the four-dimensional Planck mass is related to the higher-dimensional fundamental scale via the geometric relation
$ M_{{\rm{Pl}}}^{2} \sim M_D^{\,n+2} R^{n}, $
(1) where R is the compactification radius. For
$ M_D $ of order 1 TeV, the required values of R range from sub-millimetre ($ n=2 $ ) to femtometre ($ n=6 $ ). The$ n=2 $ and$ n=3 $ cases are strongly constrained by sub-millimetre gravity tests [4, 5] and, under additional assumptions about the bulk, by astrophysical bounds [6]; collider searches provide a complementary, model-independent probe. The compactification of the extra spatial dimensions induces a Kaluza–Klein (KK) tower of massive graviton modes that can be produced in high-energy proton–proton collisions and, by escaping into the higher-dimensional bulk, manifest experimentally as missing transverse momentum.At hadron colliders, the most distinctive signature of KK graviton production is the monojet plus missing transverse momentum final state, in which an initial-state radiation jet recoils against an undetected graviton. This channel has been extensively explored at the LHC by both ATLAS and CMS, leading to progressively stronger constraints on
$ M_D $ [7, 8, 9, 10, 11]. The most recent Run-2 analysis by ATLAS, based on 139 fb−1 of integrated luminosity at$ \sqrt{s}=13 $ TeV, has excluded values of$ M_D $ below 11.2 TeV at the 95% confidence level for$ n=2 $ and below 5.9 TeV for$ n=6 $ [9].Future collider programmes envisage significantly more powerful hadron colliders. The High-Luminosity upgrade of the LHC (HL-LHC) will deliver 3 ab−1 at
$ \sqrt{s}=14 $ TeV, representing more than a twentyfold increase in integrated luminosity over the current Run-2 dataset [12]. Beyond the HL-LHC era, the proposed High-Energy LHC (HE-LHC) would utilise the existing LHC tunnel with new high-field magnets to reach$ \sqrt{s}=27 $ TeV and 15 ab−1 [13], while the Future Circular Collider in hadron-hadron mode (FCC-hh) would constitute an entirely new 100 km facility delivering$ \sqrt{s}=100 $ TeV and 30 ab−1 [14, 15]. Each successive stage extends the kinematic reach to substantially higher mass scales and opens new windows on physics beyond the Standard Model.In this work, we present, to our knowledge, the first unified projection of the ADD reach in the monojet plus missing transverse momentum channel across all three future collider stages within a single, internally consistent framework. Two features distinguish our analysis.
The first concerns the background. In place of generator-level multi-process simulation, we use the post-fit Standard-Model yields released by ATLAS and CMS on
$\mathrm{HEPData}$ , so that experimentally constrained backgrounds enter the projection directly.The second concerns the normalisation. The analysis is tied to the published ATLAS Run-2 results through a transparent, n-dependent calibration scheme, which provides a data-driven bridge between our parton-shower-level framework and the full detector simulation of the experimental analyses. The scheme is general and intended to be reusable in other future-collider phenomenology studies. Its selection-level response is checked independently against the published ATLAS signal cutflow [16], which the framework reproduces across the full
$ E_{{\rm{T}}}^{{\rm{miss}}} $ range.The paper is organised as follows. Section 2 reviews the relevant features of the ADD model and the parametrisation adopted in this study. Section 3 summarises the experimental context and the published Run-2 limits that serve as our calibration anchor. Section 4 describes the signal generation, event selection, background estimation, significance computation, and the n-dependent calibration scheme. Section 5 presents the projected reach in
$ M_D $ for$ n \in \{2,3,4,6\} $ at each collider stage and discusses the systematic uncertainties. Section 6 summarises the conclusions and provides an outlook. -
The ADD model postulates that the Standard Model fields are confined to a four-dimensional brane embedded in a
$ (4+n) $ -dimensional spacetime, while the graviton propagates in the full bulk geometry. Compactifying the n extra spatial dimensions on a torus of radius R yields a tower of massive Kaluza–Klein (KK) graviton modes, each labeled by an n-component integer vector$ \vec{k}=(k_1,\ldots,k_n) $ with mass$ m_{\vec{k}}=|\vec{k}|/R $ . The density of states grows as$ \rho(m)\propto m^{n-1} $ [17, 18]; consequently, summing over the tower yields an effectively continuous spectrum at the energy scales probed by hadron colliders.For monojet production, the relevant partonic processes are
$ gg \to G+g $ ,$ qg \to G+q $ , and$ q\bar{q} \to G+g $ , where G denotes a KK graviton summed over the tower. The total inclusive cross section for graviton production with associated jet emission approximately scales as [17, 19]$ \sigma_S \propto \frac{1}{ M_D^{\,n+2}}, $
(2) reflecting the suppression due to the higher-dimensional Planck scale combined with the phase-space factor associated with the KK density of states. Because the graviton escapes undetected, the experimental signature is that of an energetic jet recoiling against missing transverse momentum, with the
$ E_{{\rm{T}}}^{{\rm{miss}}} $ distribution extending to significantly higher values than those for Standard Model backgrounds.We adopt the convention of Giudice, Rattazzi and Wells (GRW) [18] for the parametrisation of the KK graviton tower. Two model parameters fully specify the signal: the fundamental scale
$ M_D $ and the number of extra dimensions n. The effective description of KK graviton emission breaks down once the partonic centre-of-mass energy approaches the fundamental scale,$ \hat{s}\sim M_D^{2} $ , where the truncated tower is no longer a controlled expansion. The treatment of that region is a prescription rather than a prediction, and a prescription must therefore be chosen. We employ the kinematic truncation in which contributions with$ \hat{s}> M_D^{2} $ are suppressed by the weight$ (M_D^{2}/\hat{s})^{2} $ applied to the contributing$ \hat{s} $ region. This truncation is implemented in$\text{P}{\small{\text{YTHIA}}}$ 8 as$\mathrm{CutOffMode = 1}$ [18, 20], and ATLAS also employs this suppression as a validity cross-check of its nominal limits [9]. This prescription is applied to all future-collider projection samples. The 13 TeV calibration anchors are instead generated with the nominal untruncated signal, to match the signal definition underlying the published ATLAS limits to which the framework is anchored (Sec. 4.5).The kinematic shape of the signal depends strongly on the number of extra dimensions. For small n (
$ n=2 $ ), the cross section falls relatively slowly with the graviton mass, leading to an$ E_{{\rm{T}}}^{{\rm{miss}}} $ distribution that retains a substantial yield at low to intermediate values. For large n ($ n=6 $ ), the effective density of high-mass graviton states is enhanced, hardening the$ E_{{\rm{T}}}^{{\rm{miss}}} $ tail. This n-dependence of the signal shape has important consequences for the analysis strategy and motivates the use of the full$ E_{{\rm{T}}}^{{\rm{miss}}} $ shape rather than a fixed$ E_{{\rm{T}}}^{{\rm{miss}}} $ threshold. -
The monojet plus missing transverse momentum channel has been the subject of dedicated searches at both ATLAS and CMS throughout LHC operation. The most recent published results, based on the full Run-2 dataset, are reported in Ref. [9] (ATLAS, 139 fb−1) and Ref. [10] (CMS, 137 fb−1). Both analyses find no significant excess over Standard Model expectations and set 95% CL exclusion limits on
$ M_D $ as a function of n.The observed 95% CL lower limits on
$ M_D $ from the ATLAS Run-2 analysis are$ \{11.2, \ 8.5, \ 7.1, \ 5.9\} $ TeV for$ n=\{2,3,4,6\} $ , respectively, as reported in Table 10 of Ref. [9] (the corresponding expected limits are$ \{11.6, \ 8.6, \ 7.2, \ 5.9\} $ TeV). The corresponding CMS limit for$ n=2 $ is approximately 10.7 TeV [10], consistent with the ATLAS value given the analysis-specific choices of selection and statistical treatment. The post-fit background yields, broken down by inclusive$ E_{{\rm{T}}}^{{\rm{miss}}} $ regions, are publicly available on$\mathrm{HEPData}$ [16, 21], together with full breakdowns of their systematic uncertainties. These data form the experimental anchor of the present study.A particularly valuable element of the ATLAS
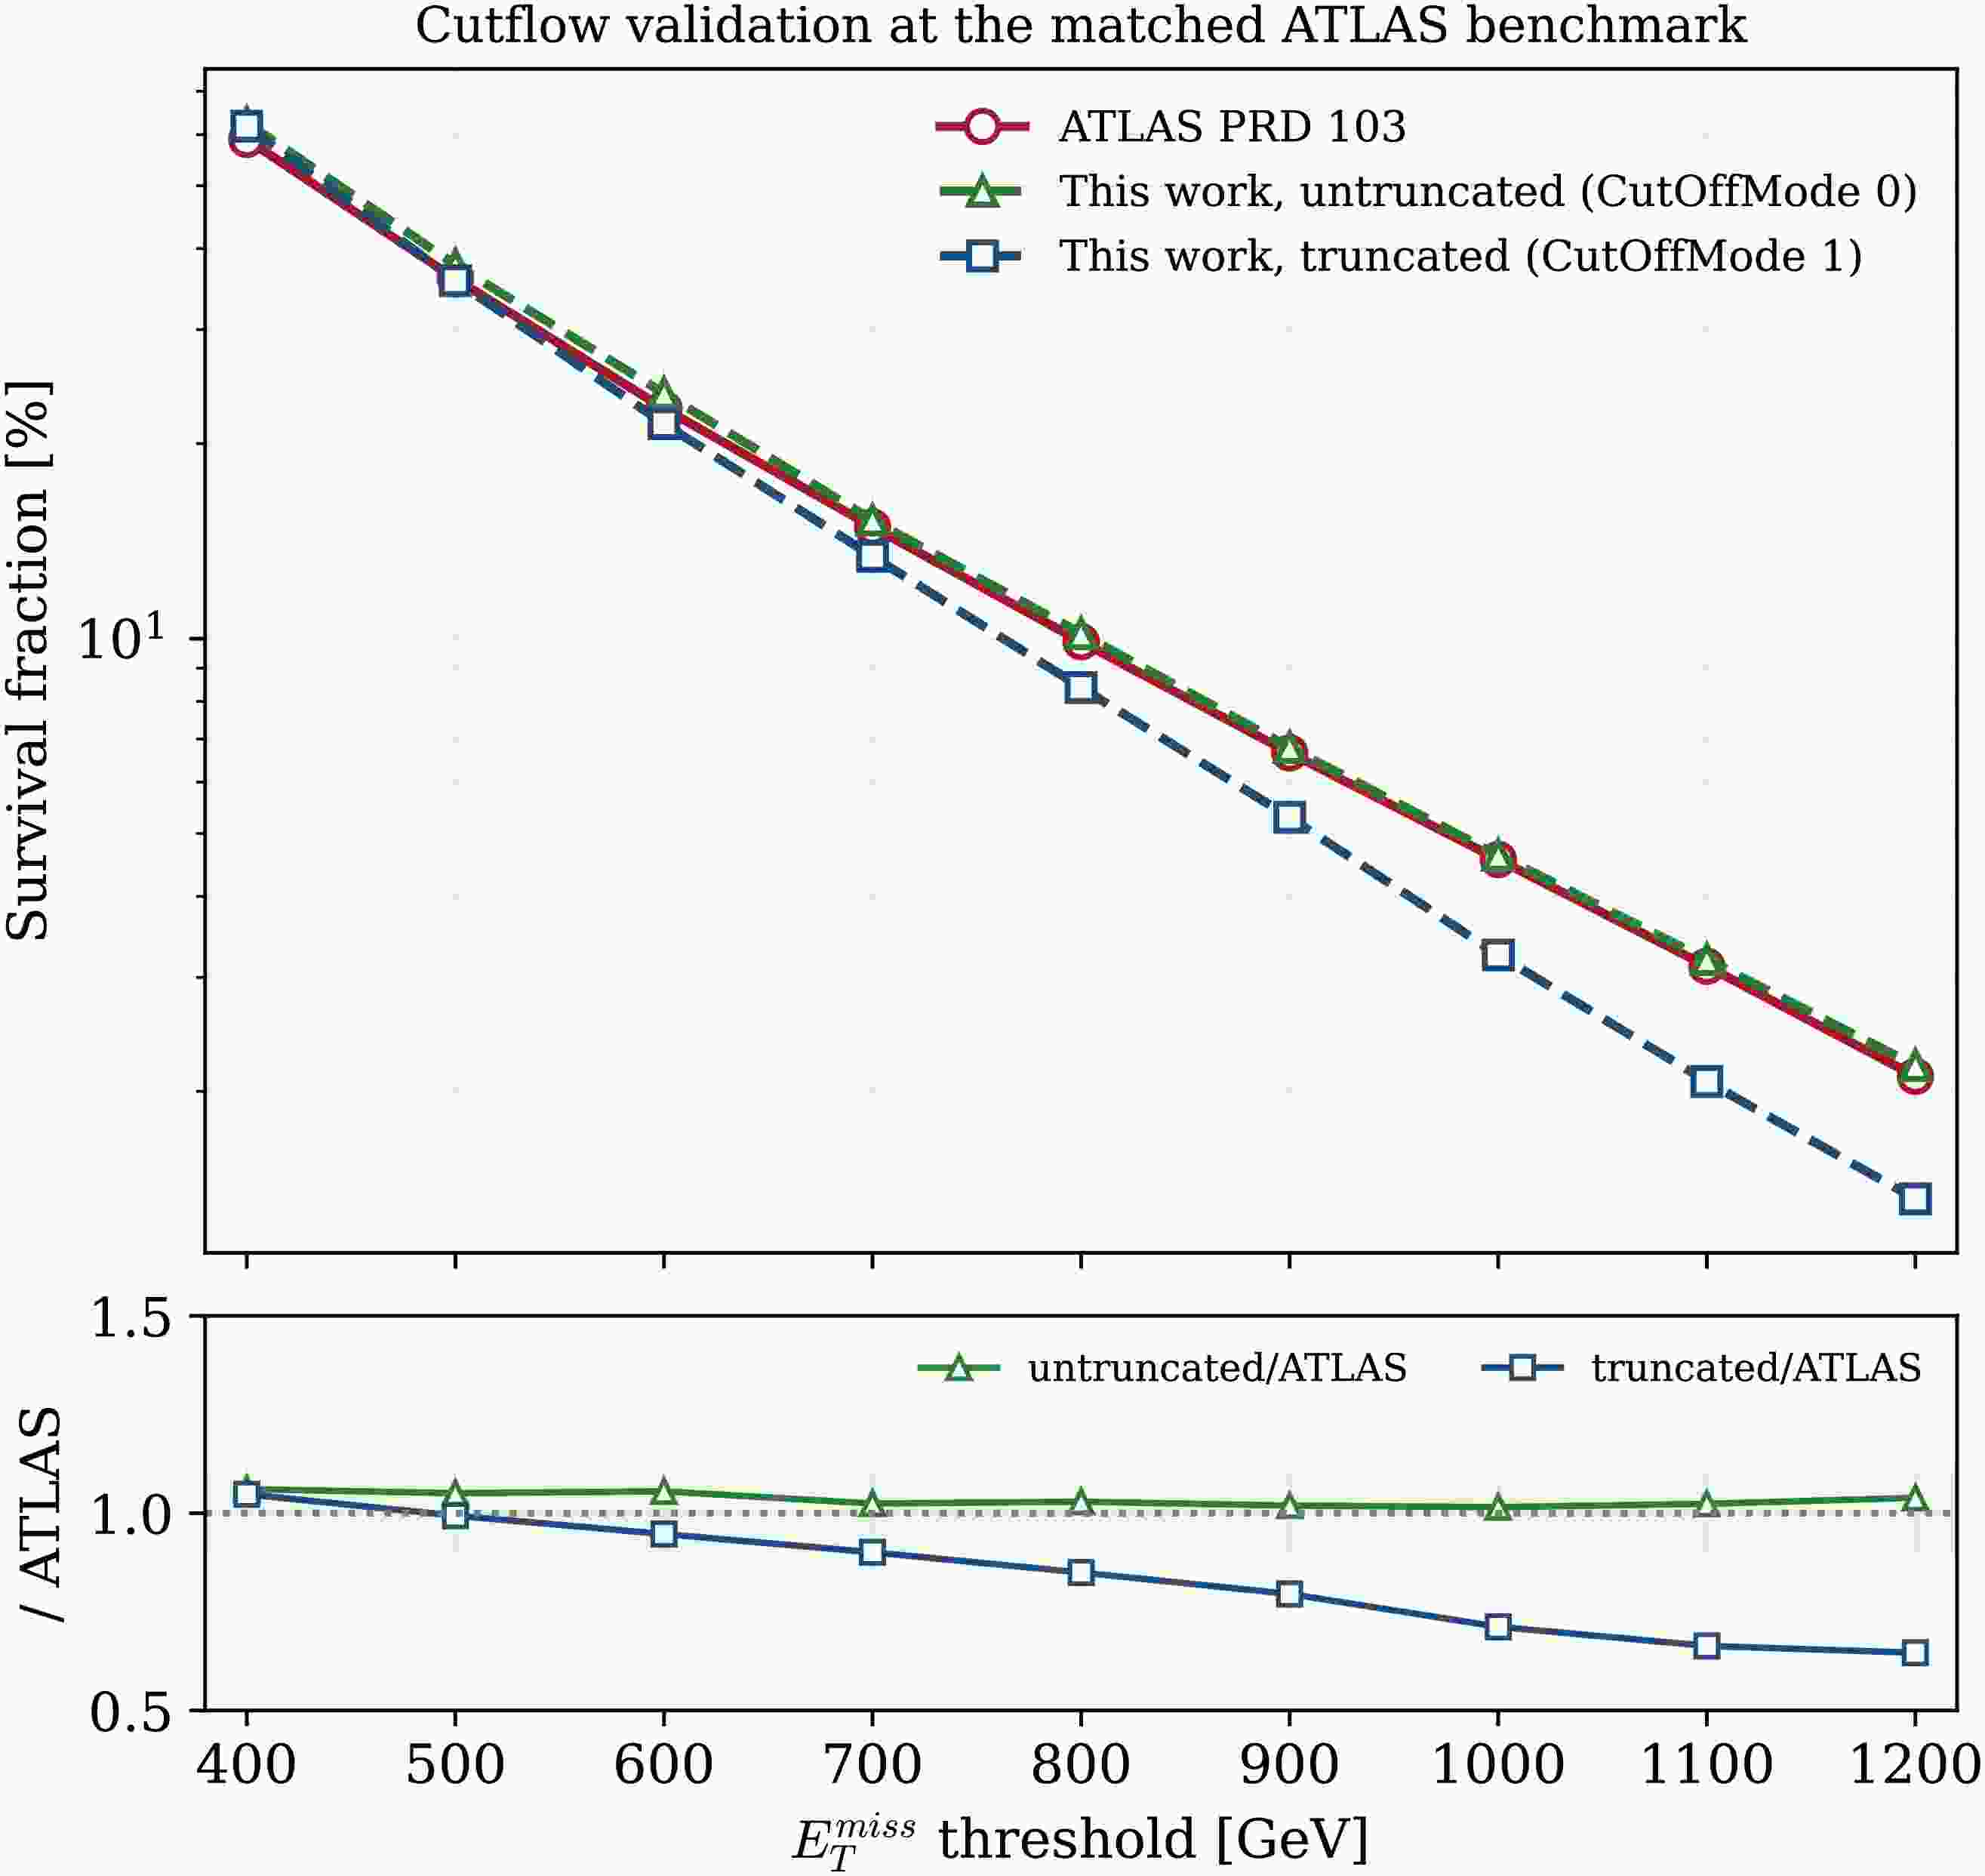
$\mathrm{HEPData}$ record is the cutflow table for selected signal benchmarks, which reports the acceptance times efficiency at each step of the analysis selection for representative model points. For the ADD signal, the cutflow is published for$ n=4 $ ,$ M_D=3.6 $ TeV with a truth-level$ E_{{\rm{T}}}^{{\rm{miss}}}>350 $ GeV filter applied [16]. This cutflow provides a numerical reference against which the present parton-shower-level analysis is cross-checked at the shape level (Sec. 4.2 and Fig. 3).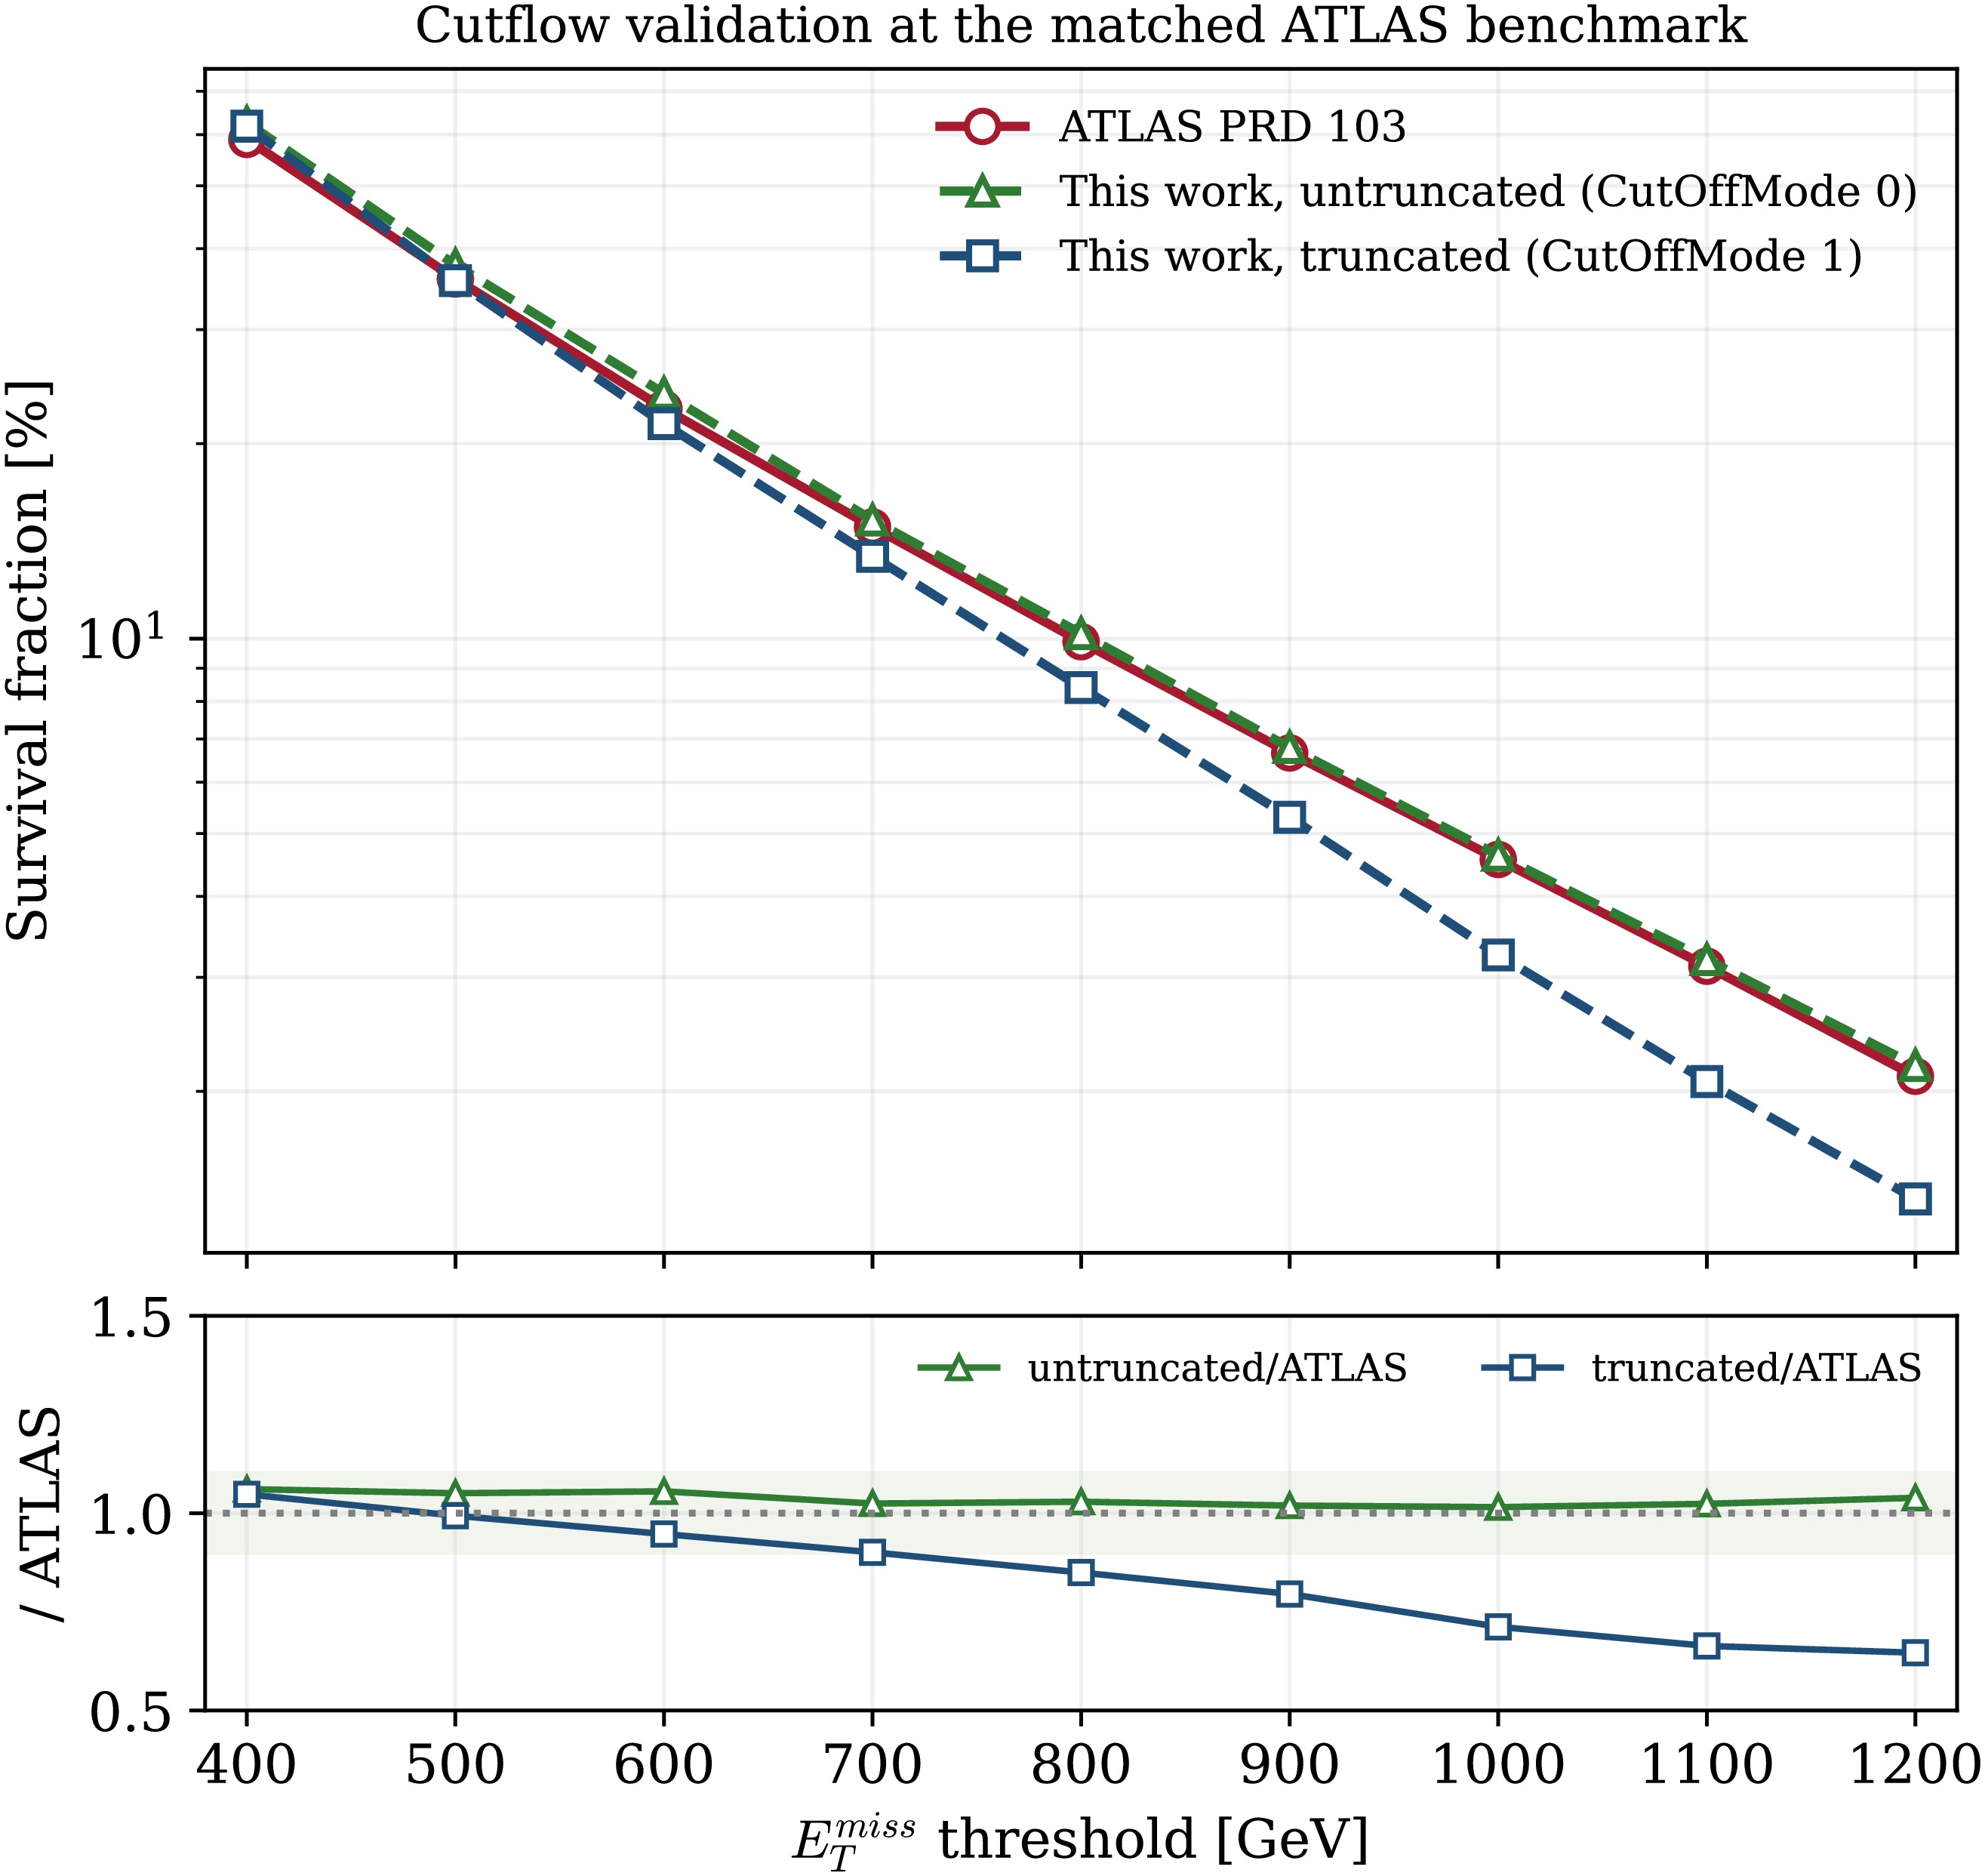
Figure 3. (color online) Cutflow validation for the matched ATLAS ADD benchmark (
$ n=4 $ ,$ M_D=3.6 $ TeV,$ \sqrt{s}=13 $ TeV; truth-level$ E_{{\rm{T}}}^{{\rm{miss}}}>350 $ GeV baseline). Upper panel: fraction of events that survive each inclusive$ E_{{\rm{T}}}^{{\rm{miss}}} $ threshold after the full ATLAS-style selection: the published ATLAS cutflow (PRD 103; red circles) [16], this work using the untruncated signal ($\mathrm{CutOffMode = 0}$ , green triangles), and this work using the truncated signal ($\mathrm{CutOffMode = 1}$ , blue squares). Lower panel: ratio to the ATLAS result. Because it matches the acceptance definition used by ATLAS, the untruncated signal reproduces the published shape with a flat ratio of 1.02–1.06; the truncated signal decreases more steeply, illustrating the UV-prescription effect at this low-$ M_D $ benchmark. -
This study projects the sensitivity to the ADD model in the monojet plus missing transverse momentum channel at three future hadron colliders. The strategy is to generate signal samples at the parton-shower level with
$\text{P}{\small{\text{YTHIA}}}$ 8, apply selection criteria modelled on the published ATLAS and CMS Run-2 analyses, and combine them with the post-fit background yields released by the collaborations on$\mathrm{HEPData}$ . The expected significance at each$ (\sqrt{s},n, M_D) $ point is obtained by combining the thirteen exclusive$ E_{{\rm{T}}}^{{\rm{miss}}} $ bins of the signal region, which match the binning of the ATLAS likelihood fit [9]. The setup is calibrated to the published Run-2 expected 95% CL exclusion limits through an n-dependent factor that absorbs residual differences between our parton-shower-level framework and the full detector simulation used in the experimental analyses. The selection-level response of the setup is independently validated against the published ATLAS cutflow (Fig. 3). -
ADD signal samples are generated using
$\text{P}{\small{\text{YTHIA}}}$ 8 (version 8.317) [22, 23], which implements the real-emission graviton-production processes$ gg \to G+g $ ,$ qg \to G+q $ , and$ q\bar{q} \to G+g $ as described by Ask et al. [20]. The Kaluza–Klein graviton tower is treated in the GRW convention [18], with the fundamental scale$ M_D $ and the number of extra dimensions n as the only model parameters. We employ the kinematic-truncation prescription ($\mathrm{CutOffMode = 1}$ ).We scan a grid of
$ n \in \{2,3,4,6\} $ at three centre-of-mass energies:● HL-LHC:
$ \sqrt{s}=14 $ TeV,$ M_D \in \{6,8,10,12\} $ TeV, extended to$ M_D=14 $ TeV for$ n=2 $ ; for$ n=6 $ , the grid is further extended down to$ M_D=4 $ TeV (with points at$ M_D=4 $ and 5 TeV) to bracket the$ 5\sigma $ discovery crossing;● HE-LHC:
$ \sqrt{s}=27 $ TeV, with$ M_D \in \{6,8,10,12,14, 16,18,20\} $ TeV;● FCC-hh:
$ \sqrt{s}=100 $ TeV,$ M_D \in \{6,8,10,12,16,20, 25,30,35\} $ TeV, extended to$ M_D=40 $ TeV for$ n=2 $ , so that the constant-factor comparison in Sec. 5.3 is also bracketed.For each
$ (\sqrt{s},n, M_D) $ point, between$ 1\times10^{5} $ and$ 1\times10^{6} $ events are generated. The lower event count,$ 1\times10^{5} $ , is used only for the high-$ M_D $ extension points at$ \sqrt{s}=100 $ TeV, where the high acceptance of the hard$ E_{{\rm{T}}}^{{\rm{miss}}} $ spectrum makes this count statistically sufficient; the resulting selected-event statistics are quantified in Sec. 5.2. The full event chain — parton showering, multiparton interactions and hadronisation — is run with the default$\text{P}{\small{\text{YTHIA}}}$ 8 settings, as detailed below. We adopt the leading-order cross sections returned by$\text{P}{\small{\text{YTHIA}}}$ 8 directly, without an additional K-factor. As discussed in Sec. 4.5, the residual normalisation difference with respect to the full ATLAS analysis is absorbed into the data-driven calibration factor. The ADD limits published by that analysis are themselves quoted for nominal signal cross sections, whose perturbative order is stated ambiguously in Ref. [9]; see Sec. 4.5.Detector response is approximated by a custom parameterised resolution smearing developed for this work; no
$\text{D}{\small{\text{ELPHES}}}$ or$\text{M}{\small{\text{ad}}}\text{A}{\small{\text{NALYSIS}}}$ layer is used. The parameters follow the ATLAS Run-2 performance. The jet$ p_{{\rm{T}}} $ is smeared with$ \sigma/p_{{\rm{T}}}=\sqrt{(0.50/\sqrt{E})^{2}+(0.03)^{2}} $ , where E is the jet energy in GeV, and the resulting relative resolution is applied multiplicatively to the jet$ p_{{\rm{T}}} $ [24]. The missing transverse momentum is smeared with$ \sigma(E_{{\rm{T}}}^{{\rm{miss}}})=0.45\sqrt{\Sigma E_{{\rm{T}}}}+5 $ GeV, where$ \Sigma E_{{\rm{T}}} $ (in GeV) is the scalar sum of the transverse momenta of all visible final-state particles [25]. This smearing is applied independently to the x and y components of the missing-momentum vector, whose magnitude is then recomputed. Lepton candidates are counted using kinematic identification thresholds ($ p_{{\rm{T}}} $ and$ |\eta| $ ) matching those of the corresponding experimental analyses; no cone-based isolation is applied at generator level, and the treatment of τ leptons is described below.For reproducibility, we record the generation details: all samples are produced with
$\text{P}{\small{\text{YTHIA}}}$ 8 (version 8.317) using the Monash 2013 tune ($\mathrm{Tune:pp = 14}$ ) and the NNPDF2.3 QCD+QED LO parton distribution set ($\mathrm{PDF:pSet = 13}$ ). Jets are reconstructed with the anti-$ k_T $ algorithm ($ R=0.4 $ ,$ p_{{\rm{T}}}>30 $ GeV,$ |y|<4.7 $ ) via the$\text{S}{\small{\text{LOW}}}\text{J}{\small{\text{ET}}}$ implementation, applied to all visible final-state particles. The missing transverse momentum is defined as the negative vector sum of the transverse momenta of all visible final-state particles. Initial- and final-state radiation, multiparton interactions and hadronisation are all enabled at their$\text{P}{\small{\text{YTHIA}}}$ defaults under the Monash 2013 tune, so the underlying event is included in every sample. Pile-up (additional simultaneous$ pp $ interactions) is not simulated. τ leptons are decayed by the generator, and no explicit hadronic-τ reconstruction is implemented: leptonic τ decays are indirectly rejected by the electron and muon vetoes, whereas hadronic τ decays are treated as ordinary visible hadronic activity. -
We implement two independent monojet selection prescriptions, modelled on the ATLAS [9] and CMS [10] Run-2 analyses, respectively. The principal differences between these two prescriptions are summarised in Table 1.
Requirement ATLAS-style CMS-style Leading-jet $ p_{{\rm{T}}} $ $>150 $ GeV$>100 $ GeVLeading-jet $ |\eta| $ $<2.4 $ $<2.4 $ $ \Delta\phi({\rm{jet}},\vec{p}_{{\rm{T}}}^{\,{\rm{miss}}}) $ $>0.4\ (0.6)^{\dagger} $ $>0.5 $ $ E_{{\rm{T}}}^{{\rm{miss}}} $ threshold$>200 $ GeV$>250 $ GeVMaximum number of jets $ \leqslant 4 $ no limit Electron/muon veto $ p_{{\rm{T}}}>7 $ GeV$ p_{{\rm{T}}}>10 $ GeVExplicit hadronic-τ veto $ ^{\ast} $ not implemented not implemented Photon veto not applied‡ not applied‡ † $\Delta\phi>0.6$ for$200<E_{{\rm{T}}}^{\text {miss}}\leq250$ GeV.
* The experimental analyses use nominal hadronic-τ veto thresholds of$p_{{\rm{T}}}>20$ and$>18$ GeV, respectively. No explicit hadronic-τ reconstruction is implemented here: τ leptons are decayed by the generator, leptonic τ decays are rejected indirectly by the electron and muon vetoes, and hadronic τ decays enter as ordinary visible hadronic activity.
‡ At the parton-shower level, photons from QED bremsstrahlung off the leading jet and from$\pi^{0}\to\gamma\gamma$ decays are spuriously flagged as isolated by a naive isolation algorithm, leading to an unphysical signal suppression. The full experimental analyses use calorimeter-based photon identification that rejects these parton-shower photons; we therefore omit the photon veto, in line with standard practice in collider phenomenology.Table 1. Criteria for selecting the two monojet prescriptions used in this work.
Acceptance of the two prescriptions. The signal acceptance after applying the two selections is compared in Fig. 1 for the benchmark point (
$ n=2 $ ,$ M_D=10 $ TeV). Above the common threshold of$ E_{{\rm{T}}}^{{\rm{miss}}}>250 $ GeV, the two prescriptions yield very similar acceptances: the CMS-style selection exceeds the ATLAS-style one by a factor of 1.02–1.08 across the$ E_{{\rm{T}}}^{{\rm{miss}}} $ spectrum. This small excess reflects the looser leading-jet$ p_{{\rm{T}}} $ threshold and the absence of a maximum-jet-multiplicity cut. The absolute acceptance of our parton-shower-level implementation is not directly comparable to the$ A\times\epsilon $ values quoted in Ref. [9], which refer to exclusive$ E_{{\rm{T}}}^{{\rm{miss}}} $ bins and to samples generated with a truth-level$ E_{{\rm{T}}}^{{\rm{miss}}}>350 $ GeV filter at different model points. Therefore, the absolute normalisation of the framework is not taken from the parton-shower acceptance, but is anchored to the published Run-2 limits through the calibration of Sec. 4.5.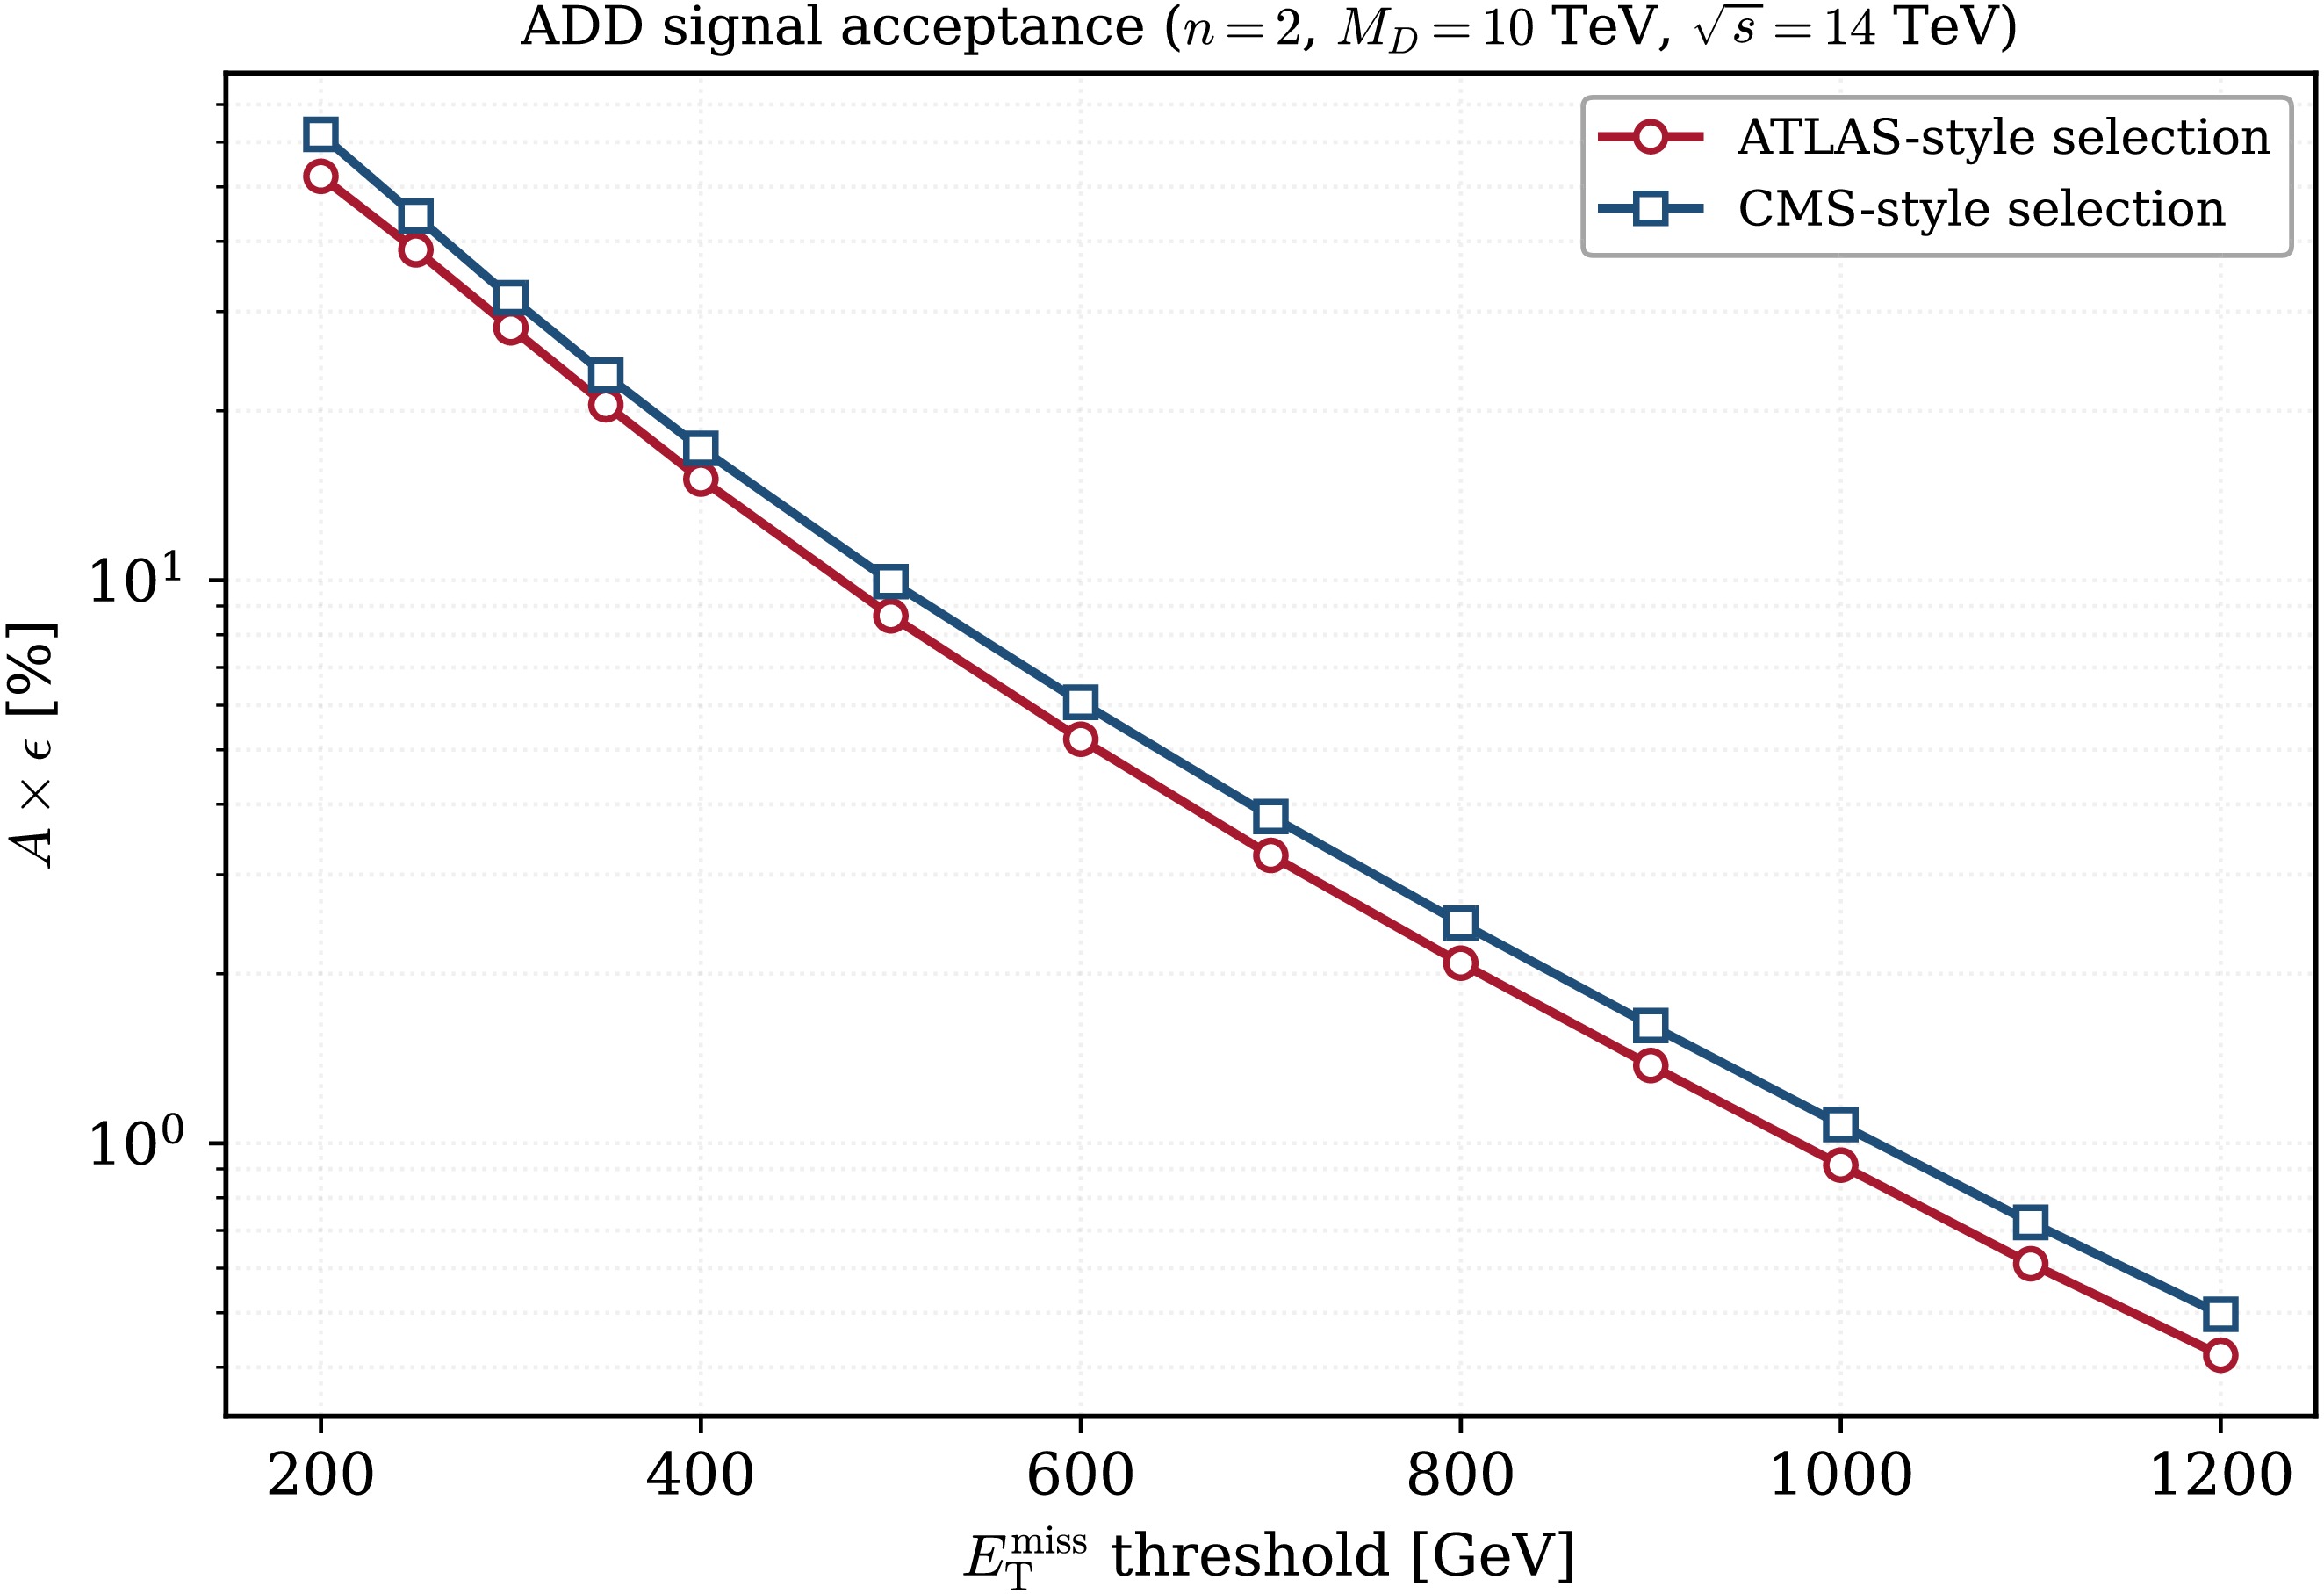
Figure 1. (color online) Signal acceptance times efficiency,
$ A\times\epsilon $ , as a function of the inclusive$ E_{{\rm{T}}}^{{\rm{miss}}} $ threshold for the benchmark point$ n=2 $ ,$ M_D=10 $ TeV at$ \sqrt{s}=14 $ TeV, and for the ATLAS-style (red circles) and CMS-style (blue squares) selections.Energy dependence of the acceptance. Because the projections span a factor of seven in centre-of-mass energy, it is important to assess whether the acceptance can be treated as energy-independent. Figure 2 shows
$ A\times\epsilon $ computed independently at$ \sqrt{s}=14 $ , 27, and 100 TeV for two representative benchmarks ($ n=2 $ and$ n=6 $ at$ M_D=10 $ TeV). For each collider, the sample is generated at the corresponding energy and passed through the full selection, so the acceptance is never scaled between colliders.$ A\times\epsilon $ rises smoothly and substantially with collider energy. For the ATLAS-style selection, the ratio$ A\times\epsilon(100\; {\rm{TeV}})/A\times\epsilon(14\; {\rm{TeV}}) $ grows from$ {\approx}1.4 $ at$ E_{{\rm{T}}}^{{\rm{miss}}}>400 $ GeV to$ {\approx}7.9 $ at$ E_{{\rm{T}}}^{{\rm{miss}}}>1200 $ GeV for$ n=2 $ . The rate of this rise itself depends on n ($ {\approx}4.2 $ instead of$ {\approx}7.9 $ at the most stringent threshold for$ n=6 $ ), because the higher-n spectrum is already hard at 14 TeV and therefore has less capacity for further growth. At the lowest thresholds, the ratio even falls below unity, because increased radiation and underlying-event activity at higher$ \sqrt{s} $ more often lead to failure of the jet-multiplicity and veto requirements. This two-parameter dependence, which no single energy-scaling factor could reproduce, is captured by generating each$ (\sqrt{s},n, M_D) $ configuration independently.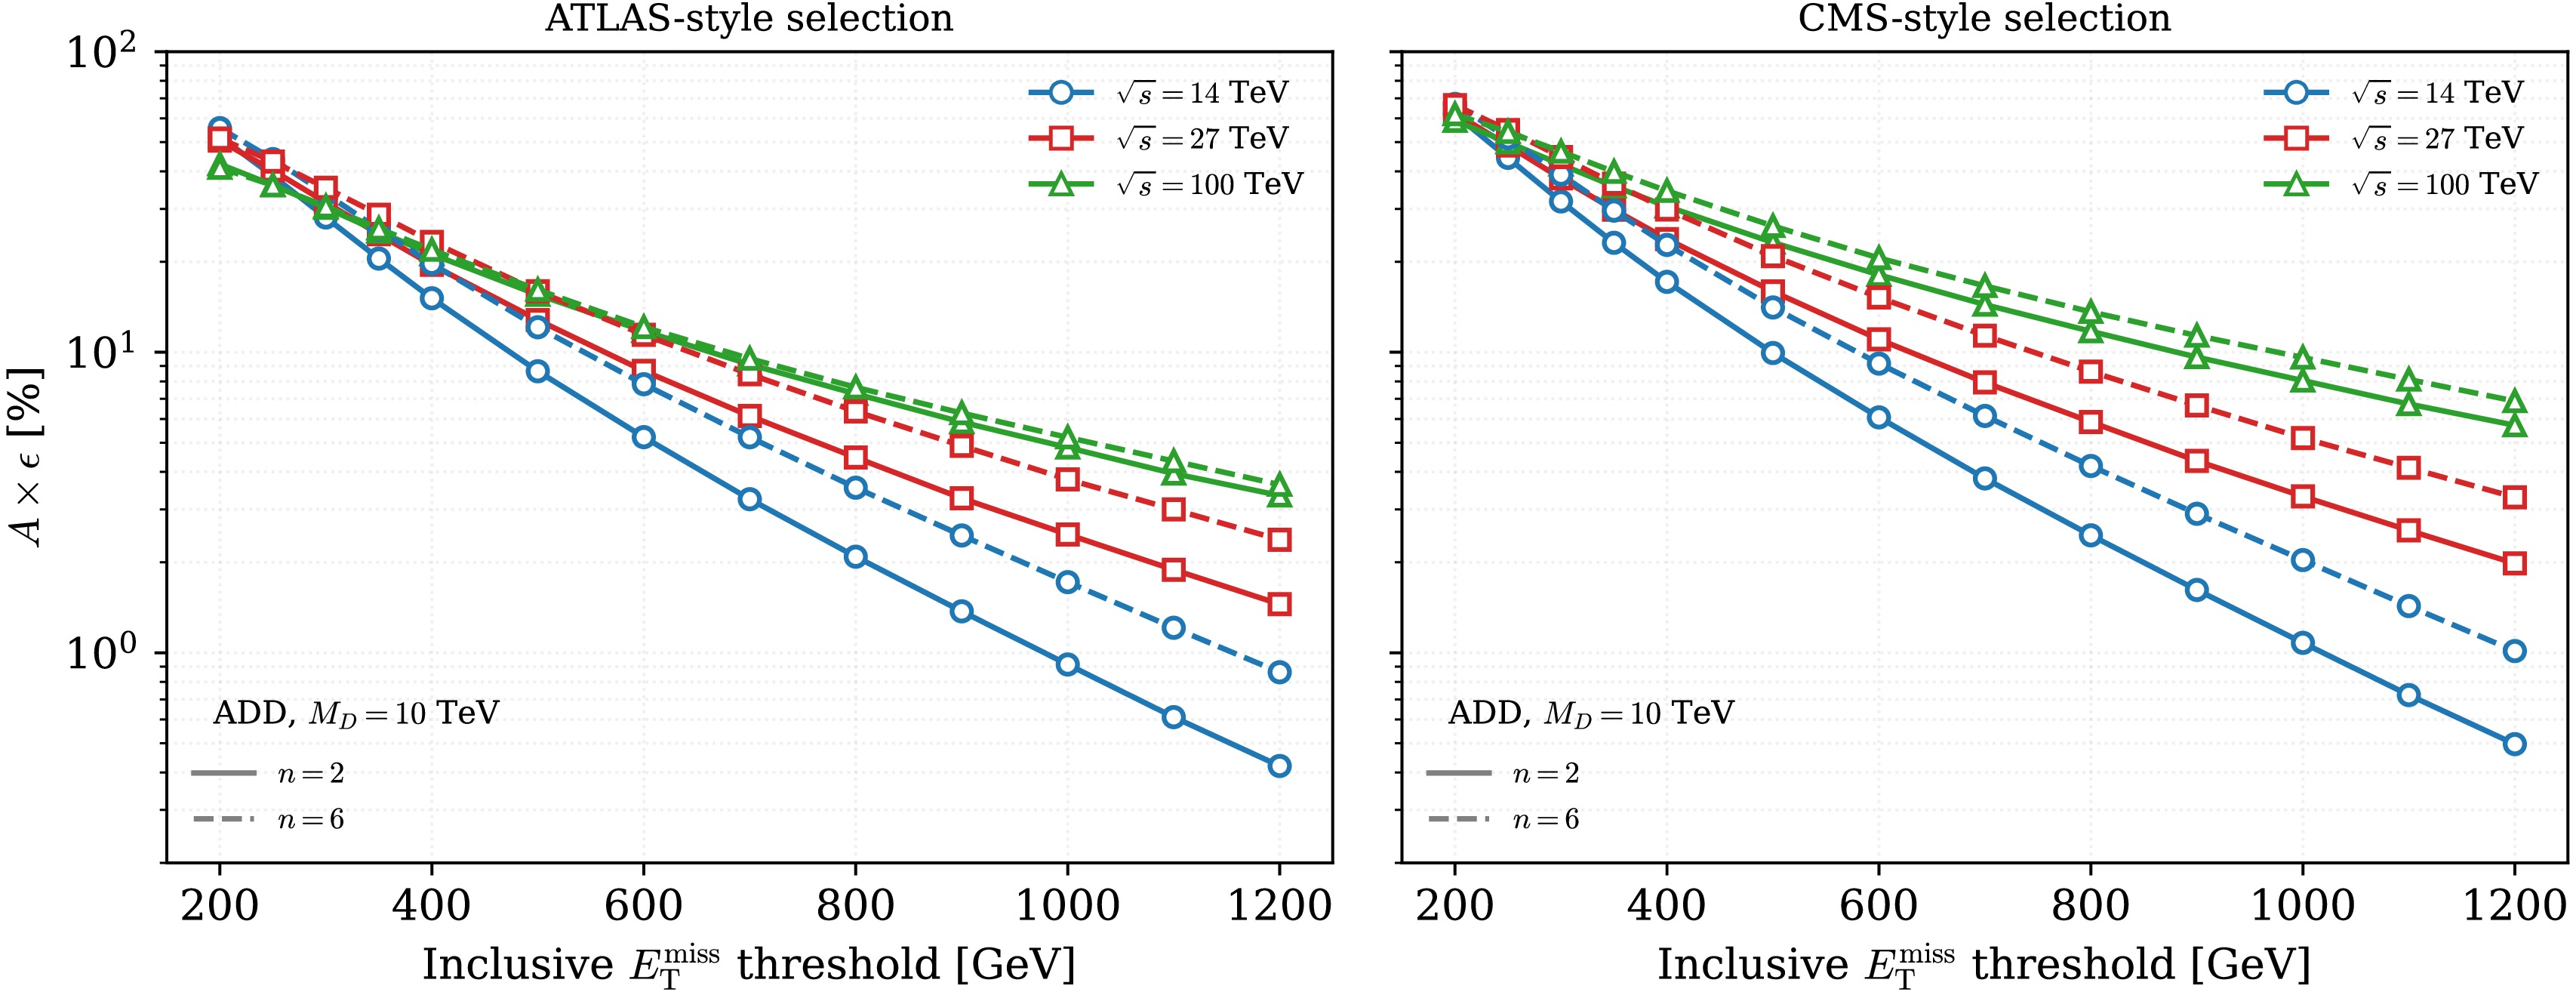
Figure 2. (color online) Signal acceptance times efficiency,
$ A\times\epsilon $ , as a function of the inclusive$ E_{{\rm{T}}}^{{\rm{miss}}} $ threshold for$ M_D=10 $ TeV, for the ATLAS-style (left) and CMS-style (right) selections at$ \sqrt{s}=14 $ , 27, and 100 TeV, and for two representative values of the number of extra dimensions:$ n=2 $ (solid) and$ n=6 $ (dashed). Each sample is generated at the corresponding collider energy and passed independently through the full selection; the acceptance is not scaled between colliders. The curve for$ n=2 $ and$ \sqrt{s}=14 $ TeV reproduces Fig. 1.Validation against the published ATLAS cutflow. The selection implementation is validated directly against the ATLAS signal cutflow published on
$\mathrm{HEPData}$ [16], which reports the fraction of events with truth-level$ E_{{\rm{T}}}^{{\rm{miss}}}>350 $ GeV that survive each inclusive$ E_{{\rm{T}}}^{{\rm{miss}}} $ threshold for the ADD benchmark$ n=4 $ ,$ M_D=3.6 $ TeV. To match the benchmark and baseline definitions exactly, we generate a dedicated sample at this point at$ \sqrt{s}=13 $ TeV, retaining the truth-level$ E_{{\rm{T}}}^{{\rm{miss}}} $ and applying the same$ E_{{\rm{T}}}^{{\rm{miss}}}>350 $ GeV baseline. Since the ATLAS limits are quoted for the nominal (untruncated) signal, the comparison uses$\mathrm{CutOffMode = 0}$ , which matches the acceptance definition of the experimental analysis. As shown in Fig. 3, the survival fractions reproduce the published cutflow across the full$ E_{{\rm{T}}}^{{\rm{miss}}} $ range, with a flat ratio of 1.02–1.06 and no spectral distortion: the parameterised framework reproduces the ATLAS selection response to within a few percent. The same figure also shows the truncated ($\mathrm{CutOffMode = 1}$ ) signal at the same benchmark; its spectrum falls more steeply, with the ratio decreasing from 1.05 to 0.65. This quantifies the effect of the ultraviolet prescription at this low-$ M_D $ point, where a large fraction of the cross section lies at$ \hat{s}> M_D^{2} $ . -
We summarise the procedure before deriving its ingredients. The Standard-Model background is taken from the post-fit signal-region yields published by the experimental collaborations; its composition varies with
$ E_{{\rm{T}}}^{{\rm{miss}}} $ and is described immediately below. That composition is not, however, propagated into the energy extrapolation.$ Z(\to\nu\bar\nu)+ $ jets and$ W(\to\ell\nu)+ $ jets are generated as separate samples and normalised to their own cross sections. A combined V+jets$ E_{{\rm{T}}}^{{\rm{miss}}} $ -dependent scaling is derived from these samples and applied to both, while the non-V components are scaled by the same factors, with an additional uncertainty. The remainder of this section presents the composition and then derives the scaling.Background composition. The composition of the post-fit background varies with
$ E_{{\rm{T}}}^{{\rm{miss}}} $ . As extracted directly from the$\mathrm{HEPData}$ tables of Ref. [16], the$ W+ $ jets fraction of the total falls from 35.0% at$ E_{{\rm{T}}}^{{\rm{miss}}}>200 $ GeV to 17.4% at$ E_{{\rm{T}}}^{{\rm{miss}}}>1200 $ GeV, while$ Z(\to\nu\bar\nu)+ $ jets rises from 57.7% to 70.4%. The non-V+jets components (top, dibosons, multijet, and non-collision), which are scaled by the same measured factor, remain between 4.9% and 6.0% over the entire range; the remainder is$ Z(\to\ell\ell) $ +jets, which rises from 1.3% to 6.6% and is itself a V+jets process. This$ E_{{\rm{T}}}^{{\rm{miss}}} $ dependence does not propagate into the energy scaling. V+jets processes are assumed to have very similar$ E_{{\rm{T}}}^{{\rm{miss}}} $ -dependent energy-scaling behaviours, since their masses are far below the collision energies considered in this work; this assumption is tested at the$ 13\to14 $ TeV step below. The dominant V+jets processes are therefore scaled by the V+jets scaling factors derived below. The subdominant non-V+jets component is scaled by the same measured factor; varying this scaling by ±50% changes the projected reach by at most 0.7%. The residual uncertainty of the measured ratios is quantified in Sec. 5.2.Rather than reproducing the full Standard-Model background simulation chain, we adopt the post-fit signal-region yields published by the experimental collaborations on
$\mathrm{HEPData}$ . At the Run-2 reference point, this approach intrinsically incorporates the full detector response, control-region constraints, and higher-order theoretical corrections that the collaborations apply in their likelihood fits.For the ATLAS-style selection, we use the inclusive signal-region yields of Ref. [16], covering thirteen
$ E_{{\rm{T}}}^{{\rm{miss}}} $ thresholds from 200 to 1200 GeV at$ {\cal{L}}=139 $ fb−1; the post-fit uncertainties quoted there, rising from 1.3% at$ E_{{\rm{T}}}^{{\rm{miss}}}>200 $ GeV to 8.5% at$ E_{{\rm{T}}}^{{\rm{miss}}}>1200 $ GeV, already include the constraints from the five ATLAS control regions. For the CMS-style selection, we use the post-fit yields of Ref. [21] covering twenty-two exclusive recoil bins at$ {\cal{L}}=137 $ fb−1, combined into cumulative inclusive yields. The cumulative form is used only for the background comparison of Fig. 4, which is a cross-check of the two published background sets; the CMS-style selection does not enter the projected limits, which are anchored to ATLAS throughout (Sec. 4.5). The two sets are compared in Fig. 4: the luminosity-corrected ratio$ B_{{\rm{CMS}}}/B_{{\rm{ATLAS}}} $ lies between 0.84 and 0.91 (mean 0.88) across the spectrum.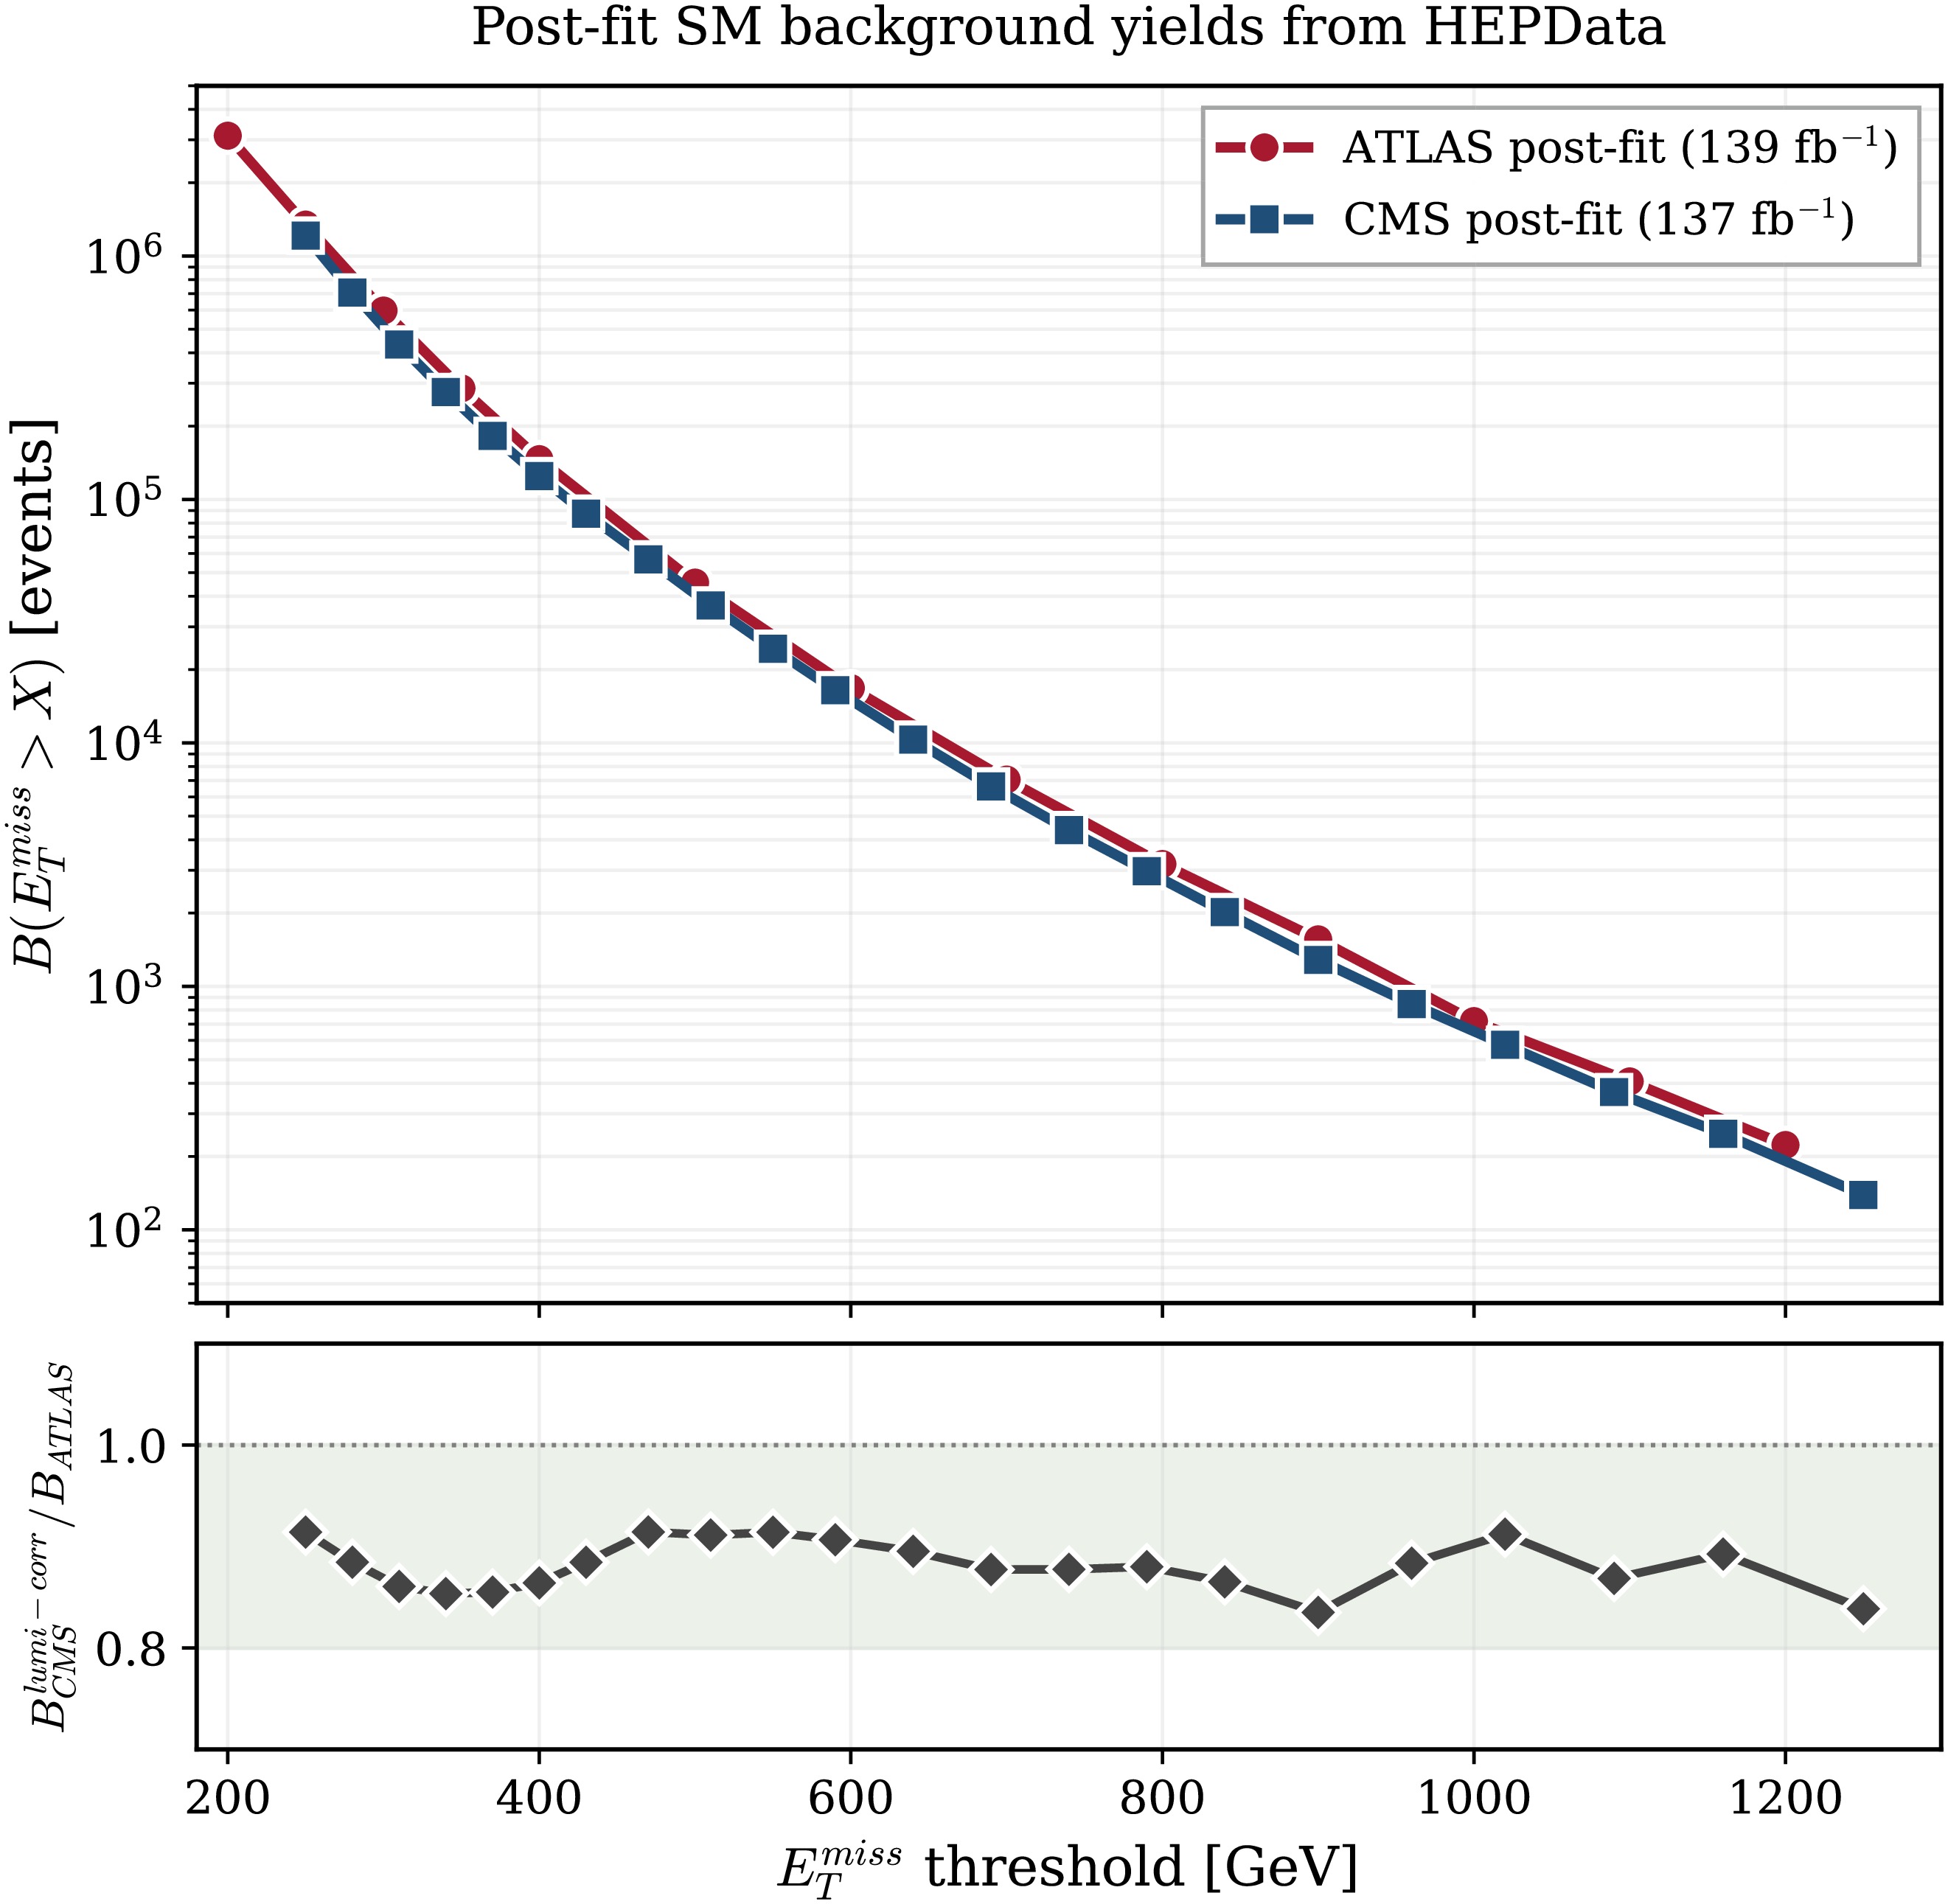
Figure 4. (color online) Post-fit Standard Model background yields obtained from
$\mathrm{HEPData}$ . Upper panel: cumulative inclusive yields above each$ E_{{\rm{T}}}^{{\rm{miss}}} $ threshold from the ATLAS Run-2 analysis [16] at 139 fb−1 (red circles) and the CMS Run-2 analysis [21] at 137 fb−1 (blue squares). Lower panel: luminosity-corrected ratio$ B_{{\rm{CMS}}}^{\mathrm{lumi-corr}}/B_{{\rm{ATLAS}}} $ , which lies within 0.84–0.91 across the$ E_{{\rm{T}}}^{{\rm{miss}}} $ spectrum.Energy scaling: measurement. For projections to the future colliders, the background yields are extrapolated as
$ B(\sqrt{s'},{\cal{L}}', E_{{\rm{T}}}^{{\rm{miss}}}) = B_{13\, {\rm{TeV}}}( E_{{\rm{T}}}^{{\rm{miss}}}) \times \frac{{\cal{L}}'}{{\cal{L}}_{{\rm{ref}}}} \times r_{\sigma}(\sqrt{s'}, E_{{\rm{T}}}^{{\rm{miss}}}), $
(3) where
$ {\cal{L}}_{{\rm{ref}}}=139\; {\rm{fb}}^{-1} $ and the energy-scaling factor$ r_{\sigma} $ is measured as a function of$ E_{{\rm{T}}}^{{\rm{miss}}} $ rather than assumed constant. Dedicated$\text{P}{\small{\text{YTHIA}}}$ 8 samples of$ Z(\to\nu\bar{\nu})+ $ jets and$ W(\to\ell\nu)+ $ jets are generated at$ \sqrt{s}=13 $ , 14, 27, and 100 TeV from the electroweak V+parton matrix elements1 and passed through the same reconstruction and selection chain as the signal. No event-level stitching is performed: each sample is normalised to its own generator cross section. The inclusive samples provide the ratios for$ E_{{\rm{T}}}^{{\rm{miss}}}\le600 $ GeV and the high-$ \hat{p}_T $ samples provide those for$ E_{{\rm{T}}}^{{\rm{miss}}}\ge700 $ GeV. The 700–900 GeV overlap region is used for validation, where the two determinations agree within$ 1.6\sigma $ at all three energy steps.Energy scaling: parameterisation and robustness. The measured ratios, shown in Fig. 5, are well described by
$ \ln r_{14\to\sqrt{s'}} = a\, E_{{\rm{T}}}^{{\rm{miss}}} + b $ , with$ (a,b)=(0.00112\; {\rm{GeV}}^{-1},\, 0.982) $ at 27 TeV and$ (0.00233\; {\rm{GeV}}^{-1},\,2.558) $ at 100 TeV over the measured range$ 300\le E_{{\rm{T}}}^{{\rm{miss}}}\le1200 $ GeV. The statistical uncertainties on the slopes are$ \sigma_a/a$ =2.2% and 1.1%, respectively, and the maximum fractional deviations of the measured points from the fitted curves are 5.9% and 4.9%, respectively. At 100 TeV, the latter lies within the ±10% slope variation adopted in Sec. 5.2; at 27 TeV, the former is comparable to the ±5% variation at the ends of the fitted range. The extrapolation does not rest on the fitted form: replacing the fits with direct log-linear interpolation between the measured points changes the projected reach by at most 0.3%. For more stringent selections, the ratio grows substantially, reaching$ {\approx}83 $ at$ E_{{\rm{T}}}^{{\rm{miss}}}>800 $ GeV and$ {\approx}210 $ at$ E_{{\rm{T}}}^{{\rm{miss}}}>1200 $ GeV for 100 TeV; this is the expected consequence of small-x PDF growth at fixed$ E_{{\rm{T}}}^{{\rm{miss}}} $ and higher$ \sqrt{s} $ . The fitted$ r_{14\to100} $ crosses the constant NNLO value of Ref. [14] at$ E_{{\rm{T}}}^{{\rm{miss}}}\approx430 $ GeV, and at$ E_{{\rm{T}}}^{{\rm{miss}}}>250 $ GeV the directly measured$ Z(\nu\bar\nu) $ -flavour ratio$ r^{Z}_{14\to27}=3.22 $ matches the NNLO factor of 3.20 to within 1%.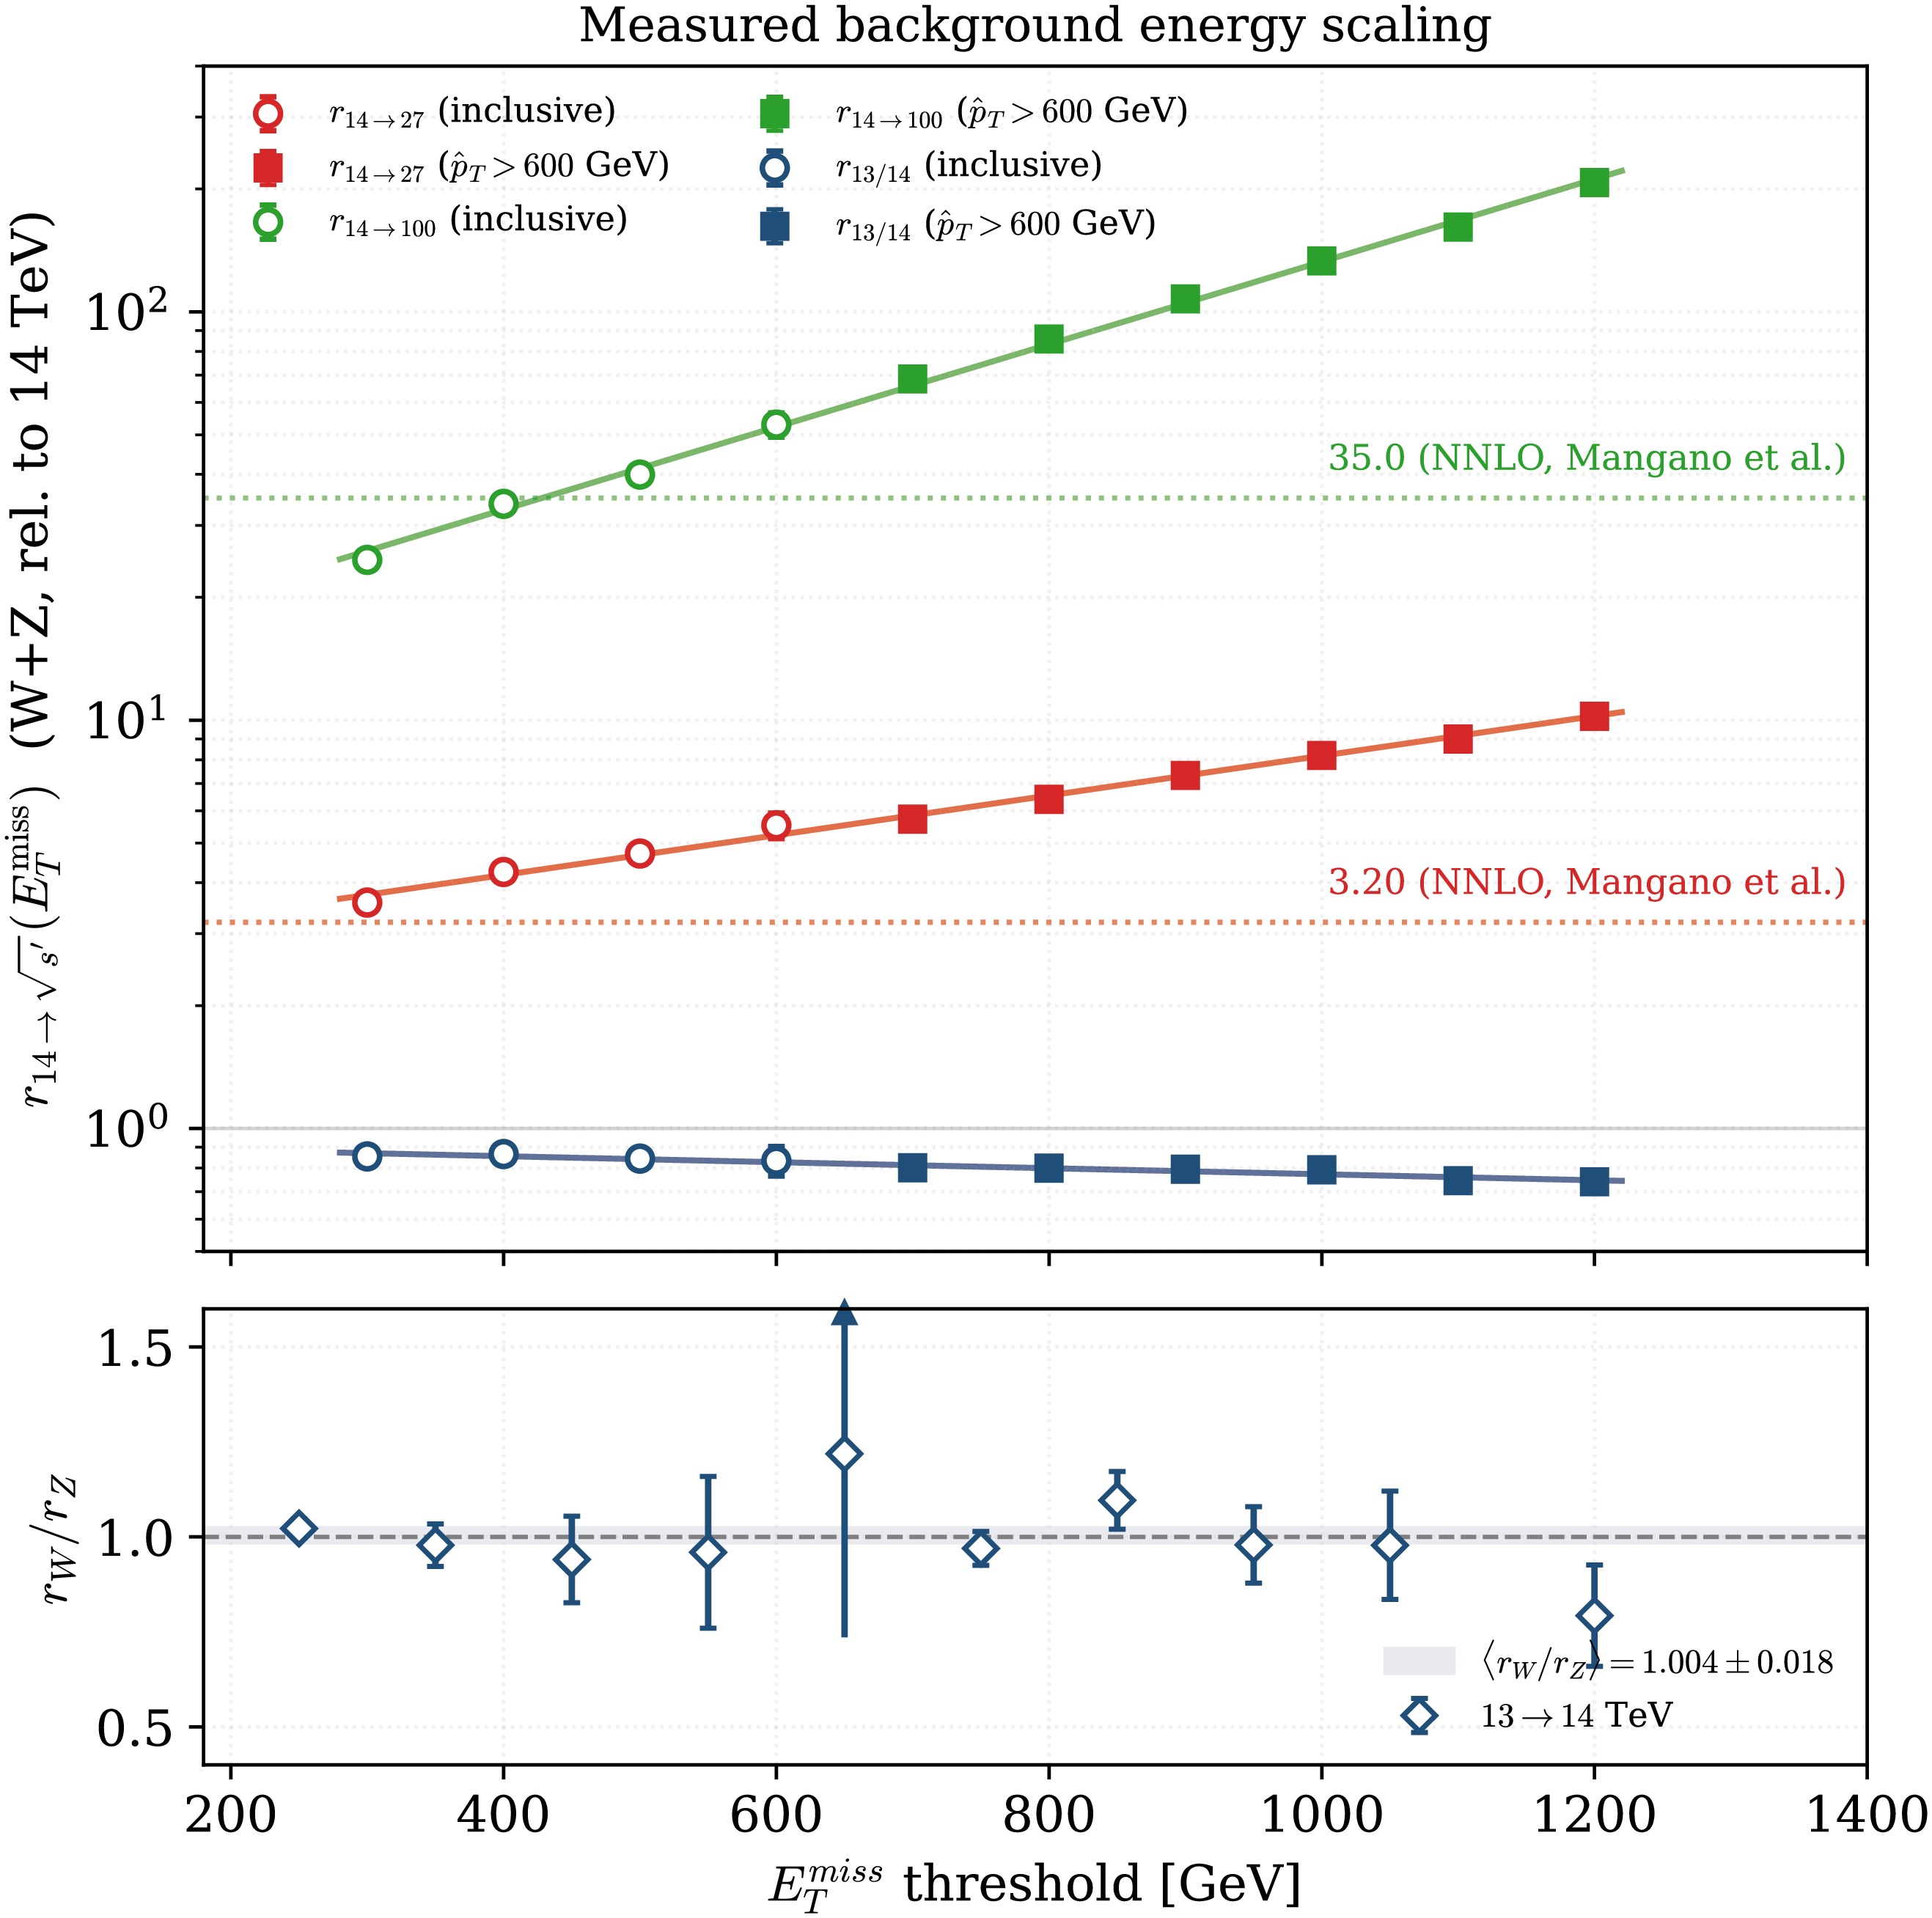
Figure 5. (color online) Measured background energy scaling. Upper panel: measured yield ratios
$ r_{14\to\sqrt{s'}}(E_{{\rm{T}}}^{{\rm{miss}}}) $ of the combined$ W+Z $ background relative to 14 TeV after applying the full ATLAS-style selection, from the inclusive samples (open markers,$ E_{{\rm{T}}}^{{\rm{miss}}}\le600 $ GeV) and the high-$ \hat{p}_T $ samples (filled markers,$ E_{{\rm{T}}}^{{\rm{miss}}}\ge700 $ GeV), together with exponential fits (solid lines) and$ r_{13/14}\equiv B_{13}/B_{14} $ ($ <1 $ ), the ratio used for the$ 13\to14 $ TeV reference step. The dotted horizontal lines indicate the constant NNLO factors from Ref. [14]; they are consistent with the measurement at moderate selections but are exceeded by up to a factor of$ {\approx}6 $ at the hardest thresholds. Lower panel: flavour ratio$ r_W/r_Z $ at the$ 13\to14 $ TeV step, evaluated in exclusive$ E_{{\rm{T}}}^{{\rm{miss}}} $ bins and consistent with unity within statistical uncertainties ($ 1.004\pm0.018 $ ).The
$ 13\to14 $ TeV step. The same procedure, applied to dedicated 13 TeV samples, determines the$ 13\to14 $ TeV step,$ r_{13/14}(E_{{\rm{T}}}^{{\rm{miss}}})\equiv B_{13}(E_{{\rm{T}}}^{{\rm{miss}}})/B_{14}(E_{{\rm{T}}}^{{\rm{miss}}}) $ :$ \ln r_{13/14} = (-1.70\times10^{-4}\; {\rm{GeV}}^{-1})\, E_{{\rm{T}}}^{{\rm{miss}}} -0.088 $ , falling from 0.87 at$ E_{{\rm{T}}}^{{\rm{miss}}}=300 $ GeV to 0.75 at$ E_{{\rm{T}}}^{{\rm{miss}}}=1200 $ GeV. At this step, at which the two flavours can be compared directly, the ratio of independently determined per-flavour factors is$ r_W/r_Z = 1.004\pm0.018 $ ($ \chi^2/{\rm{ndf}}=6.0/9 $ ), with separately fitted slopes$ a_W=(-1.90\pm0.66)\times10^{-4} $ GeV−1 and$ a_Z=(-1.34\pm0.21)\times10^{-4} $ GeV−1 that differ by 0.8 standard deviations (Fig. 5, lower panel), which supports the common V+jets scaling assumed above. Since the reference yields are taken at 13 TeV while the ratios above are measured relative to 14 TeV, the factor entering Eq. (3) is the composite$ r_{\sigma}(\sqrt{s'}, E_{{\rm{T}}}^{{\rm{miss}}})=r_{14\to\sqrt{s'}}(E_{{\rm{T}}}^{{\rm{miss}}})/r_{13/14}(E_{{\rm{T}}}^{{\rm{miss}}}) $ ; for the HL-LHC this reduces to$ 1/r_{13/14}(E_{{\rm{T}}}^{{\rm{miss}}}) $ , an$ E_{{\rm{T}}}^{{\rm{miss}}} $ -dependent background increase of 14–34% across the analysis range that a constant-factor treatment would miss. -
The expected significance at each
$ (\sqrt{s},n, M_D) $ point is computed using the combined Asimov significance [26] across the thirteen exclusive$ E_{{\rm{T}}}^{{\rm{miss}}} $ bins of the signal region, matching the binning used in the ATLAS likelihood fit. For each exclusive bin i,$ \begin{aligned}[b] Z_i=&\Biggl\{\,2\biggl[\,(S_i+B_i)\, \ln \frac{(S_i+B_i)\,\bigl(B_i+\sigma_{B,i}^{2}\bigr)} {B_i^{2}+(S_i+B_i)\,\sigma_{B,i}^{2}}\\ &-\;\frac{B_i^{2}}{\sigma_{B,i}^{2}}\, \ln \biggl(1+\frac{\sigma_{B,i}^{2}\,S_i} {B_i\,\bigl(B_i+\sigma_{B,i}^{2}\bigr)}) ]\Biggr\}^{1/2}, \end{aligned} $
(4) where
$ S_i $ and$ B_i $ are the signal and background yields in bin i, and$ \sigma_{B,i} $ is the post-fit background uncertainty in that bin; the exclusive yields are obtained by taking differences of the published inclusive thresholds, with the highest bin remaining open-ended. For projections to future colliders, the post-fit uncertainty is propagated with a fixed relative size,$ \sigma_{B,i}(\sqrt{s'},{\cal{L}}') \;=\; \delta_{B,i}\, B_i(\sqrt{s'},{\cal{L}}'), \qquad \delta_{B,i} \equiv \dfrac{\sigma_{B,13}^{(i)}}{B_{13}^{(i)}}, $
That is, the statistical and systematic components of the Run-2 post-fit uncertainty are held fixed jointly at their measured relative values (1.3%–8.5%; Sec. 4.3), and the absolute uncertainty scales in proportion to the extrapolated yield. This defines our conservative baseline uncertainty scenario. With respect to luminosity, this choice is conservative: it assumes no reduction arising from the twentyfold to two-hundredfold increase in control-region statistics and no future improvement in theoretical modelling. It deliberately does not attempt to model possible new systematic sources specific to higher energies, which cannot be anchored to Run-2 data. At the most stringent thresholds, this fixed relative uncertainty renders the projected significance systematics-limited at high luminosity, and this saturation is fully reflected in the quoted reach values. The expected significance for the model point is then
$ Z_{{\rm{exp}}}(\sqrt{s},n, M_D)= \Biggl[\;\sum\limits_{i} Z_i^{2}\;\Biggr]^{1/2}. $
(5) This construction uses the shape of the
$ E_{{\rm{T}}}^{{\rm{miss}}} $ distribution, as the model-dependent ATLAS limits do, and is the estimator against which the calibration of Sec. 4.5 is defined. Adding the bins in quadrature treats them as uncorrelated, which is optimistic: the ATLAS post-fit uncertainties are strongly correlated across bins, and a full likelihood would generally recover less than the quadrature sum. The assumption is therefore not neutral, and no separate correction is introduced for it; its residual signature appears in the calibration factors of Sec. 4.5, which absorb it at the anchor.The exclusive yields and their uncertainties warrant discussion, since the two enter differently. ATLAS publishes both an inclusive set of thresholds, used for its model-independent interpretation, and an exclusive set of bins, used for the model-dependent fit; the two are derived from separate fits. We construct the exclusive yields by differencing the inclusive ones, and assign to each exclusive bin the relative uncertainty of the inclusive threshold at its lower edge. Neither step is exact, and we have quantified the impact of each. The differenced yields agree with the published exclusive yields to better than 3% in eleven of the thirteen bins and to 11–13% in two; substituting the published yields throughout changes any projected reach by no more than 0.3%, since those two bins are not among the dominant ones. The uncertainties are more consequential: those we assign exceed the published exclusive ones by a factor that grows with
$ E_{{\rm{T}}}^{{\rm{miss}}} $ , averaging 2.4 over the four highest bins. This inflation is not incidental. Adopting the published exclusive uncertainties while retaining the uncorrelated quadrature sum combines two optimistic approximations and yields significances so large that the 13 TeV anchor crossings for$ n=2 $ and$ n=6 $ fall outside the simulated grid entirely; conversely, scaling the published uncertainties by 2.4 reproduces our projected reach to within 1% at every point. Our treatment is therefore equivalent to using the published exclusive uncertainties inflated by a factor that compensates, to the accuracy relevant here, for the bin-to-bin correlations neglected by the quadrature sum. ATLAS does not publish a covariance matrix for this signal region, so an exact treatment is not available, and the same uncorrelated approximation is adopted in published reinterpretations of this analysis [27]. -
A parton-shower-level analysis cannot reproduce in detail the multivariate identification algorithms, the full
$\text{G}{\small{\text{EANT}}}4$ detector simulation, the profile-likelihood fit over multiple control regions, and the experiment-specific generation settings of the published ATLAS and CMS Run-2 analyses. To account transparently for these differences, we apply an n-dependent calibration factor to our projected$ M_D $ reach, defined at the Run-2 anchor point of each n as$ C_n \equiv \dfrac{M_D^{{\rm{published}},n}} {M_D^{{\rm{ours}},n}(Z=1.96)}\,. $
(6) Here
$ M_D^{{\rm{published}},n} $ denotes the expected 95% CL exclusion limit from ATLAS PRD 103 for a given n; the expected, rather than the observed, limit is used so that the calibration is consistent with the Asimov (expected) significance of Sec. 4.4. The denominator$ M_D^{{\rm{ours}},n}(Z=1.96) $ is the value at which our uncalibrated significance crosses$ Z=1.96 $ at$ \sqrt{s}=13 $ TeV and$ {\cal{L}}=139 $ fb−1, using the ATLAS-style selection and the ATLAS post-fit backgrounds.Like-for-like construction. Equation (6) is a ratio of two limits; it isolates the framework difference only if everything outside the framework matches on both sides. Three choices follow. First, the significance is the combined estimator over the thirteen exclusive
$ E_{{\rm{T}}}^{{\rm{miss}}} $ bins of Sec. 4.4, the same binning that underlies the published ATLAS limits. Second, the anchor samples are generated without the$ \hat{s}> M_D^{2} $ suppression, since the published ATLAS limits are quoted for the untruncated signal and this damping is treated there as a separate cross-check of negligible impact [9]. Third, the crossing is located by interpolating$ \log Z $ linearly in$ \log M_D $ , the form implied by the$ M_D^{-(n+2)} $ scaling of Eq. (2). The simulated grids support this: the local logarithmic slope approaches$ -(n+2) $ from above, and on the$ n=2 $ grids, where the spacing is finest relative to the curvature, it varies by less than 1% between adjacent intervals in the bracketing region. The first and third choices are applied identically to the anchors and to every projected crossing. The second choice concerns the anchors alone, where it matches the published signal definition; the projection samples use the truncated signal of Sec. 4.1, and$ C_n $ is applied to them as the normalisation correction described below.Anchor determination. The anchor crossings are obtained from dedicated signal samples generated at
$ \sqrt{s}=13 $ TeV ($ 3\times10^{5} $ events per point) on$ M_D $ grids chosen to bracket each crossing. No anchor or projected crossing quoted in this work relies on extrapolation beyond the simulated grid. All five values of n are calibrated directly. The projections are quoted for$ n=2,3,4,6 $ , the set chosen for the projections, to which the comparison of Sec. 5 is restricted; the$ n=5 $ anchor enters solely as an additional, independent calibration point. Inserting the ATLAS expected limits (Table 10 of Ref. [9]) together with our uncalibrated crossings,$\begin{split} & M_D^{{\rm{published}}}=\{11.6,\ 8.6,\ 7.2,\ 6.4,\ 5.9\}\; {\rm{TeV}}, \qquad\\ & M_D^{{\rm{ours}}}=\{11.89,\ 8.64,\ 7.13,\ 6.33,\ 5.83\}\; {\rm{TeV}}, \end{split} $
into Eq. (6) gives
$ \begin{split} &C_2 = 0.975, \quad C_3 = 0.995, \quad C_4 = 1.010, \quad \\ &C_5 = 1.011, \quad C_6 = 1.012, \end{split} $
(7) a mean of 1.001 with a dispersion of ±1.4% and a standard error of the mean of 0.6% (Fig. 6). The factors are evaluated from the unrounded crossings; the two-decimal values displayed above reproduce them to within 0.001.
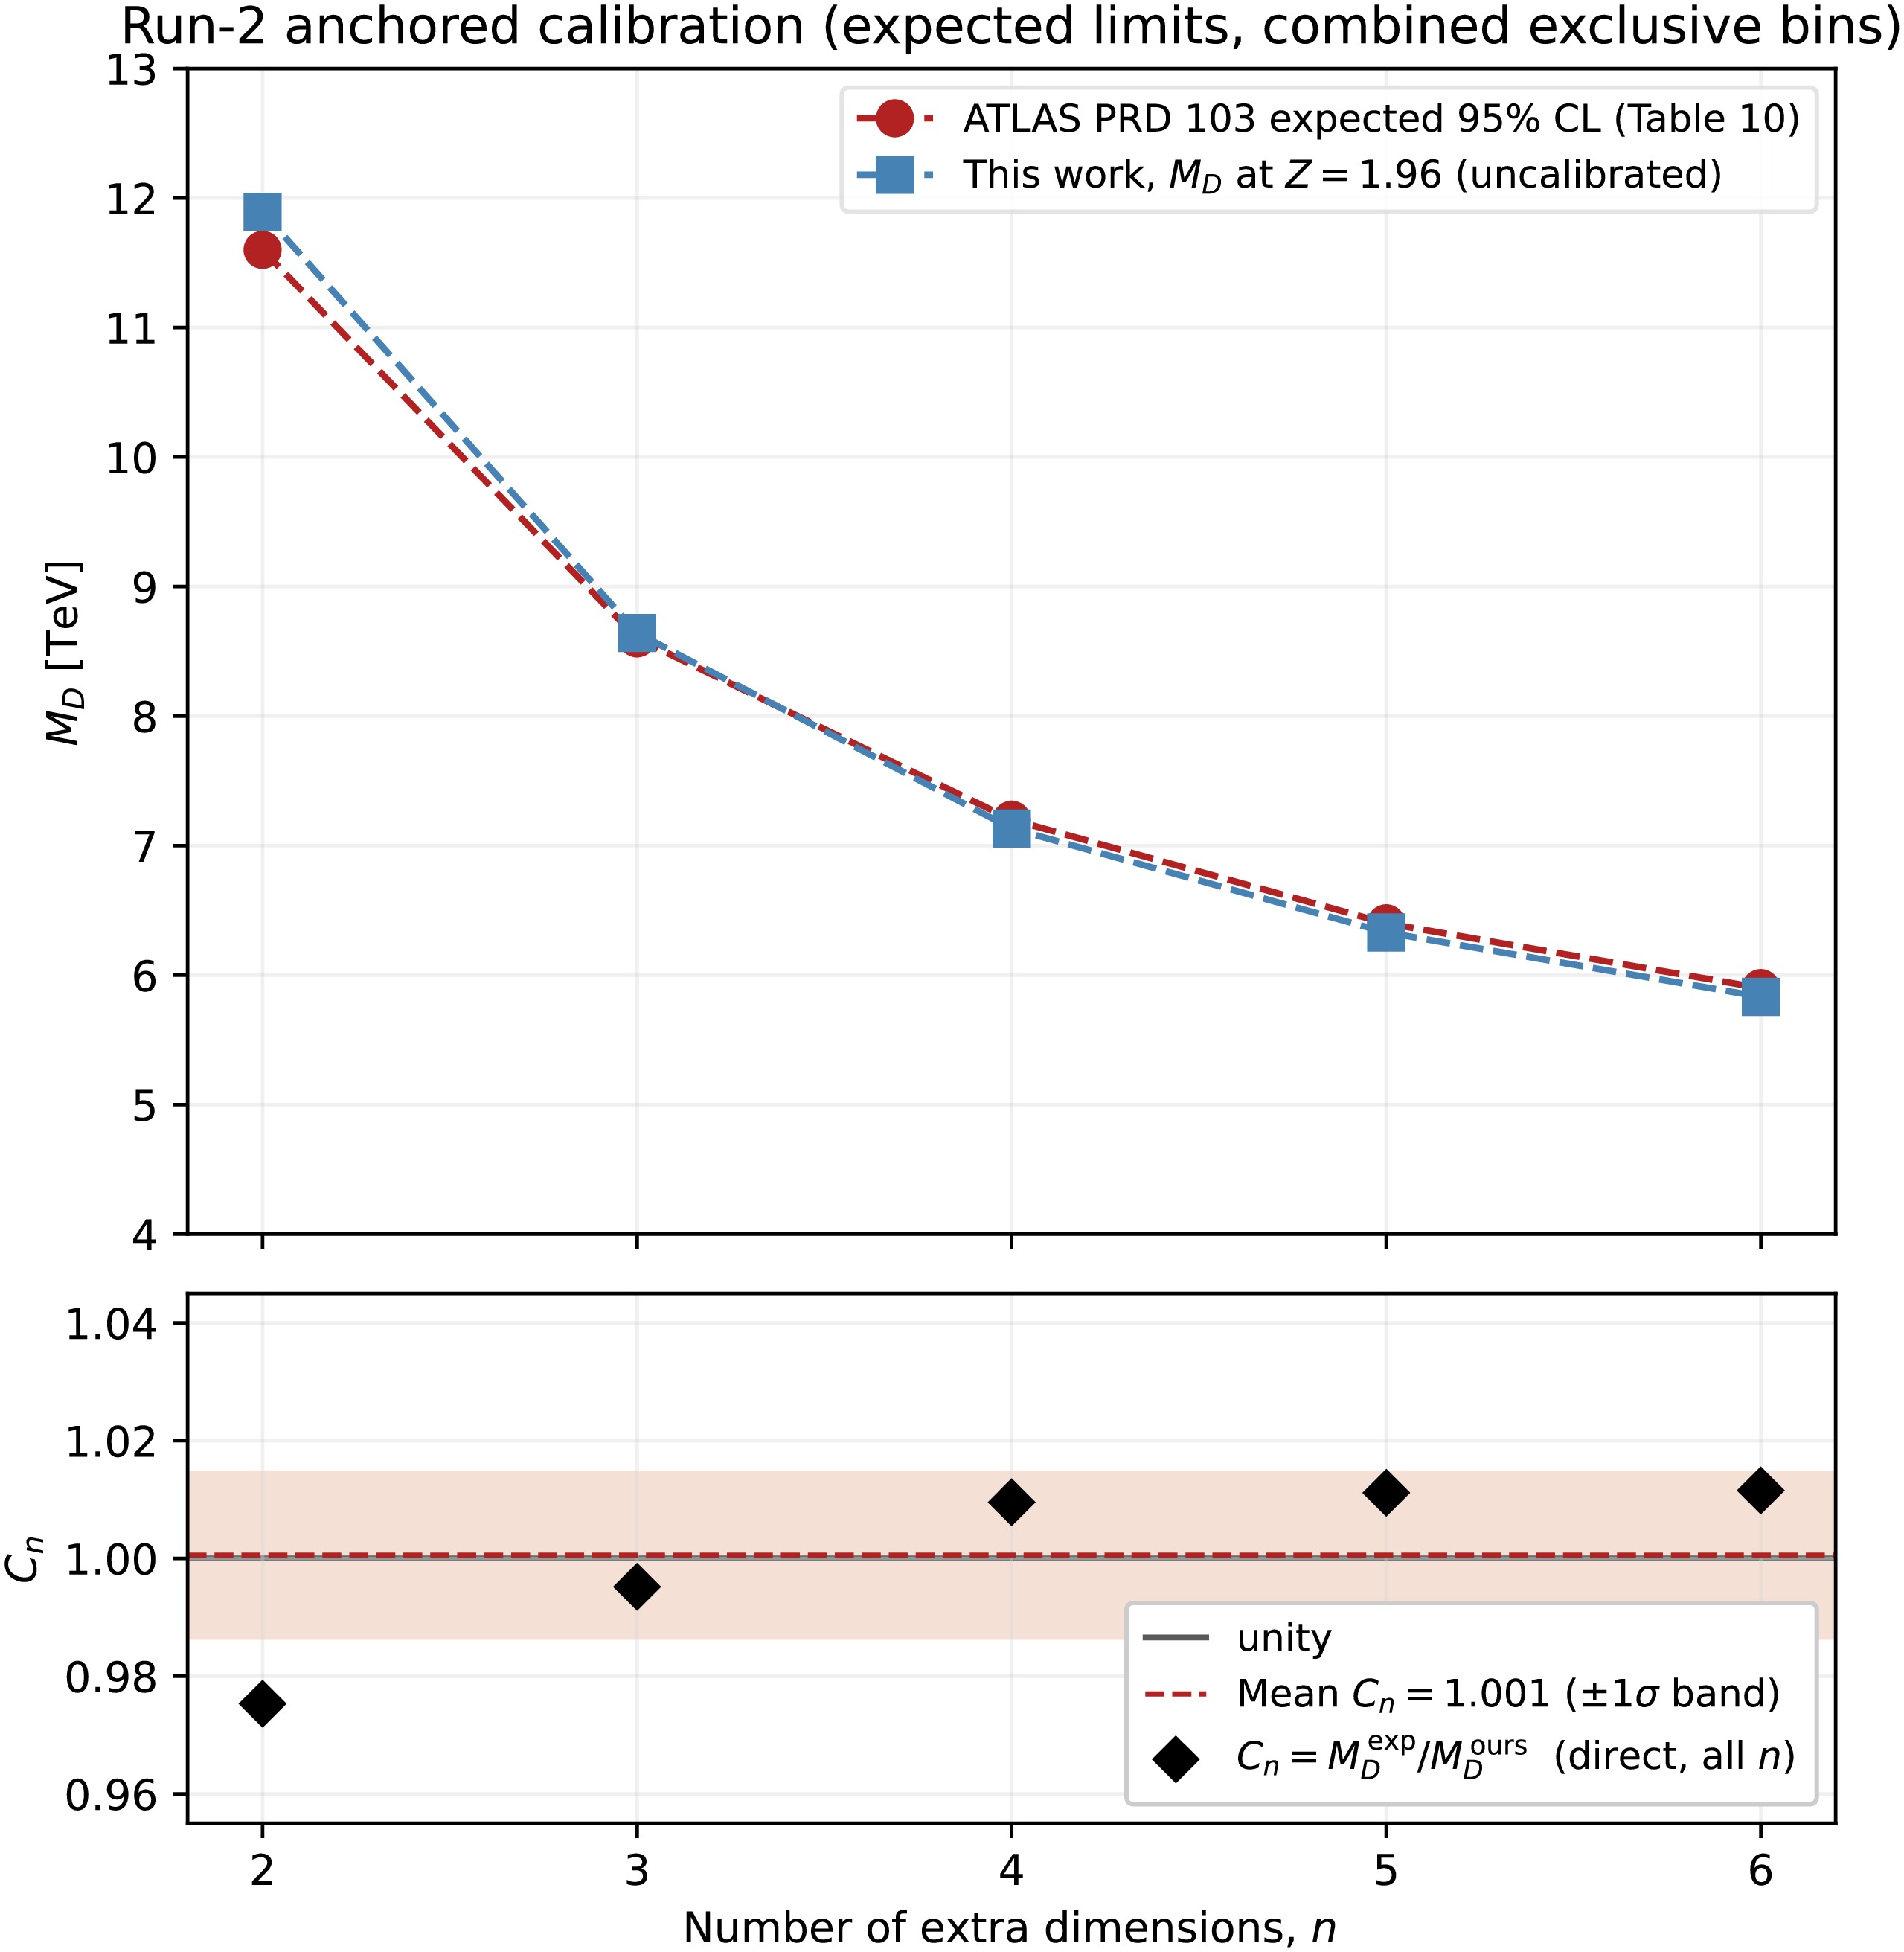
Figure 6. Run-2-anchored, n-dependent calibration of the projection framework, referenced to the expected limits. Upper panel:
$ M_D $ values at which our uncalibrated significance crosses$ Z=1.96 $ for$ \sqrt{s}=13 $ TeV and$ {\cal{L}}=139 $ fb−1, using an ATLAS-style selection with the combined exclusive-bin estimator (blue squares); the crossings are obtained from dedicated 13 TeV anchor samples bracketing each crossing. These values are compared with the 95% CL expected limits published by ATLAS in PRD 103, from Table 10 of Ref. [9] (red circles). Lower panel: calibration factors$ C_n $ of Eq. (6), with all five determined directly (filled diamonds), clustered around a mean of 1.001 (dashed line) with a standard deviation of 0.014 (shaded band); the grey line marks unity. The$ n=5 $ point is a calibration-only anchor and does not enter the projections.What the calibration carries. The five factors have a mean of 1.001 and all lie within 2.5% of unity: the framework reproduces the published expected limits with at most a 2.5% correction. This provides additional validation of the workflow, beyond the cutflow comparison of Sec. 4.2.
The factors are not structureless, however. They rise with n by 3.7% from 0.975 at
$ n=2 $ to 1.012 at$ n=6 $ , flattening above$ n=4 $ . The sign and shape are those expected from treating the thirteen bins as uncorrelated in the combined estimator (Sec. 4.4): that treatment is optimistic, and particularly so where the signal is spread over the largest number of bins, i.e. at low n. No separate correction is introduced for this effect. When applied per n,$ C_n $ absorbs this n-dependent mismatch at the Run-2 anchor; its transfer to the other collider energies is a modelling assumption, and the uncertainty assigned to the calibration is given in Sec. 5.2.2 Transfer across collider energies. All projected reach values in Sec. 5 are obtained by multiplying the uncalibrated reach by the appropriate
$ C_n $ , treated as an energy-independent normalisation correction. The energy evolution of the signal acceptance and background is carried explicitly by the dedicated samples generated at each$ \sqrt{s} $ , not by the calibration. The transfer of the correction across energies is a modelling assumption: its ingredients are held fixed in our setup, but their relative impact can itself vary with energy. This assumption is supported by the explicit energy-dependent acceptance study of Fig. 2 and by the stability of the anchors noted above,3 but cannot be fully validated without detector-level simulations at each collider; it has the same status as the detector-performance assumption discussed in Sec. 5.2, where an uncertainty is assigned to it. A direct test would be a second anchor at a different centre-of-mass energy, which requires matching a different selection and background model and is left to future work. -
For each
$ (\sqrt{s},n) $ point, the reach in$ M_D $ is determined by locating the value at which the calibrated significance crosses$ Z=1.96 $ (95% CL exclusion) or$ Z=5.0 $ ($ 5\sigma $ discovery); the crossing is located by interpolating$ \log Z $ linearly in$ \log M_D $ within the simulated grid (Sec. 4.5). The bracketing requirement applies to the uncalibrated crossing$ M_D^{{\rm{ours}}}(Z) $ , to which$ C_n $ is subsequently applied. With the measured background scaling of Sec. 4.3, all crossings reported in Sec. 5 are bracketed within the simulated grids, and no extrapolation is used.The validity of the effective-theory interpretation is governed not by a bound on
$ M_D $ itself —$ M_D $ is the higher-dimensional gravity scale, not the mass of a produced particle, and is not subject to a kinematic ceiling at$ \sqrt{s} $ — but by the$ \hat{s}> M_D^{2} $ truncation prescription ($\mathrm{CutOffMode = 1}$ ) used for all projection samples (Sec. 4.1). -
The principal results of this study are the projected 95% CL exclusion and
$ 5\sigma $ discovery reaches in$ M_D $ for$ n\in\{2,3,4,6\} $ at the three future hadron colliders. These calibrated reach values are summarised in Table 2 and shown in Fig. 7.n HL-LHC HE-LHC FCC-hh 14 TeV, 3 ab−1 27 TeV, 15 ab−1 100 TeV, 30 ab−1 95% CL $ 5\sigma $ 95% CL $ 5\sigma $ 95% CL $ 5\sigma $ 2 12.46 9.81 15.18 11.99 22.03 17.03 3 9.23 7.59 11.94 9.80 19.11 15.32 4 7.75 6.56 10.49 8.78 18.07 14.70 6 6.27 5.46 8.99 7.74 17.30 14.46 Table 2. Projected 95% CL exclusion and
$ 5\sigma $ discovery reach in$ M_D $ (TeV), obtained using the ATLAS-style selection with the n-dependent calibration of Sec. 4.5. All calibration factors, including those for$ n=6 $ , are determined directly from dedicated 13 TeV anchor samples (Sec. 4.5). For$ n=6 $ , the 14 TeV grid was extended down to$ M_D=4 $ TeV so that all quoted crossings, including the$ n=6 $ HL-LHC$ 5\sigma $ value, are bracketed within the simulated grid.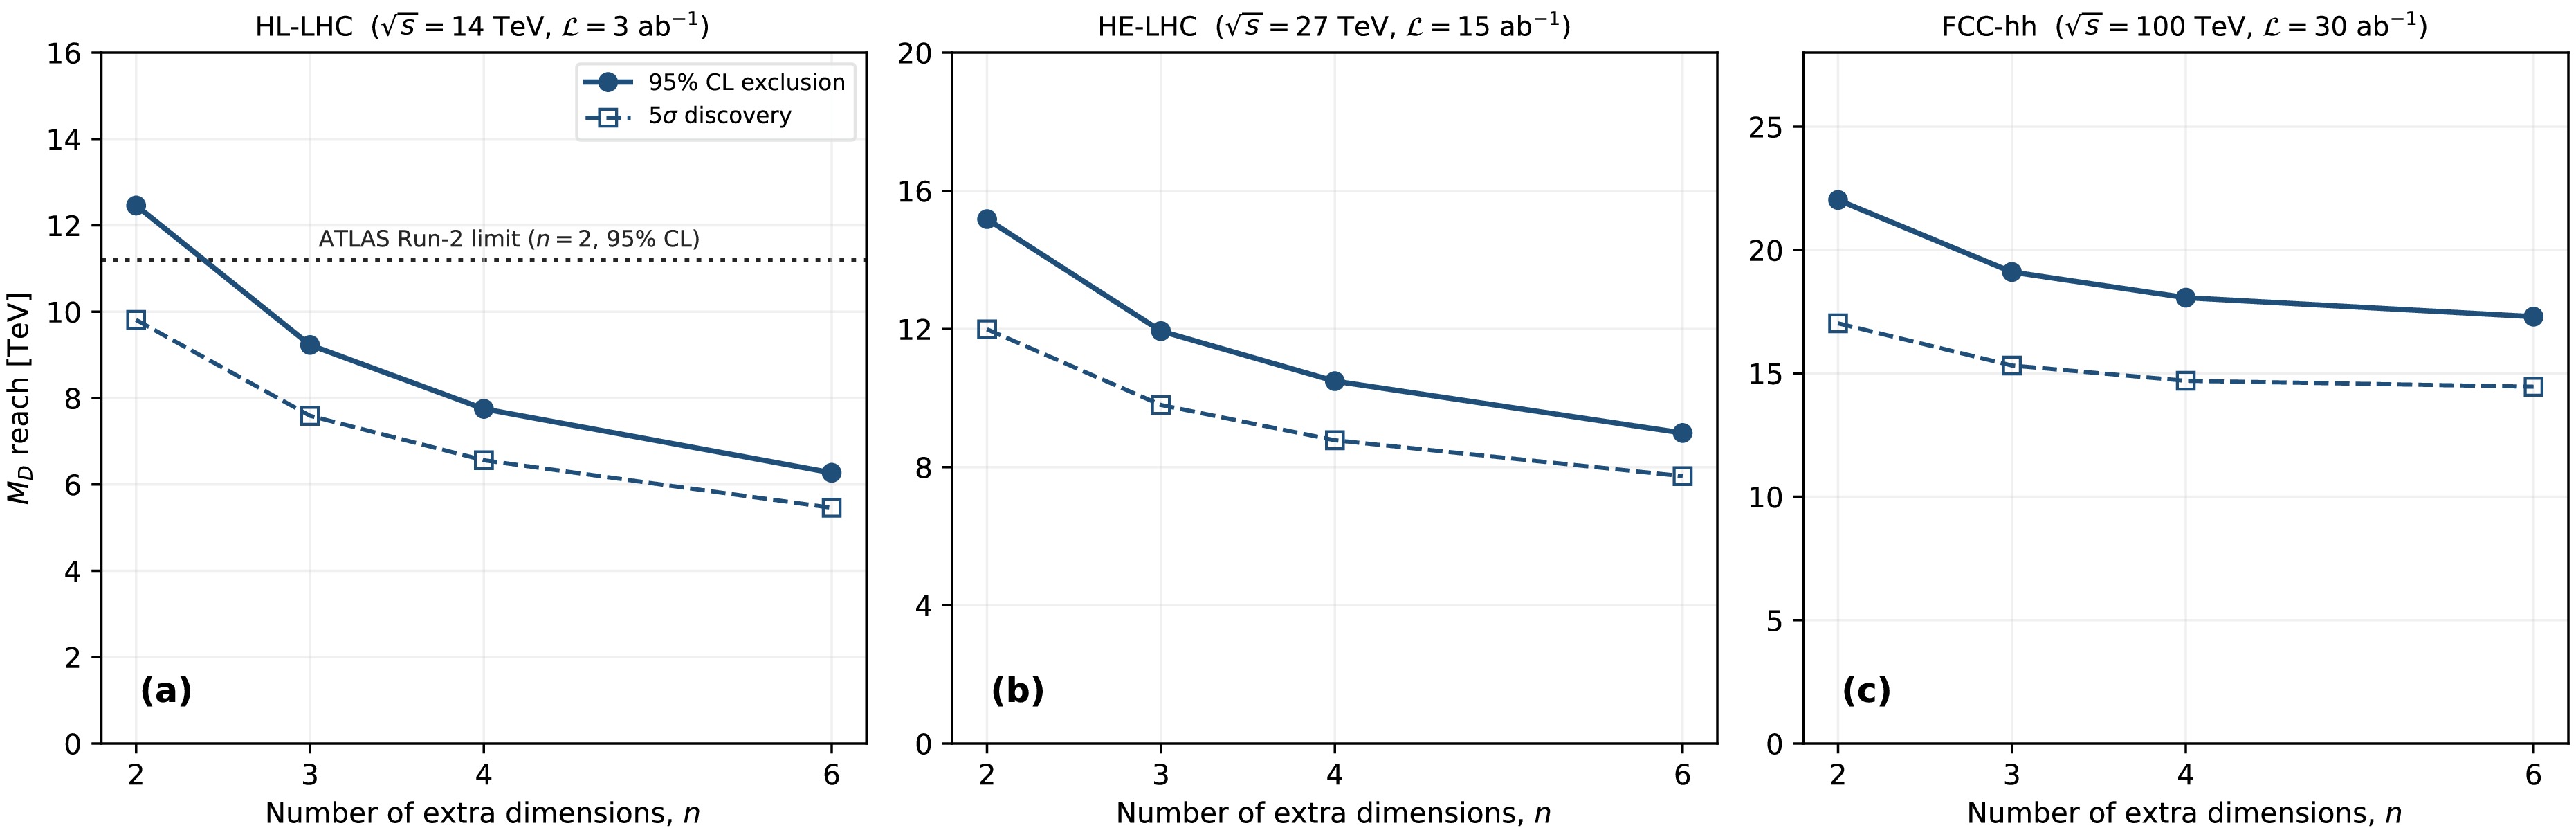
Figure 7. (color online) Projected 95% CL exclusion reach (solid lines, filled circles) and
$ 5\sigma $ discovery reach (dashed lines, open squares) in$ M_D $ as a function of the number of extra dimensions n, for the HL-LHC (a), HE-LHC (b), and FCC-hh (c). The dotted horizontal line in panel (a) indicates the ATLAS Run-2 observed 95% CL limit for$ n=2 $ [9], reproduced here solely as an experimental reference for direct comparison with the HL-LHC projection; the calibration itself is anchored to the expected limits (Sec. 4.5).The most striking feature of these results is the substantial increase in the
$ M_D $ reach across the three collider stages. For$ n=2 $ , the 95% CL exclusion reach increases from$ M_D=11.2 $ TeV (ATLAS Run-2) to 12.5 TeV at HL-LHC, representing an 11% improvement at a modestly higher centre-of-mass energy ($ 13\to14 $ TeV) and with a twentyfold increase in integrated luminosity; the crossing lies well within the simulated grid. The transition to HE-LHC, with its near-doubling of$ \sqrt{s} $ , drives the reach to 15.2 TeV, a 22% improvement over HL-LHC. The step to FCC-hh, with both energy and luminosity gains, extends the reach to 22.0 TeV, a further 45% improvement over HE-LHC. Thus, in the$ n=2 $ exclusion channel, the total improvement from ATLAS Run-2 to FCC-hh is a factor of 2.0. These values reflect the measured$ E_{{\rm{T}}}^{{\rm{miss}}} $ -dependent background scaling of Sec. 4.3, including the measured$ 13\to14 $ TeV step, which by itself lowers the reach at all three colliders by 3–7% depending on n; the comparison with the constant-factor prescription is quantified in Sec. 5.2.The
$ 5\sigma $ discovery reach is systematically lower than the exclusion reach by approximately 13–23% (0.8–5.0 TeV), depending on n and the collider stage, reflecting the larger signal yield required to establish a discovery rather than merely set an exclusion bound. At FCC-hh, the discovery reach for$ n=2 $ extends to 17.0 TeV, well beyond the existing constraints from any current or near-term collider experiment.The reach decreases monotonically with n, as expected from the steeper falloff of the signal cross section at large n (Eq. 2). For
$ n=6 $ at HL-LHC, the exclusion reach of 6.3 TeV lies about 6% above the existing ATLAS Run-2 bound of 5.9 TeV, whereas the$ 5\sigma $ discovery reach of 5.5 TeV falls below that bound, reflecting the steep cross-section suppression at large n. In contrast, the$ n=6 $ HE-LHC and FCC-hh projections both yield a discovery reach substantially above the Run-2 bound. -
The sources considered here enter the projection through two distinct routes. The background uncertainty enters the significance directly as the term
$ \sigma_{B,i} $ of Eq. (4); all other sources are propagated by varying an assumption, recomputing the full chain—significance, crossing, calibration—and taking the induced shift of the projected$ M_D $ reach. The two are therefore not combined at the level of$ \sigma_B $ , but at the level of the reach. Table 3 summarises the budget; the individual items are discussed below.Source Enters through Effect on reach Calibration factor reach variation ±3.8% (propagated + assigned transfer) Background energy scaling $ \sigma_B $ and B≲2% Background composition B ≤ 0.7% Monte-Carlo statistics reach variation ≲0.8% Sample class assignment B ≤ 0.7% Combined (quadrature) ±4.5% Signal yield (assumed ±30%) reach variation ≲9% (additional) Significance estimator reach variation +0.2 to +9.1% (95% CL) Background-table range B +4 to +12% Table 3. Systematic uncertainties in the projected
$ M_D $ reach. The first block is combined in quadrature to yield the experimental projection budget; the last two entries represent prescription choices, quoted separately for the 95% CL reach (the effect of the alternative choice relative to the adopted one) rather than included in the budget.Background scaling. The energy scaling of the background is measured as a function of
$ E_{{\rm{T}}}^{{\rm{miss}}} $ rather than taken as a fixed factor (Sec. 4.3). Its residual uncertainty comprises three components. (i) The statistical precision of the measured ratios: ≈4% on r at the hardest threshold — the fitted$ r(1200\; {\rm{GeV}})=211 $ agrees with the direct counting measurement of 207 — corresponding to ≈1% on the$ M_D $ reach, with the$ 13\to14 $ TeV step measured to ≲2% per threshold. (ii) The leading-order modelling of the shape evolution: we retain a conservative ±10% variation of the fitted slope, with the intercept adjusted so that the fit remains anchored at the pivot threshold$ E_{{\rm{T}}}^{{\rm{miss}}}=750 $ GeV, where slope and intercept are uncorrelated. This corresponds to ≲2% on the reach (at most 2.0% for$ n=2 $ at the FCC-hh) and exceeds the statistical slope uncertainty by factors of 4.5 and 9 at 27 and 100 TeV. (iii) The composition assumption: the non-V+jets component, at most 6.0% of the total across the$ E_{{\rm{T}}}^{{\rm{miss}}} $ range (Sec. 4.3), is scaled with the same measured factor, and a ±50% variation of its scaling shifts the reach by at most 0.7%. For context, the measured$ 13\to14 $ TeV step alone lowers the projected reach by 3–7% relative to treating the 13 and 14 TeV backgrounds as equal, and using the constant factors of Ref. [14] instead of the measured scaling would raise the leading case ($ n=2 $ at the FCC-hh) from 22.0 to 36.2 TeV.Calibration factor. Each
$ C_n $ of Eq. (6) is a ratio of two limits. Two contributions to its uncertainty are distinguished: the numerical precision of the factor at 13 TeV, which is propagated from its two inputs, and its transfer to the other collider energies, which cannot be propagated and is therefore assigned.The published expected limits are quoted to 0.1 TeV. The half-width of the rounding interval, 0.05 TeV, is used as a conservative one-standard-deviation equivalent (a uniform distribution over the interval would give
$ 0.05/\sqrt{3}=0.03 $ TeV); it corresponds to 0.4% ($ n=2 $ ) to 0.8% ($ n=6 $ ). ATLAS publishes no uncertainty on the expected limit itself; the$ \pm1\sigma $ band around it describes the distribution of possible observed outcomes, not the precision of the median expectation. The crossing$ M_D^{{\rm{ours}}} $ carries the Monte Carlo statistical uncertainty of the anchor samples; it is evaluated by fluctuating the selected counts in the thirteen exclusive bins of both bracketing points according to Poisson statistics and recomputing both the combined significance and the crossing (2000 replicas). For a sample of fixed size, the exclusive-bin counts are multinomial rather than Poisson. The resulting corrections — a factor$ (1-p_i) $ in the variance and negative covariances between bins — are of relative order$ p_i $ , the fraction of the sample selected in bin i, and amount to a small fraction of an already small term. The 0.3% uncertainty assigned to the generated cross section is included as an independent term and contributes less than 0.1%. The result is 0.1–0.3% in$ M_D $ , compressed by the steep local slope$ {\rm{d}}\ln Z/{\rm{d}}\ln M_D $ , which ranges from -3.9 ($ n=2 $ ) to -7.4 ($ n=6 $ ). The interpolation systematic is measured for$ n=3 $ and 5 — where the anchor grid has three points — by replacing the log–log linear interpolation with a quadratic through all three points: 0.04% and 0.17%. The larger value is assigned to the remaining n. In quadrature, these give 0.6–0.9% on$ C_n $ . This is smaller than the dispersion of the five factors (1.4%), which supports applying the factors per n rather than as a common average.The transfer of
$ C_n $ across collider energies (Sec. 4.5) is the dominant term. No measurement at a second energy is available to test it, and the closeness of$ C_n $ to unity at 13 TeV does not by itself bound it: effects that compensate at one energy need not compensate at another. Its uncertainty is therefore assigned using the one measured quantity that probes the same mechanism. The collider energy enters the calibration through the hardness of the signal spectrum — the harder the spectrum, the more the signal is concentrated in the highest$ E_{{\rm{T}}}^{{\rm{miss}}} $ bins — and the hardness is also what distinguishes the five anchors at 13 TeV and what the method-dependent part of$ C_n $ responds to (Sec. 4.5). The measured variation of$ C_n $ from the softest anchor ($ n=2 $ ) to the hardest ($ n=6 $ ), 3.7% end to end, is taken as the transfer uncertainty for all n. This is an assumption, namely that the energy dependence of the framework difference is no larger than its measured spectrum dependence at 13 TeV, and not a derived limit. It is consistent with the flat selection-level response of Fig. 3 — a difference that is flat in$ E_{{\rm{T}}}^{{\rm{miss}}} $ transfers unchanged to a harder spectrum — and with the expected direction of the effect: the projected spectra are harder than every anchor, so that for$ n=2 $ and 3 the factor appropriate at the higher energies lies closer to its large-n value and the quoted reach is, if anything, conservative. The same mechanism accounts for the pattern of the estimator variation discussed below. Combined in quadrature with the propagated precision, the calibration uncertainty is 3.8%, which we assign to all n.Signal cross section. The leading-order
$\text{P}{\small{\text{YTHIA}}}$ 8 cross section differs from the signal generation underlying the ATLAS analysis, and this difference is absorbed by the calibration: the matched-benchmark comparison of Fig. 3 shows that the selection-level response itself agrees with ATLAS within a flat 2–6%, so the remaining offset is a normalisation that$ C_n $ anchors to the measured limits. The Run-2 calibration cannot remove the energy-dependent signal-theory uncertainties — PDF, renormalisation and factorisation scales, and parton luminosities at 27 and 100 TeV — which are not evaluated here. Their impact is strongly compressed by the steep$ M_D $ dependence of the cross section: an aggressive ±30% variation of the signal yield shifts the reach by +3.5–6.9% / -4.7–8.7%, largest for$ n=2 $ .Detector resolution. The parameterised smearing is taken from the ATLAS Run-2 performance. The HL-LHC upgrades and the FCC-hh reference detector target performance equal to or better than that of Run-2 in the kinematic regime relevant here, so the currently measured performance provides a conservative floor. The residual sensitivity is small: varying the jet and
$ E_{{\rm{T}}}^{{\rm{miss}}} $ resolutions by ±20% changes the selected signal yield by at most ≈2% over$ E_{{\rm{T}}}^{{\rm{miss}}}>400 $ –1200 GeV, since the projection is driven by the steeply falling$ E_{{\rm{T}}}^{{\rm{miss}}} $ spectrum (falloff scale$ {\approx}180 $ GeV) rather than by the resolution model. This variation probes the resolution model only and does not constitute a treatment of pile-up: the much higher pile-up of the HL-LHC and FCC-hh environments can additionally affect jet multiplicity,$ E_{{\rm{T}}}^{{\rm{miss}}} $ tails, and veto efficiencies, and quantifying that requires experimental simulation beyond the scope of a generator-level study.Significance estimator. The baseline estimator is the combined exclusive-bin construction of Sec. 4.4, matching the ATLAS likelihood binning. Reverting to the single most sensitive inclusive bin used in the ATLAS model-independent results, with the calibration recomputed consistently, would raise the projected 95% CL reach by 0.2% to 9.1%, the largest shift occurring for
$ n=2 $ at the FCC-hh. At$ 5\sigma $ the same reversion lowers the HL-LHC reach for$ n=2 $ and$ n=6 $ by 0.1% and 1.6%, with those crossings lying at low enough$ M_D $ for the combined estimator to gain from the wider spread of the signal over bins. The size and pattern of the shift match those of the transfer effect discussed above under the calibration factor: each estimator carries its own method-dependent part of the 13 TeV calibration, which does not transfer unchanged to a regime where the signal is concentrated in the highest bin, and the two estimators differ most where that part is largest, at low n. This variation is not an uncertainty on the present result but rather the measured size of the estimator choice, and it is not folded into the quadrature sum above; the residual of the uncorrelated-bin approximation within the adopted estimator is covered by the transfer uncertainty assigned to the calibration factor, which is derived from the same n-dependence.Background-table range. The dominant contribution to the combined significance comes from the highest bin tabulated by ATLAS, the open-ended
$ E_{{\rm{T}}}^{{\rm{miss}}}>1200 $ GeV bin. Extending the table beyond that edge would require simultaneous extrapolation of the post-fit yields, the measured energy-scaling ratios, and the relative systematic uncertainty, two of which act in the direction of increased sensitivity; we therefore retain the published range. Estimating the extension from the measured tail slope raises the projected reach by 4–12% depending on collider and n. This estimate uses the single-bin estimator, since the sensitivity is dominated by the highest$ E_{{\rm{T}}}^{{\rm{miss}}} $ bin in the relevant region. The calibration is unaffected, as noted in Sec. 4.5.The estimated total systematic uncertainty in the projected
$ M_D $ reach, obtained by combining in quadrature the calibration uncertainty (±3.8%), the residual uncertainty in the measured background scaling (≲2%), the composition-assumption uncertainty (<0.7%), the uncertainty from the finite Monte Carlo statistics of the signal grids (≲0.8%)4 , and the uncertainty from the inclusive/high-$ \hat{p}_T $ class-assignment choice (<0.7%; moving the boundary from$ 600/700 $ to$ 800/900 $ GeV), with the assigned transfer uncertainty treated as a standard deviation and correlations among the sources neglected, is$ \sqrt{(3.8\%)^2+(2\%)^2+(0.7\%)^2+(0.8\%)^2+(0.7\%)^2}\approx\pm4.5\%. $
Energy-dependent signal-theory uncertainties, which are not explicitly evaluated, are additional to this experimental budget; the assumed ±30% signal-yield variation used as a proxy for them shifts the reach by ≲9%. The two prescription choices in Table 3 are likewise quoted separately.
-
A targeted survey of the existing literature confirms that the combination of three elements adopted in the present work—(i) the ADD model, (ii) the monojet plus missing transverse momentum channel, and (iii) a unified projection across HL-LHC, HE-LHC, and FCC-hh—has not previously been treated within a single, internally consistent framework. We now discuss the relevant prior work, which falls into several distinct categories.
Official HL-LHC and HE-LHC projections. The most extensive prior effort relevant to the present study is the BSM volume of the workshop report on the physics of the HL-LHC and perspectives at the HE-LHC, Ref. [28], which collects projections for a wide variety of BSM scenarios contributed by the ATLAS, CMS, and theory communities. While that report devotes substantial attention to dark-matter mono-X signatures and to a number of related new-physics models, it does not present a dedicated, fully tabulated projection of the ADD large-extra-dimension reach in the monojet channel as a function of both n and the collider stage. Reference [29] similarly focuses on Standard-Model physics and offers no ADD-specific projection. The present study complements these efforts by providing such a dedicated, self-contained ADD reach projection in the monojet channel.
Official FCC-hh projections. For the FCC-hh, the principal reference is the Yellow Report by Mangano et al. [14], supplemented by the FCC Conceptual Design Report [15] and the FCC summary submitted to the 2021 Snowmass process [30]. These documents discuss low-scale gravity in broad terms and indicate FCC-hh sensitivity to
$ M_D $ values of order 40 TeV for$ n=2 $ , but do not provide a detailed n-by-n reach table based on a unified monojet-channel analysis with identical selection criteria across all collider stages. Our value$ M_D^{95\%\,{\rm{CL}}}(n=2)=22.0 $ TeV at the FCC-hh lies below the broad estimates of the$ \sim40 $ TeV class quoted in Ref. [14]. This difference is quantitatively accounted for. Adopting the constant background energy-scaling factors of that reference, our framework would itself yield 36.2 TeV. The reduction therefore follows from the measured$ E_{{\rm{T}}}^{{\rm{miss}}} $ -dependent scaling of Sec. 4.3—which exceeds the constant factor by up to a factor of$ {\approx}6 $ in the high-$ E_{{\rm{T}}}^{{\rm{miss}}} $ signal region—together with the exclusive-bin significance construction and the Run-2-anchored calibration.Complementary low-scale gravity channels. A recent study by Gamsızkan [31] addresses microscopic black-hole production at HE-LHC and FCC-hh in the same ADD framework, using the
$\text{B}{\small{\text{LACK}}}\text{M}{\small{\text{AX}}}$ event generator. That work explores a regime—black-hole formation at$ M_{{\rm{BH}}}> M_D $ with high-multiplicity final states—that is kinematically and phenomenologically complementary to the real-graviton-emission monojet channel considered here. The mass scales accessible in Ref. [31] ($ M_D\sim15 $ TeV at HE-LHC,$ M_D\sim45 $ TeV at FCC-hh) are broadly consistent in order of magnitude with our monojet reach values, providing a useful cross-channel consistency check. A combined analysis exploiting both channels simultaneously is left for future work.Earlier monojet ADD phenomenology. The phenomenology of the monojet channel for ADD signals at
$ \sqrt{s}=14 $ TeV was studied during the planning phase of the LHC, most notably in the classic study of ATLAS sensitivity by Vacavant and Hinchliffe [32] (which reported sensitivity up to$ M_D\approx9.1 $ TeV ($ n=2 $ ) at 100 fb−1), in the early estimates collected in the CMS Physics TDR [33], and in the$\text{P}{\small{\text{YTHIA}}}$ -based study by Ask et al. [20]. Reference [34] derived ADD constraints from LHC Run-2 dijet angular distributions, complementing the direct monojet searches. None of these studies extended their projections to the HL-LHC luminosity, the HE-LHC energy, or the FCC-hh.Summary of the contribution of this work. Within this landscape, the present study makes four contributions. It provides, to the best of our knowledge, the first unified projection of the ADD monojet reach across the three future hadron colliders, with the same selection, significance estimator, and calibration applied throughout. It adopts the post-fit Standard-Model background yields released on
$\mathrm{HEPData}$ in place of the generator-level multi-process simulation typically used in phenomenology studies. It introduces an n-dependent Run-2 calibration, determined directly for all five values of n, that bridges parton-shower-level acceptance and detector-level limits. Finally, it measures the energy scaling of the monojet background as a function of$ E_{{\rm{T}}}^{{\rm{miss}}} $ rather than treating it as a constant factor—to our knowledge, one of the first dedicated determinations in this context, and one that modifies the projected reach by up to ≈39%. -
We assess the sensitivity to the ADD model of large extra spatial dimensions in the monojet plus missing transverse momentum channel at three future hadron collider stages—HL-LHC (
$ \sqrt{s}=14 $ TeV, 3 ab−1), HE-LHC (27 TeV, 15 ab−1), and FCC-hh (100 TeV, 30 ab−1)—within a single framework. We combine$\text{P}{\small{\text{YTHIA}}}$ 8 signal samples with the post-fit Standard-Model background yields released by ATLAS and CMS on$\mathrm{HEPData}$ and evaluate a combined Asimov significance over the exclusive$ E_{{\rm{T}}}^{{\rm{miss}}} $ bins.Two elements underpin the projection. The background is extrapolated with an energy-scaling factor measured as a function of
$ E_{{\rm{T}}}^{{\rm{miss}}} $ from dedicated$ Z+ $ jets and$ W+ $ jets samples, including the$ 13\to14 $ TeV step; this step alone lowers all projections by 3–7%. Using the constant factors of Ref. [14] instead would raise the leading case from 22.0 to 36.2 TeV. The absolute scale is fixed by an n-dependent calibration to the published ATLAS Run-2 expected limits. This calibration is determined directly from dedicated 13 TeV anchor samples for all five values of n ($ C_n $ consistent with unity, mean 1.001, dispersion ±1.4%). The selection response underlying the calibration is validated against the published ATLAS cutflow at a matched benchmark, which it reproduces with a flat ratio of 1.02–1.06.The projected 95% CL exclusion reach in
$ M_D $ for$ n=2 $ extends from the current ATLAS Run-2 bound of 11.2 TeV to 12.5 TeV at the HL-LHC, 15.2 TeV at the HE-LHC, and 22.0 TeV at the FCC-hh, with corresponding$ 5\sigma $ discovery reach values of 9.8, 12.0, and 17.0 TeV. The reach decreases monotonically with n, falling to 6.3, 9.0, and 17.3 TeV for$ n=6 $ . The total extension from Run-2 to the FCC-hh in the$ n=2 $ exclusion channel is a factor of 2.0. The experimental projection uncertainty is ±4.5%; an assumed ±30% signal-yield variation, which stands in for the unevaluated energy-dependent signal-theory uncertainties, shifts the reach by an additional ≲9%. Two prescription choices—the significance estimator and the upper edge of the background table—are quantified separately in Sec. 5.2.Each successive collider stage therefore offers a meaningful increment in reach, with the FCC-hh probing nearly twice the scale accessible today. Beyond the ADD model itself, the combination adopted here—post-fit
$\mathrm{HEPData}$ backgrounds, a measured rather than assumed energy scaling, and an n-resolved calibration anchored to published limits—provides a reproducible template for future-collider phenomenology studies that avoids reliance on fast detector simulations, whose applicability to these environments would itself require validation.
Projected sensitivity to the ADD large extra dimensions model in the monojet plus missing transverse momentum final state at HL-LHC, HE-LHC, and FCC-hh
- Received Date: 2026-06-14
- Available Online: 2027-10-01
Abstract: We present a unified projection of the sensitivity to the Arkani-Hamed–Dimopoulos–Dvali (ADD) model of large extra spatial dimensions in the monojet plus missing transverse momentum final state at three future hadron colliders — the HL-LHC ($ \sqrt{s}=14 $ TeV, 3 ab−1), the HE-LHC (27 TeV, 15 ab−1), and the FCC-hh (100 TeV, 30 ab−1) — for $ n=2,3,4,6 $ extra dimensions, using the same selection, significance estimator, and calibration throughout. Signal samples are generated with $\text{P}{\small{\text{YTHIA}}}$ 8 and combined with the post-fit Standard-Model background yields released by the ATLAS and CMS collaborations on $\mathrm{HEPData}$. The expected significance is constructed by combining the thirteen exclusive $ E_{{\rm{T}}}^{{\rm{miss}}} $ bins of the ATLAS signal region, matching the binning used in the published likelihood fit. Two elements distinguish this analysis. First, the energy scaling of the background to higher $ \sqrt{s} $ — including the $ 13\to14 $ TeV step — is measured as a function of $ E_{{\rm{T}}}^{{\rm{miss}}} $ from dedicated $ Z(\nu\bar\nu) $+jets and $ W(\ell\nu) $+jets samples rather than assumed to be constant, which reduces the projected FCC-hh reach by 39% relative to a constant-factor extrapolation. Second, the framework is anchored to the published ATLAS Run-2 expected 95% CL limits through a transparent n-dependent calibration. This calibration is determined directly for all five values of n (with the $ n=5 $ point serving as a calibration-only anchor) and is found to be consistent with unity (1.001 ± 1.4%); it therefore serves primarily as a consistency check rather than as a substantial correction. Its selection response is independently validated against the published ATLAS cutflow at a matched benchmark. The projected 95% CL exclusion reach in $ M_D $ for $ n=2 $ is 12.5, 15.2, and 22.0 TeV at the three colliders, with corresponding $ 5\sigma $ discovery reaches of 9.8, 12.0, and 17.0 TeV, extending the current ATLAS Run-2 bound of $ M_D>11.2 $ TeV by factors of 1.1–2.0. The calibration scheme is general and provides a template for analogous future-collider studies; the projections should be interpreted within the stated Run-2-anchored detector and uncertainty assumptions.



 DownLoad: