-
Quantum chromodynamics (QCD) constitutes the fundamental theory of the strong interaction. One of the main goals of relativistic heavy-ion collisions is to explore the phase structure of hot and dense QCD matter, which can be displayed in the
$ T-\mu_B $ plane (T: temperature,$ \mu_B $ : baryon chemical potential) of QCD phase diagram. Lattice QCD calculations confirmed that the transition between hadronic gas and quark-gluon plasma (QGP) is a smooth crossover at$ \mu_B $ = 0 [1]. At the large$ \mu_B $ region, QCD-based models predicted that the phase transition is of the first order [2-6]. The QCD critical point (QCP) is the end point of the first order phase transitions boundary. Theoretically, many efforts have been made to locate the critical point in lattice QCD [7-11] and models [12], however its position and even the existence is still not confirmed yet. Therefore, from the experimental side, scientists are performing a systematical exploration of the phase structure of the QCD matter at high baryon density region. The search for the critical point is one of the main goals of the beam energy scan (BES) program at the relativistic heavy-ion collider (RHIC). It is also the main physics motivation for future accelerators, such as facility for anti-proton and ion research (FAIR) in Darmstadt and the nuclotron‐based ion collider facility (NICA) in Dubna. Experimental confirmation of the existence of the QCD critical point will be a milestone of exploring the nature of the QCD phase structure.In the vicinity of the QCP, the correlation length of the system and density fluctuations will become large. In the first phase of beam energy scan at RHIC (BES-I, 2010-2014), the STAR experiment has made two important measurements, which are dedicated to search for the QCP: 1). The measurement of the cumulants of net-proton, net-charge, and net-kaon multiplicity distribution [13–18] in Au+Au collisions at
$ \sqrt{s_{\rm NN}} = $ 7.7-200 GeV. One of the most striking findings is the observation of non-monotonic energy dependence of the fourth order net-proton cumulant ratios ($ C_4/C_2 $ ) in the most central (0%–5%) Au+Au collisions. We observe a minimum dip around 19.6 GeV and large increase at 7.7 GeV. The review of these results can be found in Ref. [19]. 2). The measurement of the light nuclei (deuteron and triton) production as well as derived neutron density fluctuations at RHIC. We observe a non-monotonic energy dependence of the neutron density fluctuations in central (0%–10%) Au+Au collisions with a maximum peak around 19.6 GeV [20, 21]. These non-monotonic behaviors, the dip and peak structures observed around 19.6 GeV, are qualitatively consistent with the theoretical predictions of the signature of the critical point [22-24].The QCD critical point was predicted to serve as an attractor of the trajectory evolution in the
$ T-\mu_B $ plane, which is known as the QCP focusing effect [25, 26]. The entropy over the baryon density ratio$ s/n_b $ is constant along the isentropic trajectory. When the isentropic trajectory passes through the critical region in the$ T-\mu_B $ plane, the transverse velocity ($ \beta_T = p_T/E $ ) dependence of$ \bar{p}/p $ ratio will exhibit anomalous behavior [26]. A detail calculation to demonstrate how the focusing effect could lead to anomalous$ \beta_T $ dependence of$ \bar{p}/p $ ratio has been done [27]. The$ \bar{p}/p $ ratio will exhibit different$ \beta_T $ dependence trends with or without the QCP focusing effect. However, we did not observe this anomaly in$ \beta_T $ dependence of$ \bar{p}/p $ in Au+Au collisions at RHIC-BES measured by the STAR experiment [28]. There are several reasons that could lead to suppressing the focusing effect on$ \bar{p}/p $ . First, the contributions of strong and weak decay to proton and anti-proton are important in heavy-ion collisions [29-31]. Second, final state hadronic interactions between particles will dilute the QCP focusing effect. In this letter, we propose the transverse velocity dependence of$ \bar{d}/d $ ratio or heavier light anti-nuclei to light nuclei ($ ^3\overline{{\rm He}}/^3{\rm He} $ ,$ \bar{t}/t $ , ···) ratios as more robust signatures of searching for the QCP. Assuming thermal production of the light nuclei along the system evolution trajectory, the yield ratio of light nuclei$ \bar{d}/d $ is more sensitive to the$ \mu_{B} $ than$ \bar{p}/p $ , because of the ratio$ r \propto \exp[-2A\times\mu_{B}/T] $ , A is the mass number of the particle. This means the production of light nuclei is more sensitive to the system evolution trajectory in the vicinity of QCP, which will cause the changing of T and$ \mu_{B} $ of the system. One of the other advantages is that the decay contributions for light nuclei is negligible in heavy-ion collisions. In the following, we will formulate the QCP focusing effect on the$ \beta_T $ dependence of$ \bar{d}/d $ and$ ^3\overline{{\rm He}}/^3{\rm He} $ ratios by applying the UrQMD and THERMUS model to calculate the dependence patterns for a hypothetical focusing trajectory. -
To simulate the focusing effect, we assume that the critical point lies at
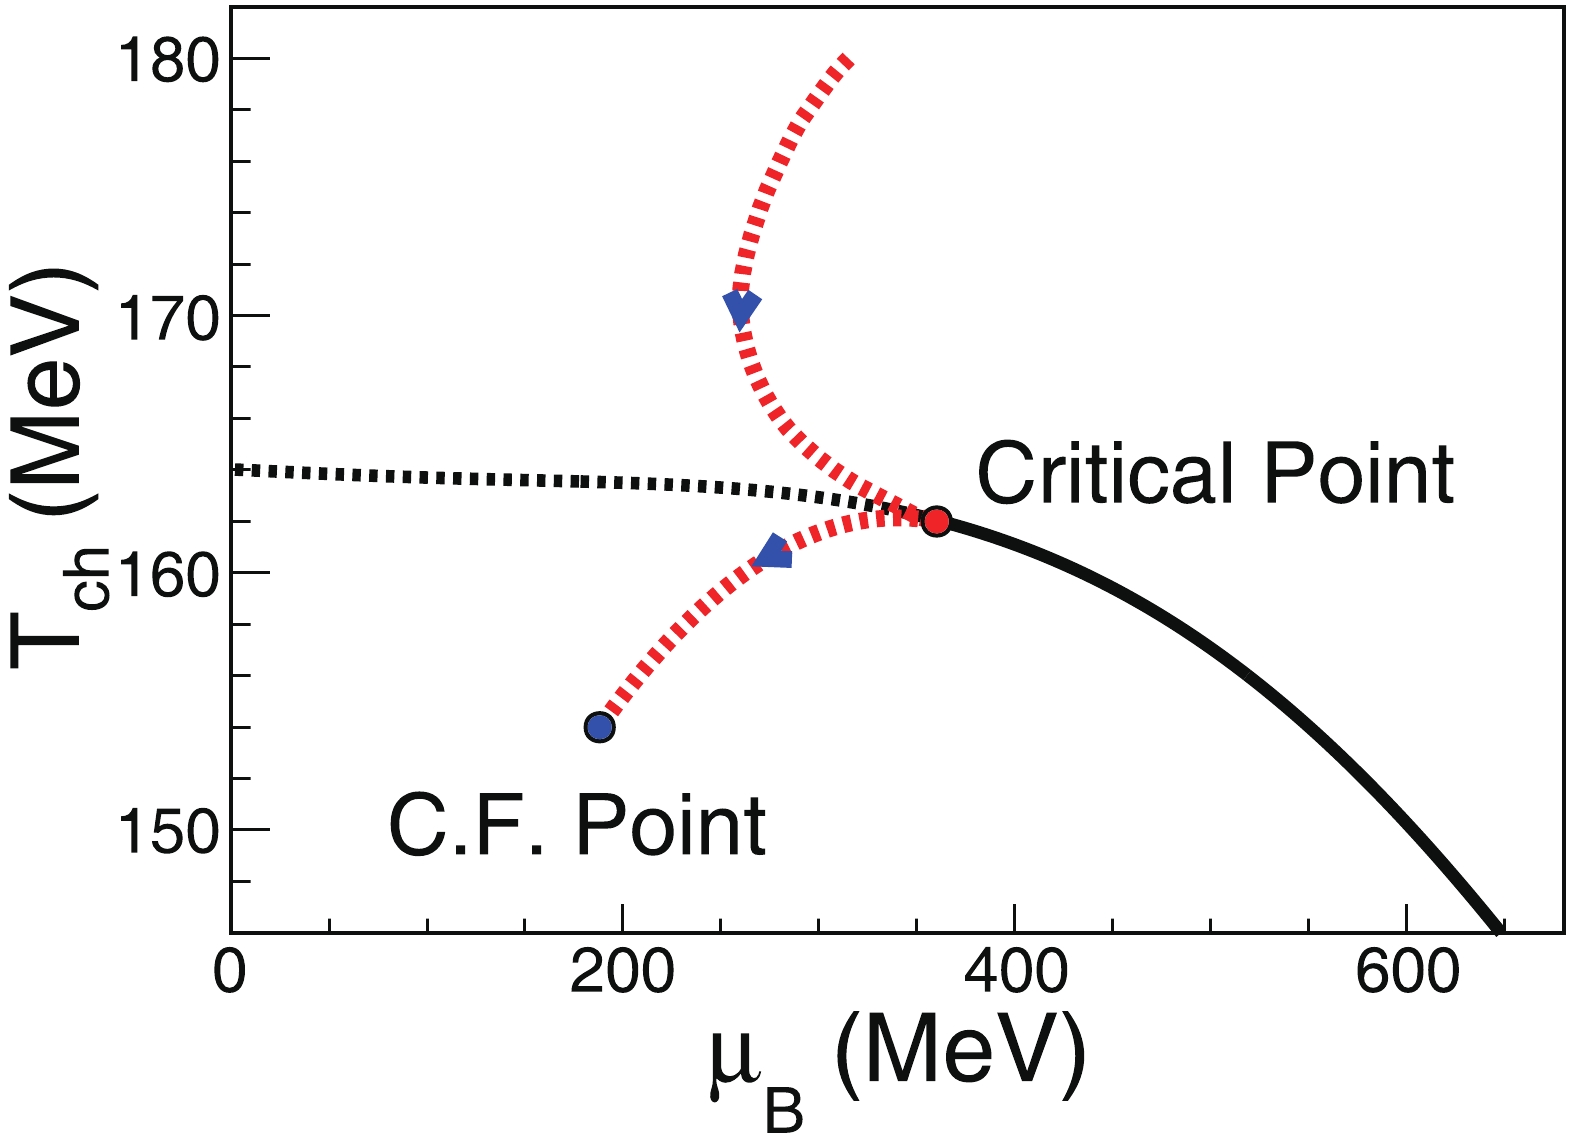
$ (T,\mu_B) = (162,360) $ MeV [8] and the system evolution receives the focusing effect in central Au + Au collisions at$ \sqrt{s_{\rm NN}} = $ 19.6 GeV with a chemical freeze-out point at$ (T_{\rm ch},\mu_B) = (152,188) $ MeV [28]. Besides the starting (critical point) and ending (chemical freeze-out point) points, the hydrodynamic conjectured trajectory with focusing effect is shown in Fig. 1. Following the methods in Refs. [25, 27], the normalized relative time$ t = L/L_{{\rm tot}} $ is used to characterize the time scale of the isentropic trajectory on the QCD phase diagram. The system is evolving from the critical point along the conjectured trajectory to the chemical freeze-out point. The L represents the path length along the trajectory from the critical point to the considered point, and$ L_{{\rm tot}} $ is the total path length along the trajectory from the critical point to the chemical freeze-out point. The system is assumed to be in thermodynamical equilibrium and continues to emit particles. The number of particles A emitted at time t along the trajectory is calculated by
Figure 1. (color online) Sketch of conjectured QCD phase diagram with crossover (black dashed line),
$1^{st}$ order phase transition boundary (black solid lines), and QCD critical point (red solid circle,$(T,\mu_B) = (162,360)$ MeV). A hypothetical system evolution trajectory (red dashed lines) is also plotted and ends with the chemical freeze-out point (blue solid circle).$ D_A(t) = \frac{Y_A[T(t),\mu_B(t)]}{\displaystyle\int_0^1 Y_A(t){\rm d}t}\times Y_A(t = 1), $

(1) where A is the type of particle.
$ Y_A(t) $ is the yield of particle A at a certain point on the trajectory, which is determined by a statistical thermal model THERMUS [32].$ Y_A(t = 1) $ is the yield at the chemical freeze-out point and with the normalization condition$ \int_0^1 D_A(t){\rm d}t = Y(t = 1) $ . This means that the sum of the total number of emitting particles A equals to the particle multiplicity at chemical freeze-out.Time evolution of the particle ratios
$ N_{\bar{p}}(t)/N_p(t) $ ,$ N_{\bar{d}}(t)/N_d(t) $ , and$ N_{^3\overline{{\rm He}}}(t)/N_{^3{\rm He}}(t) $ for the focusing effect trajectory is shown in Fig. 2. Those ratios show an increasing trend as a function of time from the critical point ($ t = 0 $ ) to the chemical freeze-out point ($ t = 1 $ ) caused by the decreasing$ \mu_B/T $ ratio along the focused trajectory. Because of the QCP focusing effect, the time evolution of three particle ratios is different and should be proportional to$ \exp[-2A\times\mu_{B}/T] $ . The$ N_{\bar{d}}(t)/N_d(t) $ is more gradual at the earlier stage and more abrupt at later stage than$ N_{\bar{p}}(t)/N_p(t) $ .
Figure 2. (color online) Time evolution of
$\bar{p}/p$ ,$\bar{d}/d$ , and$^3\overline{{\rm He}}/^3{\rm He}$ ratios along ocusing trajectory.To obtain the
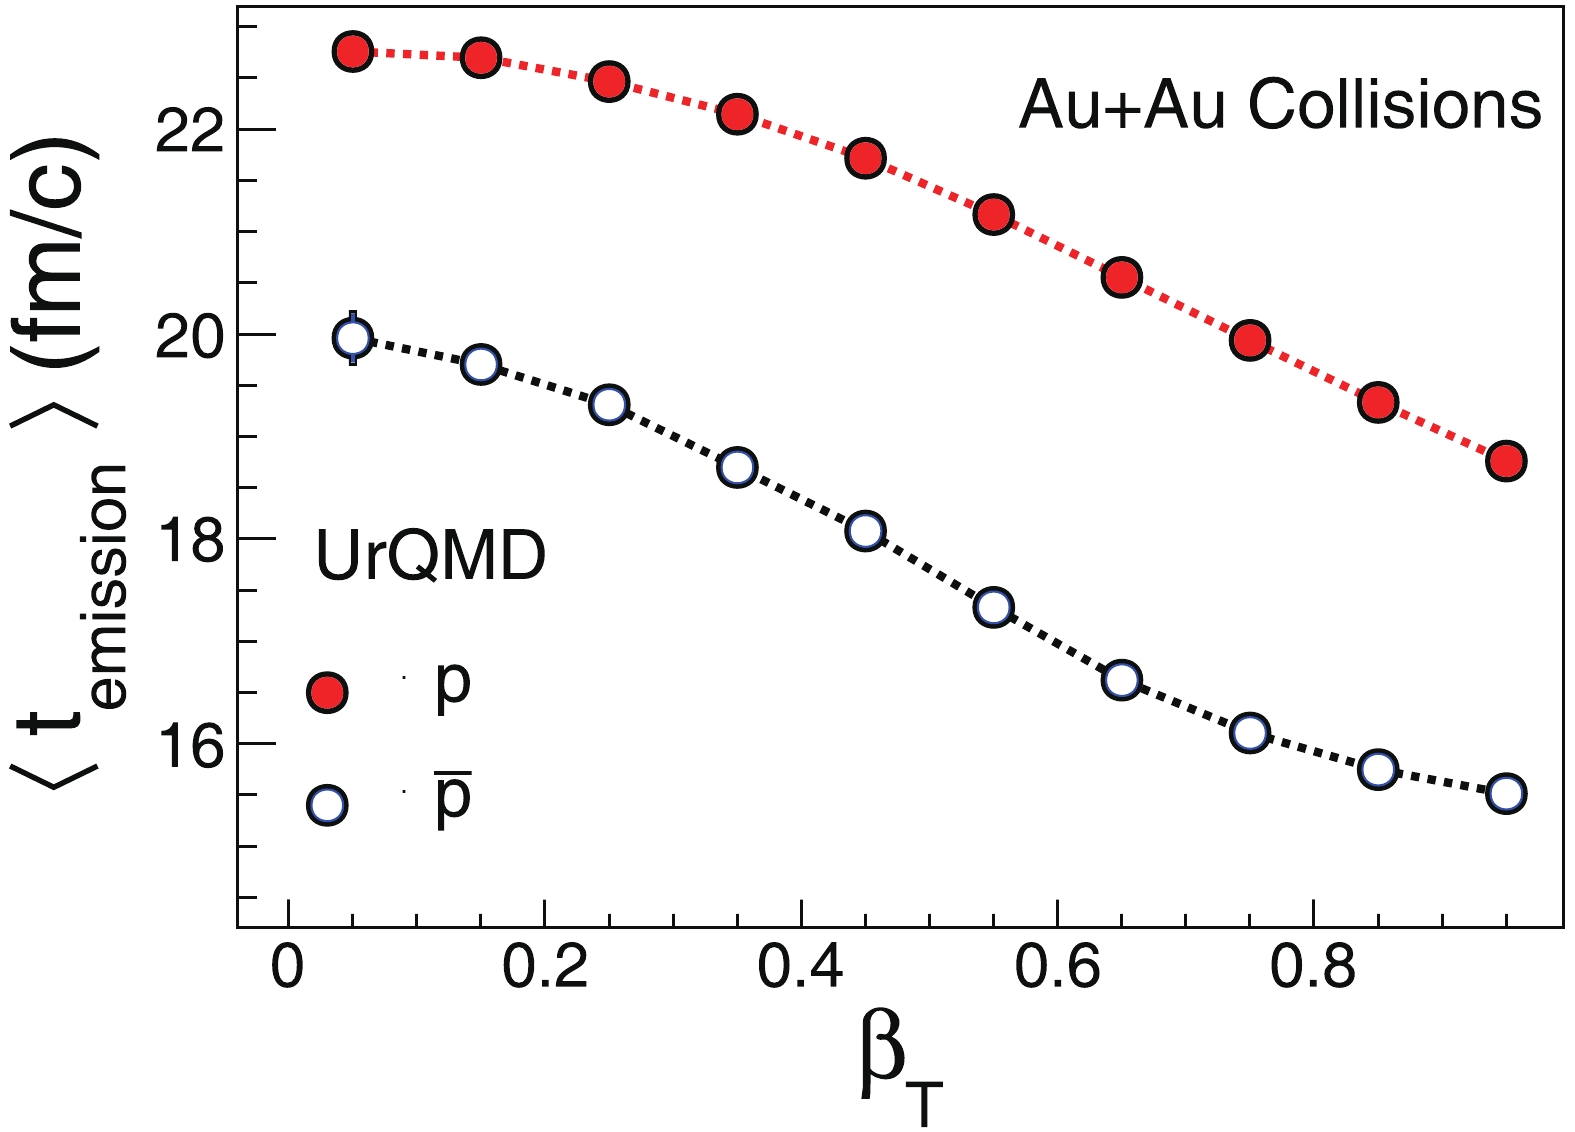
$ \beta_T $ dependence of those ratios, one needs to know the relation between emission time t and transverse velocity$ \beta_T $ . This relation can be obtained quantitatively by transport model, UrQMD [33]. UrQMD is based on relativistic Boltzmann dynamics involving binary hadronic reactions, which are commonly used to describe the freeze-out and breakup of the fireball produced in relativistic heavy-ion collisions into hadrons. Two dimensions of$ \beta_T - t $ distribution for p and$ \bar{p} $ ,$ N_p(\beta,t) $ and$ N_{\bar{p}}(\beta,t) $ are calculated by UrQMD Au+Au collisions at$ \sqrt{s_{\rm NN}} = $ 19.6 GeV with impact parameters$ b < $ 4 fm. The average emission time$ \langle t_{{\rm emission}}\rangle $ as a function of$ \beta_T $ of p and$ \bar{p} $ from UrQMD are shown in Fig. 3. We observe strong$ \beta_T - t $ anti-correlation for p and$ \bar{p} $ during the evolution of the system. This indicates that the particles with larger transverse velocity are freezed-out at earlier time. We also found$ \langle t_{{\rm emission}}\rangle $ for p are larger than$ \bar{p} $ for a certain$ \beta_{T} $ , which suggests larger freeze-out time for protons than anti-protons.
Figure 3. (color online) UrQMD calculations for
$\beta_T$ dependence of average emission time of p and$\bar{p}$ at mid-rapidity$|y| < 0.3$ in Au+Au collisions at$\sqrt {s_{\rm{NN}}} = $ 19.6.Once obtaining the relation between emission time t and transverse velocity
$ \beta_T $ , we can calculate the$ \beta_T $ dependence of$ \bar{p}/p $ ratio (solid triangles) as$ \frac{\bar{p}(\beta_T)}{p(\beta_T)} = \frac{\displaystyle\int N^{{\rm U}}_{\bar{p}}(\beta_T,t){\rm d}t}{\displaystyle\int N^{{\rm U}}_p(\beta_T,t){\rm d}t}, $

(2) where
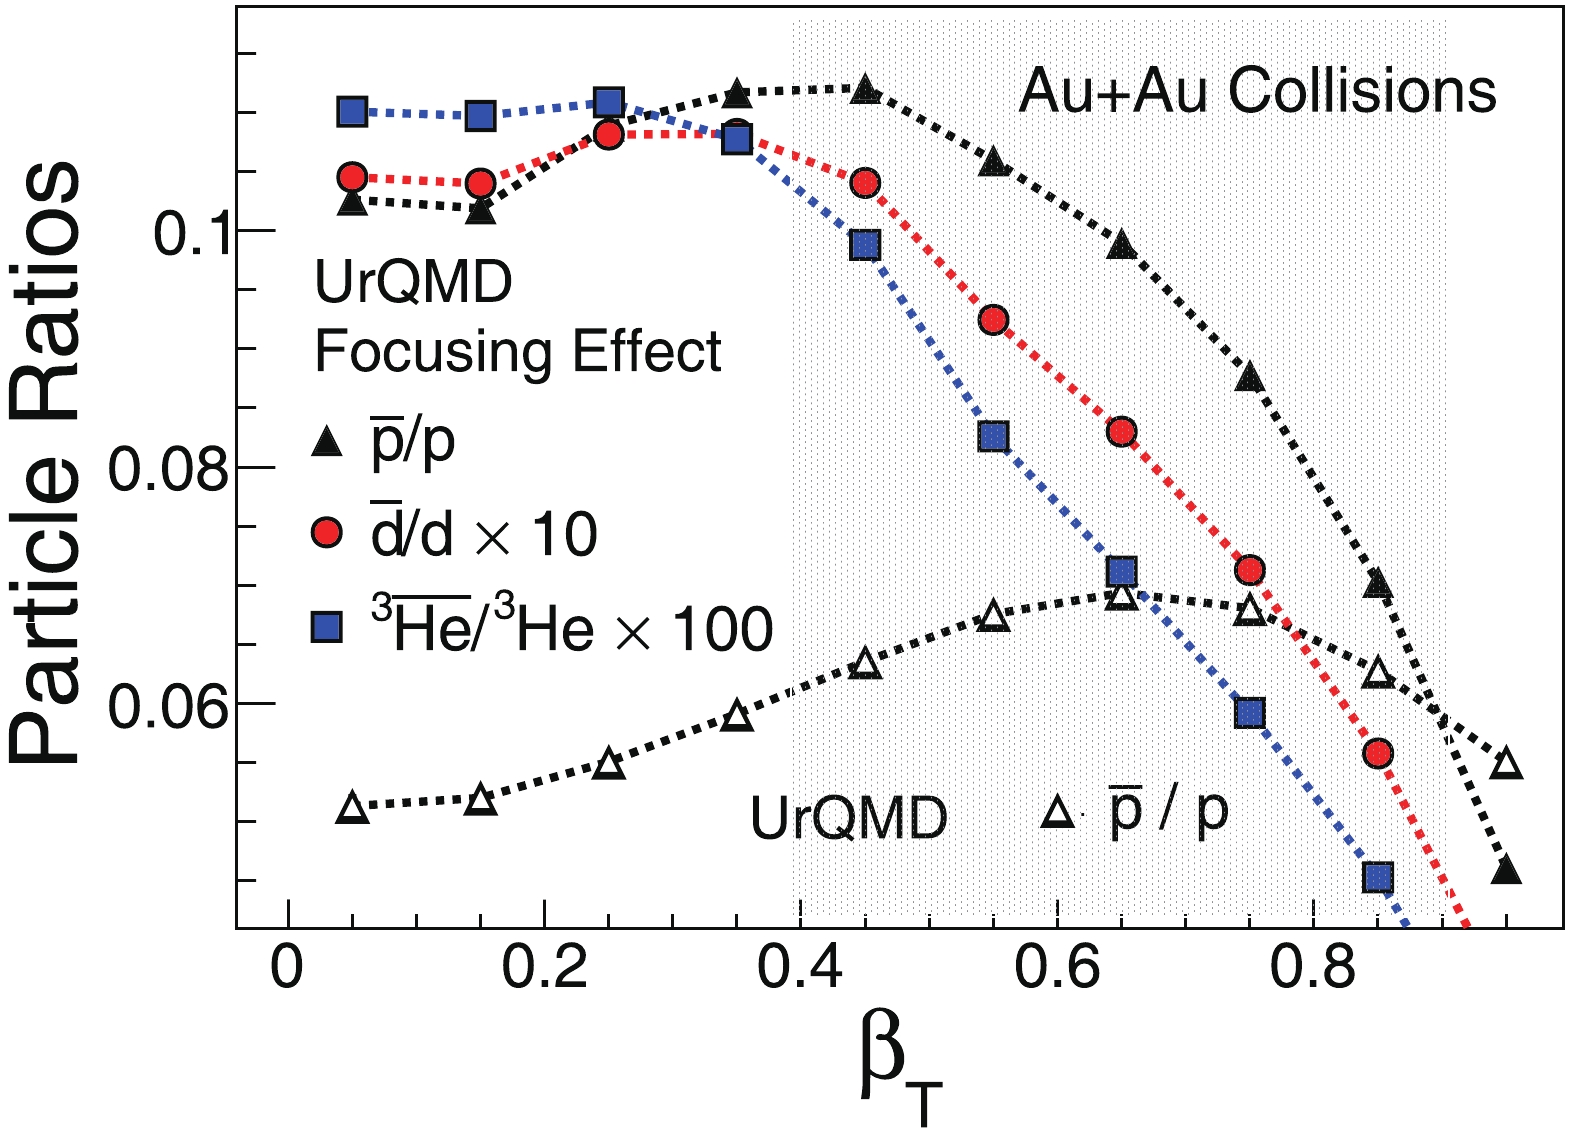
$ N^{{\rm U}}_{\bar{p}}(\beta_T,t) $ and$ N^{{\rm U}}_p(\beta_T,t) $ are the$ \beta_T - t $ distribution for$ \bar{p} $ and p, respectively. The results are shown in Fig. 4. The$ \bar{p}/p $ ratio from UrQMD shows an increasing trend as a function of$ \beta_T $ (upto$ \beta_T $ = 0.6) in the absence of the QCP focusing effect, as the UrQMD does not include the physics of critical point. The$ \bar{d}/d $ and$ ^3\overline{{\rm He}}/^3{\rm He} $ ratios from UrQMD should show similar trends as the$ \bar{p}/p $ ratio, if the probability is similar of forming a light nuclei from nucleons and anti-nuclei from anti-nucleons.
Figure 4. (color online)
$\bar{p}/p$ ,$\bar{d}/d$ , and$\bar{t}/t$ as a function of$\beta_T$ from UrQMD and UrQMD + QCP focusing effect. Shaded band represents range of$p_T / A$ from 0.5 to 2 GeV/c. A depicts the mass number of light nuclei.To obtain the
$ \beta_T $ dependence of the anti-particle to particle ratio with QCP focusing effects, we convolute the time evolution of these ratios from Fig. 2 with the$ \beta_T - t $ distribution from UrQMD. The multiplicity of certain particle with$ \beta_T $ and t is calculated by the thermal model. That means the$ \beta_T - t $ distribution of particle with QCP focusing effect can be calculated by$ N^{{\rm FE}}_{A}(\beta_T,t) = \frac{N^{{\rm U}}_A(\beta_T,t)}{{\displaystyle\int N^{{\rm U}}_A(\beta_T,t)}{\rm d}\beta_T}\times D_{A}(t), $

(3) where
$ A = \bar{p},p,\bar{d},d,\cdots $ . The normalized$ \beta_T - t $ distribution$ \dfrac{N^{{\rm U}}(\beta_T,t)}{\int N^{{\rm U}}(\beta_T,t){\rm d}\beta_T} $ for d and$ \bar{d} $ are assumed to be the same as those for p and$ \bar{p} $ in this study, as the light nuclei are coalesced by nucleons. The$ \beta_T - t $ distribution of$ ^3\overline{{\rm He}} $ and$ ^3{\rm He} $ or heavier light nuclei can also be derived from the equations above. By using$ \beta_T - t $ distribution of particles with the QCP focusing effect obtained in Eq. (3), the$ \beta_T $ dependence of anti-particle to particle ratio can be calculated by Eq. (2).We show the
$ \beta_T $ dependence of$ \bar{p}/p $ ,$ \bar{d}/d $ , and$ ^3\overline{{\rm He}}/^3{\rm He} $ ratios with QCP focusing effect in Fig. 4. The$ \beta_T $ dependence of$ \bar{t}/t $ (triton) is similar to the results of$ ^3\overline{{\rm He}}/^3{\rm He} $ owing to the similar particle yield of the two types of particle. By comparing the$ \bar{p}/p $ results from pure UrQMD calculations with those receiving the QCP focusing effect, we find very different$ \beta_T $ dependence trends. This means the QCP focusing effect can lead to anomaly in$ \beta_T $ dependence of anti-particle to particle ratio. We observed that the slope of these ratios are almost flat at low$ \beta_T $ and become negative at higher$ \beta_T $ . In our study, this shows that the heavier light nuclei are more sensitive to QCP. The heavier the particle is, the steeper slope we can observe. However, the production for anti-light nuclei is difficult to be measured at lower collision energy [34]. Thus, we propose using$ \beta_T $ dependence of anti-deuteron to deuteron ratio to search for QCD critical point in heavy-ion collisions.Experimentally, one needs to measure the
$ \beta_T $ dependence of$ \bar{p}/p $ ratios as a function of energy, centrality, and rapidity and perform linear fits to obtain slopes. Negative slopes could indicate the system trajectories have passed through the critical region, and QCP is located on the right of the chemical freeze-out point of this collision energy due to the focusing effect. Then, a finer scan by looking at rapidity and centrality dependence of the slopes can further help to locate the QCP and the width of the critical region in the QCD phase diagram. The$ p_{T} $ spectra of$ p(\bar{p}) $ and$ d(\bar{d}) $ at mid-rapidity have been measured in Au+Au collisions by the STAR experiment at RHIC BES-I [34-37] with energies$ \sqrt{s_{\rm NN}} = $ 7.7-200 GeV. In Fig. 5, the$ \beta_T $ dependence of 0%–5% collision centrality for$ \bar{p}/p $ and 0%-10% for$ \bar{d}/d $ ratios are shown. The longitudinal momentum$ p_z $ is smaller than the energy of particle at mid-rapidity, and the approximation$ \beta_T = p_T/E\approx $ $p_T/ \sqrt{m_0^2+p^2_T} $ is used in our analysis, where E and$ m_0 $ are the energy and mass of particle. We performed linear fits to these data and found positive slopes for$ \beta_T $ dependence of$ \bar{p}/p $ . The positive slopes for$ \beta_T $ dependence of$ \bar{d}/d $ are also observed for all energies except 19.6 GeV. The decreasing trend of$ \bar{d}/d $ at high$ \beta_T $ in central Au+Au collisions at$ \sqrt{s_{\rm NN}} = $ 19.6 GeV is consistent with the trend in Fig. 4 with QCP focusing effect. If the anomaly in$ \beta_T $ dependence of$ \bar{d}/d $ at 19.6 GeV is indeed due to the QCP focusing effect, this indicates that the system evolution trajectories have passed through the critical region, and the$ \mu_B $ of the QCP should be larger than the chemical freeze-out$ \mu_B $ of 19.6 GeV. Currently, we observe a positive slope for the$ \beta_T $ dependence of$ \bar{d}/d $ at 14.5 GeV and 11.5 GeV. However, this could be due to the limited statistics, which makes it difficult to measure the high$ \beta_T $ region, especially for$ \bar{d} $ .
Figure 5. (color online)
$\beta_T$ dependence of 0%–5% central$\bar{p}/p$ (left) and 0%–10% central$\bar{d}/d$ (right) are derived from the$p_{T}$ spectra in Au+Au collisions measured by the STAR experiment at RHIC-BES energies [34-36]. Dashed lines depict the linear fit. Error bars shown in the figure combine both systematic and statistical errors. -
We studied the QCP focusing effect of
$ \beta_T $ dependence on$ \bar{p}/p $ ,$ \bar{d}/d $ , and$ ^3\overline{{\rm He}}/^3{\rm He} $ ratios. The focusing effect is modeled by convoluting the particle density along the focused trajectories and the$ \beta_T - t $ distribution from the UrQMD model. The focusing effect will lead to a decreasing anti-particle to particle ratio when increasing$ \beta_T $ . We examined and performed a linear fit to the$ \beta_T $ dependence of$ \bar{p}/p $ and$ \bar{d}/d $ , which are calculated from the STAR measured$ p_{T} $ spectra. We observed that only the fitting slope of the$ \bar{d}/d $ at$ \sqrt{s_{\rm NN}} = $ 19.6 GeV is negative. The negative slope can be qualitatively explained in term of the QCP focusing effect, which might indicate that the system evolution trajectory at$ \sqrt{s_{\rm NN}} = $ 19.6 GeV has passed through the critical region. This anomaly could be potentially connected with the dip and peak structures observed at 19.6 GeV in the measurements of net-proton fluctuations and neutron density fluctuations, respectively, by the STAR experiment. We can make more precise measurements and pose further constraint on the$ \mu_B $ value of QCP in the second phase of beam energy scan program (BES-II, 2019-2021) at RHIC [38]. Furthermore, since$ \mu_B $ depends on rapidity, we could also perform a rapidity scan for the$ p_T $ dependence of$ \bar{d}/d $ at each energy. This might allow us to map out the location of the QCP with a finer$ \mu_B $ step. Finally, we predicted that the$ \beta_T $ dependence of heavier anti-light nuclei to light nuclei ratio, such as$ ^3\overline{ \rm{He}} / ^3 \rm{He} $ and$ \bar{t}/t $ , are more sensitive to the QCP focusing effect.We thank Dr. Nu Xu for the fruitful discussions.
Search for QCD critical point by transverse velocity dependence of anti-deuteron to deuteron ratio
- Received Date: 2019-09-26
- Available Online: 2020-01-01
Abstract: We propose the transverse velocity (


 Abstract
 HTML
HTML Reference
 Related
 PDF
PDF


 DownLoad: