


 Abstract
 HTML
HTML Reference
 Related
 PDF
PDF


-
In the last few decades, many charmonium-like states, termed as X, Y, Z states, were discovered experimentally, providing a good platform for the study of multiquark dynamics [1-7]. Among various explanations of the internal structure of these states, the hadronic molecule, which is analogous to the deuteron, plays an important role as the predictions of these states can be made with controlled uncertainty [4, 7].
In general, it is not easy to identify one state as the hadronic molecular state dynamically generated from hadron-hadron interactions, as the possible mixing of various configurations exists. One way to unambiguously identify a hadronic molecule or multiquark state involves the observation of resonances decaying into a heavy quarkonium plus a meson with nonzero isospin meson, or plus a light baryon. For example, the first charged charmonium-like state,
$ Z_c(4430) $ was reported in the$ \pi^- \psi(2S) $ mass distribution of$ B\to K \pi^- \psi(2S) $ by the Belle Collaboration [8, 9], and confirmed by the LHCb Collaboration seven years later [10]. In 2013, the$ Z_c(3900) $ was observed in the$ \pi^- J/\psi $ invariant mass distribution of$ e^+e^-\to \pi^+\pi^- J/\psi $ by the BESIII and Belle Collaborations [11, 12]. To date, several$ Z_c $ states have been reported experimentally in different processes [1], and the hadronic molecules and tetraquark states have been proposed for their internal structures, opening a new window for understanding the non-perturbative properties of quantum chromodynamics (QCD).A search for more
$ Z_c $ states, especially around the lowest-lying thresholds$ D\bar{D} $ ,$ D\bar{D}^* $ , and$ D^*\bar{D}^* $ , would be helpful to understand the internal structures of the$ Z_c $ states, along with hadron spectroscopy. Recently, one resonance$ Z_c(4000) $ , with a$ D^*\bar{D}^* $ molecular nature and quantum numbers of$ I^G(J^{PC}) = 1^-(2^{++}) $ , was predicted in Ref. [13], wherein a thorough investigation of the$ D^*\bar{D}^* $ and$ J/\psi\rho $ interactions was performed by considering the vector exchanges within the local hidden gauge approach. The channel$ J/\psi\rho $ is open for decay, and is responsible for a width of the order of 100 MeV. Due to the quark components and isospins of$ J/\psi $ and$ \rho $ in the final state, any resonance observed in the$ J/\psi\rho $ channel would be unambiguously interpreted as an exotic state$ Z_c $ , as opposed to the$ c\bar{c} $ state. A$ Z_c $ state with a mass around 4000 MeV and$ J^P = 2^+ $ was also predicted in the QCD sum rules [14-16] and color flux-tube model [17].The weak decays of heavy mesons and baryons have proved to be an important tool to identify molecular [3-6, 18-21]. For example, the analysis of LHCb measurements of the reaction
$ B\to J/\psi\phi K $ [22] shows the existence of the$ X(4160) $ resonance with the$ D^*_s\bar{D}^*_s $ molecular nature [23], and also provides a natural interpretation of the considerably large width of the$ X(4140) $ [22]. In addition, two$ D^*\bar{D^*} $ molecular states,$ X(3930) $ and$ X(3940) $ , predicted in the coupled channel approach, where the vector-vector interactions are described by the Lagrangian of the hidden gauge formalism [24], have also been found to play an important role in the$ J/\psi\omega $ mass distribution of the reaction$ B^+\to J/\psi\omega K $ [25]. In this paper, we will investigate the role of$ Z_c(4000) $ in the reaction$ B^{-} \rightarrow J/\psi \rho^0 K^{-} $ . To date, only the Belle Collaboration has reported the observation of the exclusive decay process$ B^+\to J/\psi K_1(1270)^+, K_1(1270)\to K\pi\pi $ , and measured the branching fraction of Br$[B^+\to J/\psi K^+_1(1270)] = (1.80\pm 0.34\pm 0.39)\times 10^{-3}$ [26]. This also shows that the clustering near$ M_{\pi\pi}\approx M_{\rho} $ and$ M_{K\pi\pi}\approx 1.27 $ GeV is consistent with the expectations for$ K_1(1270)\to K\rho $ decays [26]. As the dominant decay channel of$ K_1(1270) $ is$ \rho K $ [27], this implies that the reaction$ B^-\to J/\psi \rho^0 K^- $ is accessible experimentally.It should be noted that the
$ X(3872) $ was observed in the decay$ B^\pm \to J/\psi K^\pm \pi^+\pi^- $ by the Belle, BaBar, CDF, and LHCb Collaborations [28-33]. However, no significant structure has been observed around 4000 MeV in the$ J/\psi\pi^+\pi^- $ mass distribution of$ B^\pm\to J/\psi K^\pm\pi^+\pi^- $ [28-33], which implies that the branching fraction of$ B^\pm\to Z_c(4000)K^\pm\to J/\psi \pi^+\pi^- K^\pm $ , with$ K^\pm $ in D-wave, is less than that of$ B^\pm\to X(3872)K^\pm\to J/\psi \pi^+\pi^- K^\pm $ , with$ K^\pm $ in P-wave. In the case of the$ J/\psi\pi^+\pi^- $ mass distribution, one of the dominant background sources comes from the$ K_1(1270) $ , which mainly contributes to the region of$ 4300<M_{J/\psi\rho}<4700 $ MeV if the events of the$ \rho $ meson are selected; this issue will be discussed later. In this paper, we will demonstrate that a more precise measurement of the$ J/\psi \pi^+\pi^- $ mass distribution around 4000 MeV and a better understanding of the background are critical for verifying the existence of the predicted$ Z_c(4000) $ state.This paper is organized as follows. In Sec. 2, we will present the mechanism of the reaction
$ B^-\to J/\psi \rho^0 K^- $ , and the results and discussion are detailed in Sec. 3. Finally, the summary is presented in Sec. 4. -
In analogy to Refs. [23, 25], the mechanism of the reaction
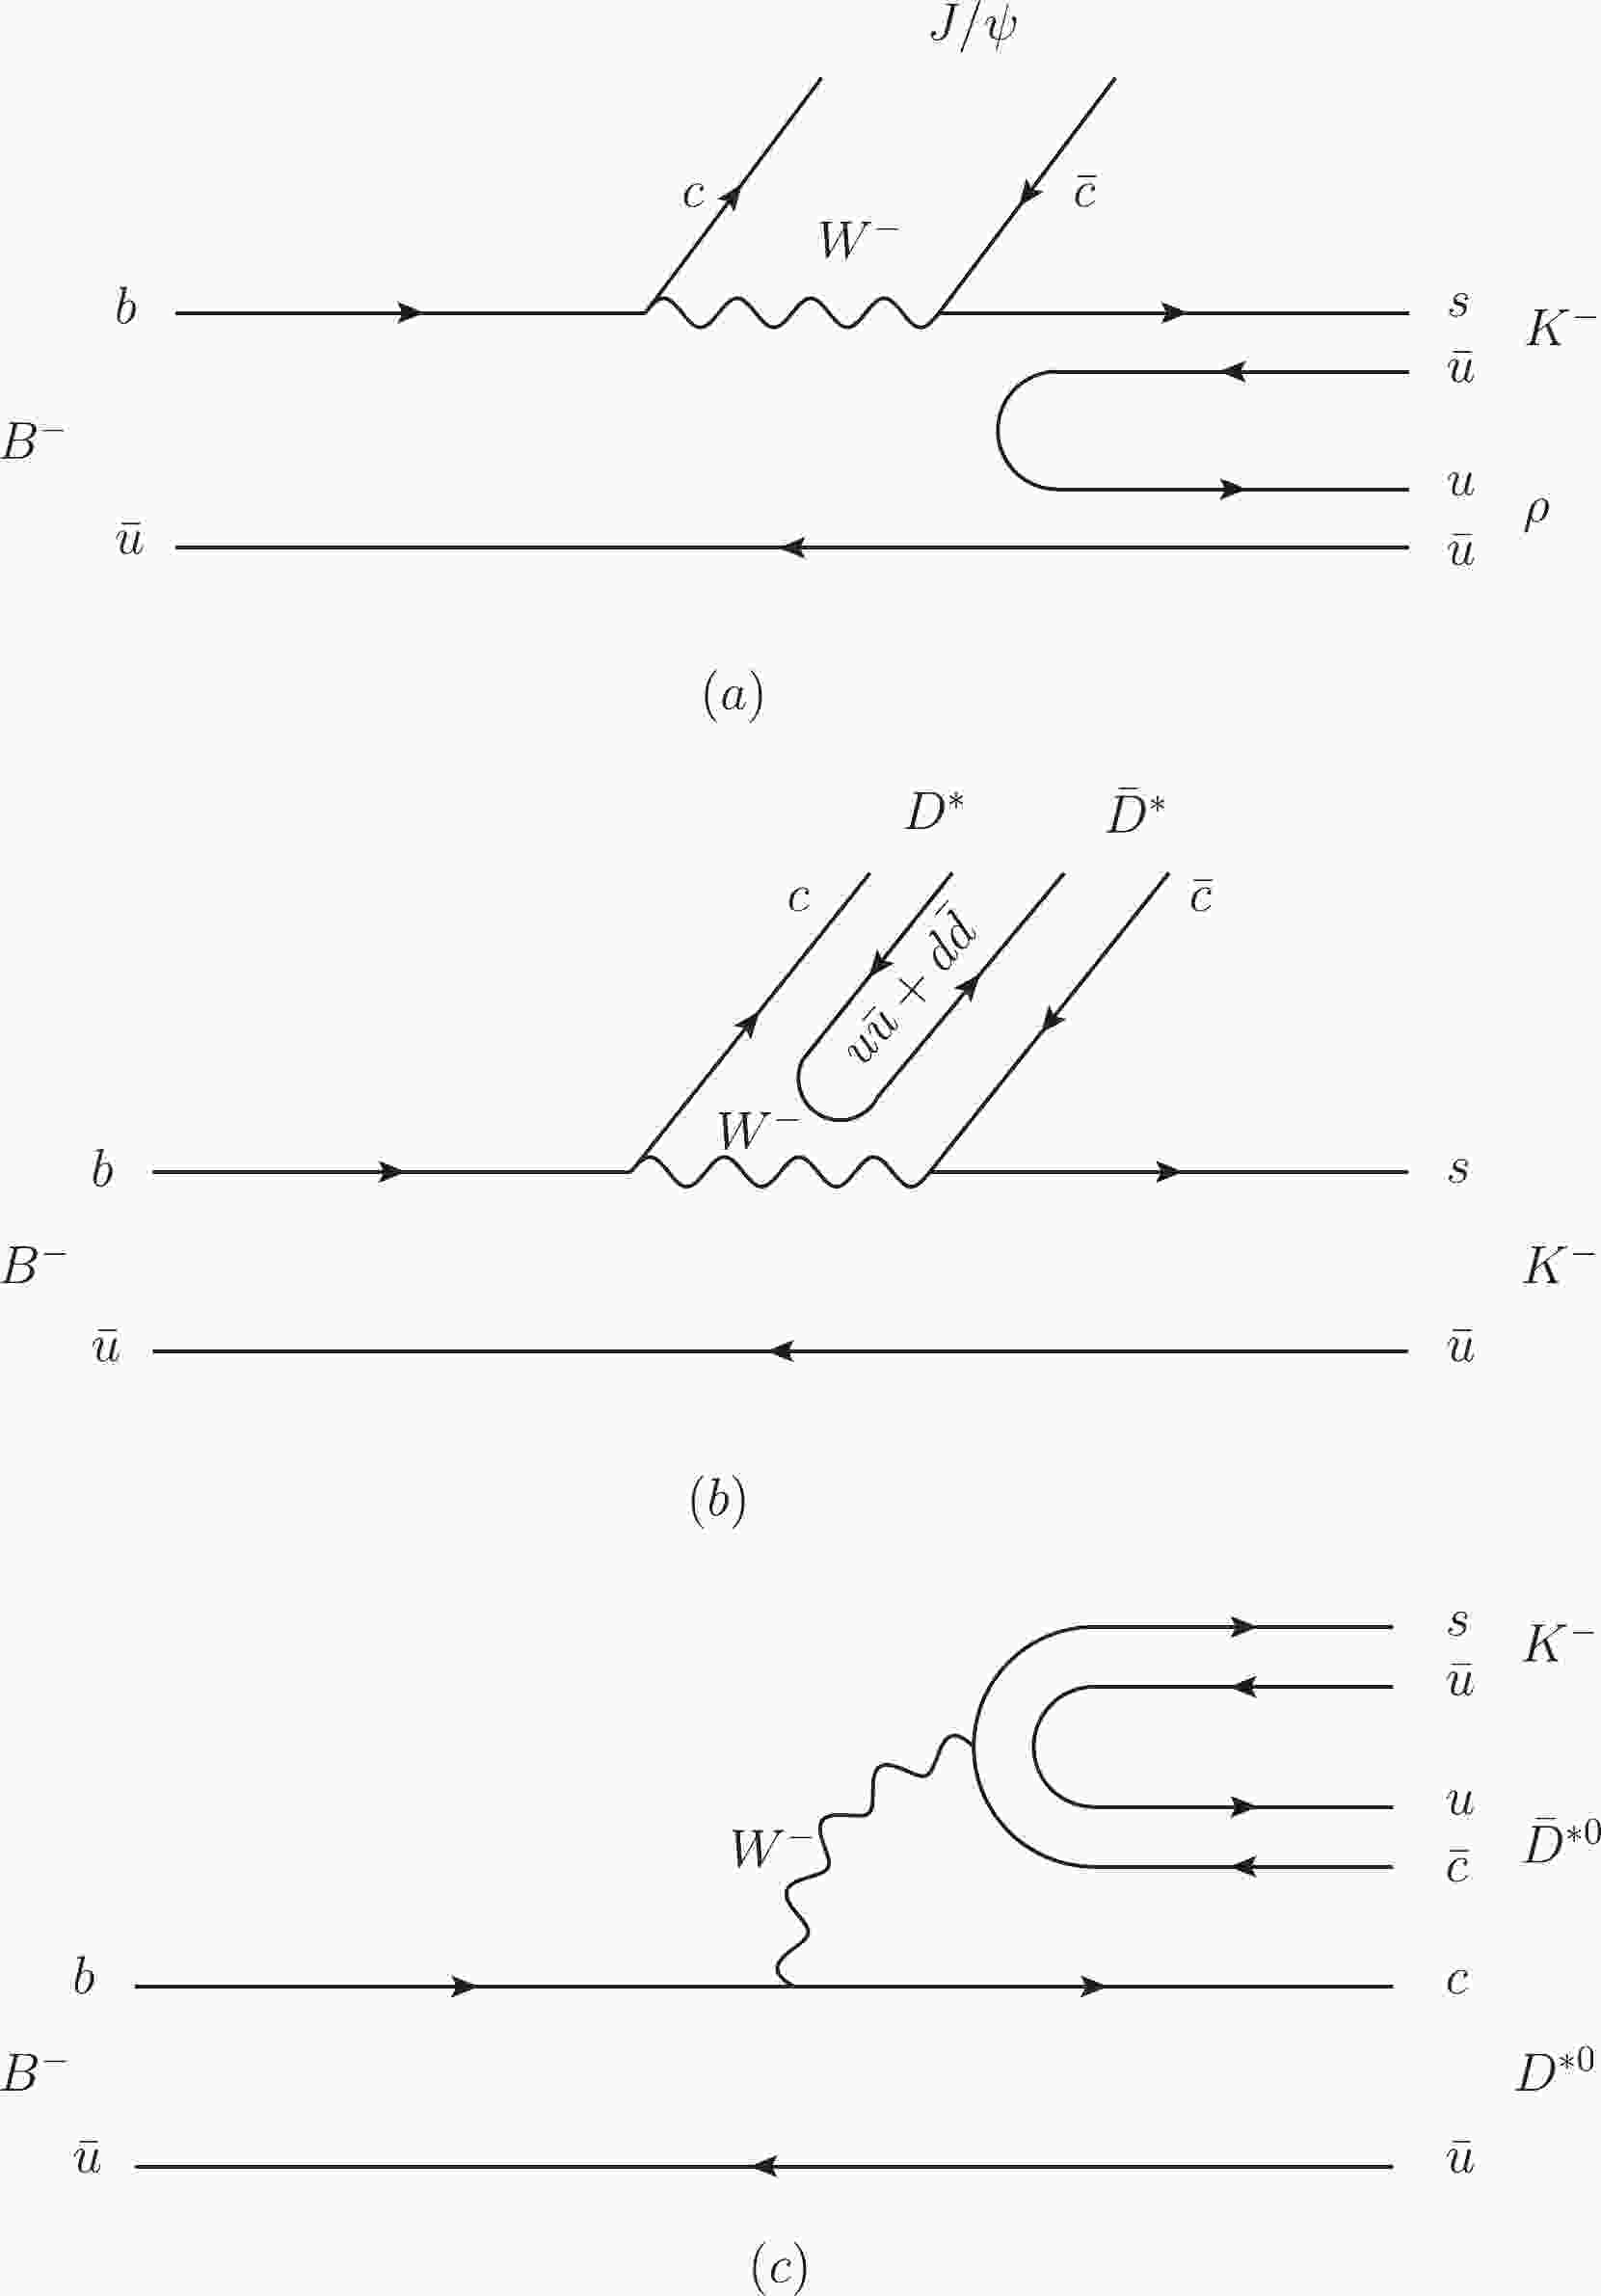
$ B^-\to J/\psi \rho^0 K^- $ at the quark level can be depicted as shown in Fig. 1. The b quark first weakly decays into a c quark and$ W^- $ boson, and then the$ W^- $ boson couples to a$ \bar{c} $ quark and an s quark. Fig. 1(a) shows the internal emission, where c and$ \bar{c} $ go into$ J/\psi $ , and the$ s\bar{u} $ component is hadronized with the$ \bar{u}u $ pair, created from the vacuum with the quantum numbers of vacuum, to$ \rho K^- $ . As the state$ Z_c(4000) $ couples strongly to$ D^*\bar{D}^* $ , the$ D^*\bar{D}^* $ system can be produced primarily, followed by the transition to the final state$ J/\psi\rho $ . Figure 1(b) shows the internal emission mechanism of the reaction$ B^-\to D^*\bar{D}^* K^- $ , where c and$ \bar{c} $ hadronize with the$ \bar{q}q $ pair, created from the vacuum, to the final state$ D^*\bar{D}^* $ . Because the isospin of the created$ \bar{q}q $ is 0, which leads to the isospin$ I = 0 $ for the$ D^*\bar{D}^* $ system, the diagram shown in Fig. 1(b) has no contribution to the reaction of$ B^-\to J/\psi \rho^0 K^- $ . In addition, we can also observe the mechanism of external emission, as shown in Fig. 1(c), which is color-favored with respect to the internal emission. Here, the$ s\bar{c} $ component from the$ W^- $ decay, together with$ \bar{u}u $ , is hadronized to produce$ \bar{D}^{*0} K^- $ , and the remaining$ c\bar{u} $ leads to$ D^{*0} $ .
Figure 1. Microscopic quark level production of the
$B^-$ decay. (a) The internal emission of the$B^-\to J/\psi s\bar{u}$ decay and hadronization of$s\bar{u}$ through$\bar{u}u$ with vacuum quantum numbers. (b) The internal emission of the$B^-\to K^- c\bar{c}$ decay and hadronization of$c\bar{c}$ through$\bar{q}q$ with vacuum quantum numbers. (c) The external emission of the$B^-\to D^{*0} \bar{c}s$ decay and hadronization of$\bar{c}s$ through$\bar{q}q$ with vacuum quantum numbers.The tree level diagrams of the
$ B^-\to J/\psi \rho^0 K^- $ reaction, and the final state interactions of$ J/\psi \rho $ and$ D^{*0}\bar{D}^{*0} $ , are shown in Figs. 2(a) and (b), respectively. The tree level amplitude for the$ B^-\to J/\psi \rho^0 K^- $ decay in S-wave can be expressed as,
Figure 2. Mechanisms for the
$B^-\to J/\psi\rho^0 K^-$ reaction. The (a) tree diagram, (b)$J/\psi\rho$ final state interaction, and (c) term of the intermediate$K_1(1270)$ .$ {\cal{M}}^{(a)} = A \times \vec\epsilon_{J/\psi}\cdot \vec\epsilon_{\rho}, $

(1) where
$ \vec\epsilon_{J/\psi} $ and$ \vec\epsilon_{\rho} $ are the polarization vectors for$ J/\psi $ and$ \rho $ , respectively, and A represents the normalization factor of the vertex$ B^-\to J/\psi\rho^0 K^- $ . It should be noted that we consider the rest frame of the resonance produced, where the momenta of$ J/\psi $ and$ \rho $ are small with respect to their masses, thus leading us to neglect the$ \epsilon^0 $ component. This is actually very accurate for these momenta, as can be seen in Appendix A of Ref. [34]. For the final state interactions of the$ J/\psi\rho $ and$ D^*\bar{D}^* $ final state interaction, as shown in Fig. 2(b), the$ K^- $ in D-wave should match the angular momentum of$ B^- $ , with the amplitude given by [23, 25],$ \begin{split} {\cal{M}}^{(b)} =& \frac{B}{|\vec{k}_{\rm{ave}}|^2} \left( G_{J/\psi \rho} t_{J/\psi\rho, J/\psi\rho} \right. \left. +3C\,\frac{1}{\sqrt{2}} G_{D^*\bar{D}^*} t^{I = 1}_{D^*\bar{D}^*, J/\psi\rho} \right) \\ & \times \left(\vec{\epsilon}_{J/\psi}\cdot \vec{k}\,\vec{\epsilon}_{\rho}\cdot \vec{k} -\frac{1}{3}|\vec{k}|^2 \vec{\epsilon}_{J/\psi}\cdot \vec{\epsilon}_{\rho} \right), \end{split} $

(2) where
$ \vec{k} $ is the momentum of$ K^- $ in the$ J/\psi\rho $ rest frame. In addition, we include a factor$ 1/|\vec{k}_{\rm{ave}}|^2 $ , with$ |\vec{k}_{\rm{ave}}| = 1000 $ MeV, to make the strength B with the same dimension as A. The factor$ 1/\sqrt{2} $ is the Clebsch-Gordan coefficient for the$ D^{*0}\bar{D}^{*0} $ system with isospin$ I = 1 $ . To explicitly consider the factor 3 relative to the enhancement of the external emission mechanism of Fig. 1(c), we set$ 3C $ for the weight of the mechanism relative to the$ D^{*0} \bar{D}^{*0} $ primary production. While we can vary the value of C around unity, we can anticipate that this hardly changes the shape of the obtained distribution.$ G_{J/\psi \rho} $ and$ G_{D^*\bar{D}^*} $ are loop functions, and the dimensional regularization is defined as,$ \begin{split} G_{i} =& \frac{1}{16 \pi^2} \left\Bigg\{ \alpha_i + \ln \frac{m_1^2}{\mu^2} + \frac{m_2^2-m_1^2 + s}{2s} \ln \frac{m_2^2}{m_1^2} \right. \\ &+ \frac{p}{\sqrt{s}} \left[ \ln(s-(m_2^2-m_1^2)+2 p\sqrt{s}) \right. \\ &+ \ln(s+(m_2^2-m_1^2)+2 p\sqrt{s}) \\ & - \ln(-s+(m_2^2-m_1^2)+2 p\sqrt{s}) \\ &\left.\left.- \ln(-s-(m_2^2-m_1^2)+2 p\sqrt{s}) \right]\right\Bigg\}, \end{split} $

(3) where the subtraction constants
$ \alpha_1 = -2.3 $ and$ \alpha_2 = -2.6 $ ($ i = 1,2 $ corresponding to the channels of$ D^*\bar{D}^* $ and$ J/\psi\rho $ ), and$ \mu = 1000 $ MeV, same as in Ref. [13]. p is the three-momentum of the mesons$ D^* $ or$ J/\psi $ in the rest frame of$ D^*\bar{D}^* $ or$ J/\psi\rho $ , respectively,$ p = \frac{\sqrt{(s-(m_1+m_2)^2)(s-(m_1-m_2)^2)}}{2\sqrt{s}}, $

(4) where
$ m_{1,2} $ represents the masses of the mesons in the ith channel.The transition amplitudes of
$ t_{J/\psi\rho, J/\psi\rho} $ and$ t^{I = 1}_{D^*\bar{D}^*, J/\psi\rho} $ are computed by solving the Bethe-Salpeter equation, as shown in Eq. (8) of Ref. [13].In addition,
$ K^-\rho $ can also undergo the final state interaction. In Ref. [26],$ B\to J/\psi K_1(1270) $ was observed with Br$ [B^+\to J/\psi K^+_1(1270)] = (1.80\pm 0.34\pm 0.39) \times 10^{-3} $ , and no evidence of other high-mass kaons were seen. As the dominant decay channel of the$ K_1(1270) $ is$ \rho K $ (Br$ [K_1(1270)\to \rho K] = (42\pm6) $ % [27]), we expect that the resonance$ K_1(1270) $ will play an important role in the$ \rho K^- $ invariant mass distribution, as shown in Fig. 2(c), and the contributions from the other high-mass kaons can be safely neglected. Although some theoretical studies have shown that the$ K_1(1270) $ has a two-pole structure [35-37], the contribution from the$ K_1(1270) $ will not affect the peak structure of the$ Z_c(4000) $ in the$ J/\psi\rho $ invariant mass distribution, according to the Dalitz diagram of$ B^-\to J/$ $ \psi \rho^0 K^- $ shown in Fig. 3. For simplicity, we will include the amplitude for the$ K_1(1270) $ contribution with a Breit-Wigner form,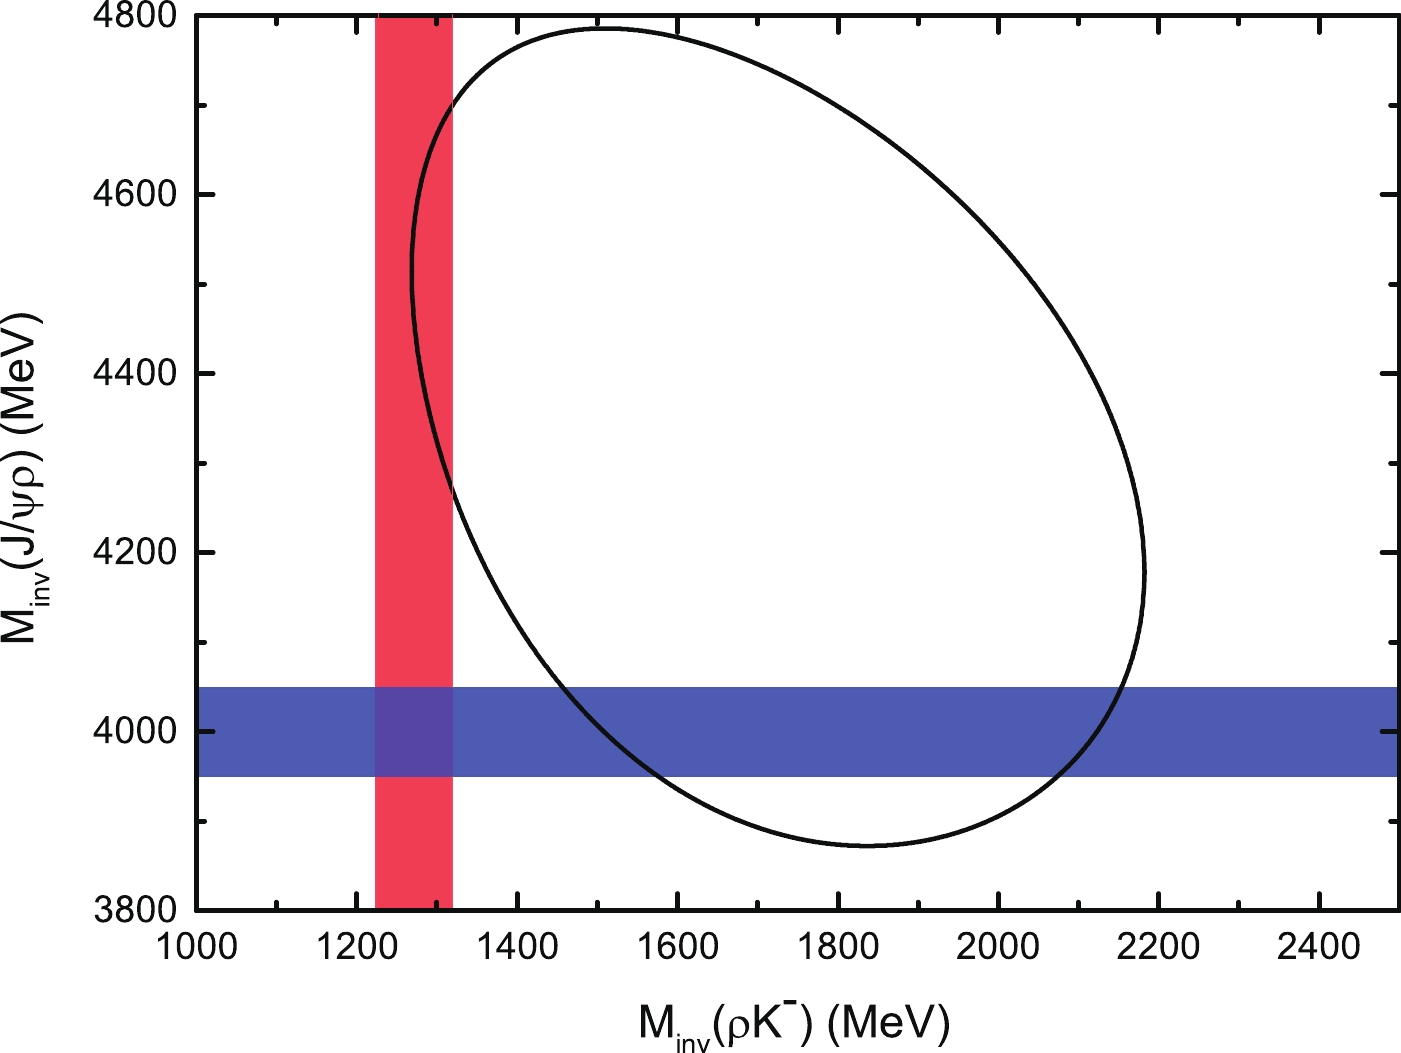
Figure 3. (color online) Dalitz plot of the
$B^-\rightarrow J/\psi\rho K^-$ reaction. The colored bands in blue and red correspond to the energy regions ($M-\Gamma/2,M+\Gamma/2$ ) of the$Z_c(4000)$ and$K_1(1270)$ resonances, respectively. Here, we consider$M_{K_1}=1272$ MeV and$\Gamma_{K_1}=90$ MeV for the$K_1(1270)$ from the PDG [27], and$M_{Z_c}=4000$ MeV and$\Gamma_{Z_c}=100$ MeV for the$Z_c(4000)$ from Ref. [13].$ {\cal{M}}^{(c)} = \frac{ A'\times M^2_{K_1} \times \epsilon_{J/\psi}\cdot \epsilon_{\rho}}{M^2_{\rm{inv}}(K\rho)-M^2_{K_1}+ {\rm i} M_{K_1} \Gamma_{K_1}}, $

(5) where
$ M_{K_1} = 1272 $ MeV, and$ \Gamma_{K_1} = 90 $ MeV [27]. Then, the full amplitude for the$ B^-\to J/\psi\rho^0 K^- $ reaction is given by,$ \begin{split} {\cal{M}} =& {\cal{M}}^{(a)}+{\cal{M}}^{(b)}+ {\cal{M}}^{(c)} = A \times \, \vec\epsilon_{J/\psi}\cdot \vec\epsilon_{\rho} \times \left[1+\frac{\beta M^2_{K_1} }{M^2_{\rm{inv}}(K\rho)-M^2_{K_1}+ {\rm i} M_{K_1} \Gamma_{K_1}} \right] +\frac{B}{|\vec{k}_{\rm{ave}}|^2} \left( G_{J/\psi \rho} t_{J/\psi\rho, J/\psi\rho} + \frac{3C}{\sqrt{2}} G_{D^*\bar{D}^*} t^{I = 1}_{D^*\bar{D}^*, J/\psi\rho} \right) \\ & \times \left(\vec{\epsilon}_{J/\psi}\cdot \vec{k}\,\vec{\epsilon}_{\rho}\cdot \vec{k} -\frac{1}{3}|\vec{k}|^2 \vec{\epsilon}_{J/\psi}\cdot \vec{\epsilon}_{\rho} \right) = A \times \, \vec\epsilon_{J/\psi}\cdot \vec\epsilon_{\rho} \times \left[t^{(a)}+t^{(c)} \right] +\frac{B}{|\vec{k}_{\rm{ave}}|^2} \left(\vec{\epsilon}_{J/\psi}\cdot \vec{k}\,\vec{\epsilon}_{\rho}\cdot \vec{k} -\frac{1}{3}|\vec{k}|^2 \vec{\epsilon}_{J/\psi}\cdot \vec{\epsilon}_{\rho} \right) \times t^{(b)}, \\ =& A \times \, \vec\epsilon_{J/\psi}\cdot \vec\epsilon_{\rho} \times t^{S}+\frac{B}{|\vec{k}_{\rm{ave}}|^2} \left(\vec{\epsilon}_{J/\psi}\cdot \vec{k}\,\vec{\epsilon}_{\rho}\cdot \vec{k} -\frac{1}{3}|\vec{k}|^2 \vec{\epsilon}_{J/\psi}\cdot \vec{\epsilon}_{\rho} \right) \times t^{D}, \end{split} $

(6) where the terms from the S and D waves can be defined as,
$ t^{S} = t^{(a)}+t^{(c)} = 1+\frac{\beta M^2_{K_1} }{M^2_{\rm{inv}}(K\rho)-M^2_{K_1}+ {\rm i} M_{K_1} \Gamma_{K_1}}, $

(7) $ t^{D} = t^{(b)} = G_{J/\psi \rho} t_{J/\psi\rho, J/\psi\rho} + \frac{3C}{\sqrt{2}} G_{D^*\bar{D}^*} t^{I = 1}_{D^*\bar{D}^*, J/\psi\rho}, $

(8) where
$ \beta = A'/A $ represents the relative weight of the contribution from the$ K_1(1270) $ resonance.Based on the above amplitudes, the mass distribution of the decay width is given by,
$ \frac{{\rm d}^{2}\Gamma}{{\rm d} M^{2}_{J/\psi\rho} {\rm d} M_{\rho K}^{2}} = \frac{1}{(2\pi)^{3}}\frac{1}{32M^{3}_{B^{-}}}\sum |{\cal{M}}|^{2} . $

(9) As the
$ \vec{\epsilon}_{J/\psi}\cdot \vec{\epsilon}_{\rho} $ and$ \left(\vec{\epsilon}_{J/\psi}\cdot \vec{k}\,\vec{\epsilon}_{\rho}\cdot \vec{k} -\frac{1}{3}|\vec{k}|^2 \vec{\epsilon}_{J/\psi}\cdot \vec{\epsilon}_{\rho} \right) $ structures filter spin 0 and 2 respectively, they do not interfere when one sums over the polarizations of all the final states. Thus, the mass distribution can be rewritten by summing$ {\cal{M}} $ over the final state polarizations,$ \begin{split} \frac{{\rm d}^{2}\Gamma}{{\rm d} M^{2}_{J/\psi\rho} {\rm d} M_{\rho K}^{2}} = \frac{1}{(2\pi)^{3}}\frac{A^2}{32M^{3}_{B^{-}}} \left(3 |t^{S}|^2+\frac{2B^2}{3A^2}\frac{ |\vec{k}|^4}{|\vec{k}_{\rm{ave}}|^4} |t^{D}|^2 \right) . \end{split} $

(10) -
In this section, the results obtained with the above formalisms are presented. First, we present the modulus squared of the transition amplitudes
$ |T_{11}|^2 $ for$ D^*\bar{D}^*\to D^*\bar{D}^* $ and$ |T_{12}|^2 $ for$ D^*\bar{D}^*\to J/\psi \rho $ in Fig. 4, where one can observe a peak around 4000 MeV, corresponding to the resonance$ Z_c(4000) $ predicted in Ref. [13].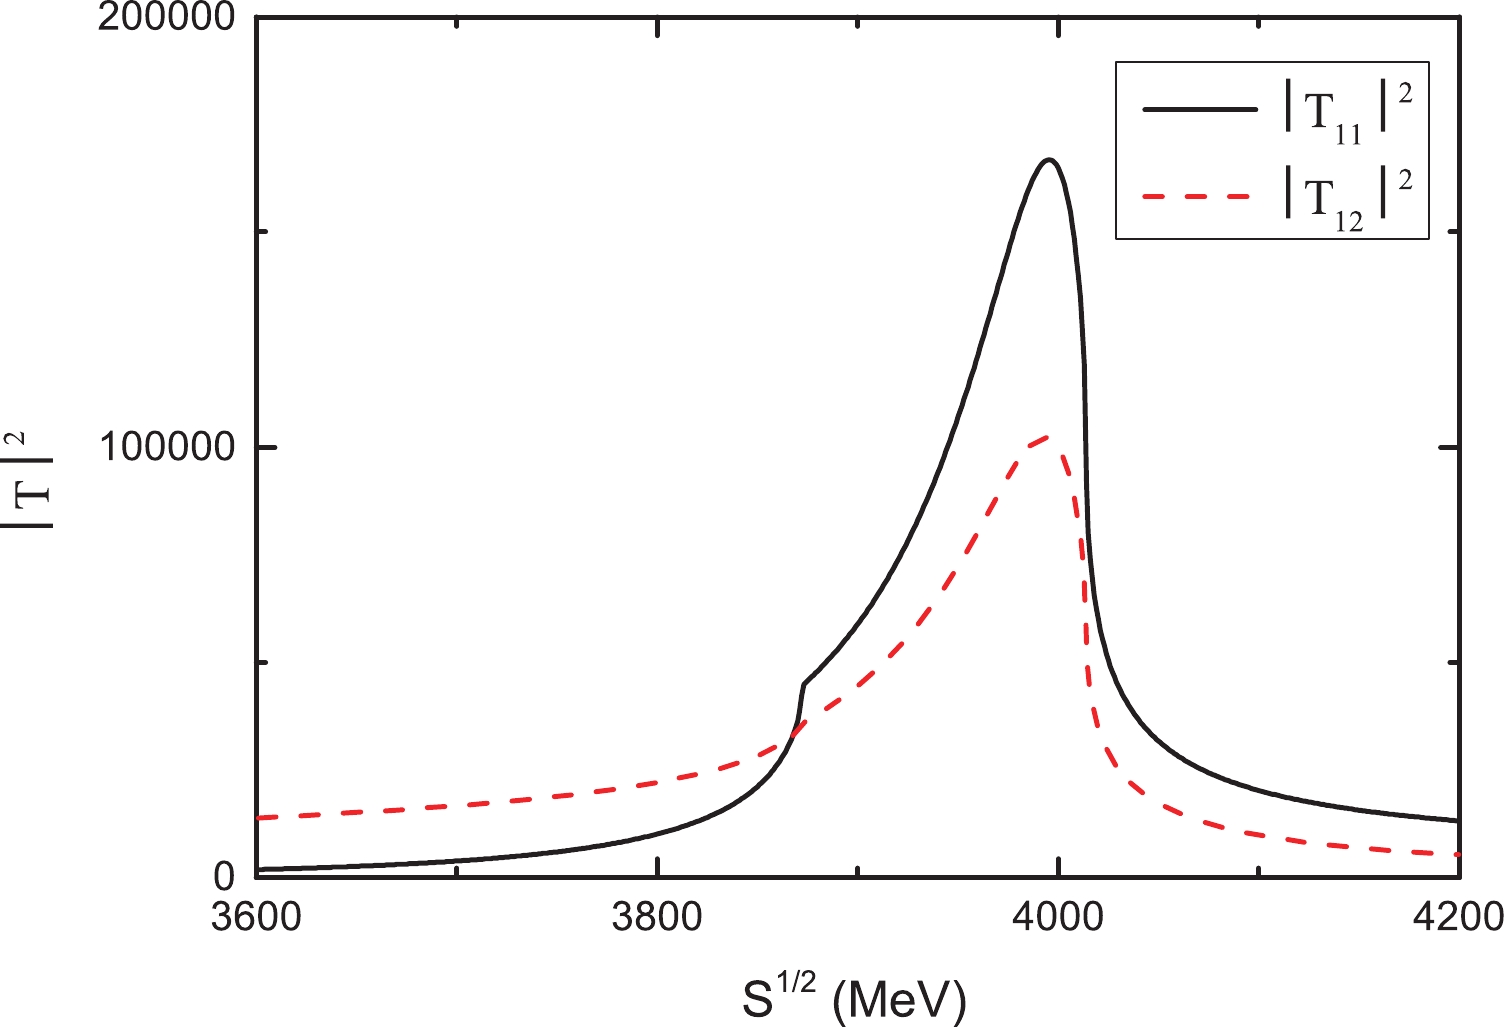
Figure 4. (color online) Modulus squared of the transition amplitudes for
$D^*\bar{D}^*\to D^*\bar{D}^*$ (curve labeled as$|T_{11}|^2$ ) and$D^*\bar{D}^*\to J/\psi \rho $ (curve labeled as$|T_{12}|^2$ ).Before presenting the mass distributions of the
$ B^-\to J/\psi\rho^0 K^- $ reaction, we need to choose the values of the free parameters of the proposed model. In addition to the arbitrary normalization A of Eq. (10), there are three parameters, namely 1)$ \beta $ , the weight of the contribution from the$ K_1(1270) $ resonance, 2) B, the weight of the contribution from the$ J/\psi\rho $ and$ D^{*0}\bar{D}^{*0} $ final state interactions, and 3) C, the weight of$ D^{*0}\bar{D}^{*0} $ primary production, as shown in Eq. (6). We choose$ \beta = 0.5 $ to consider a sizable contribution from the$ K_1(1270) $ resonance, and$ C = 1 $ . Although the exact value of$ B/A $ is not known, one can expect B to have a similar strength as A, as the primary production weight of$ J/\psi\rho $ , shown in Fig. 2(b), is the same as that of the tree diagram in Fig. 2(a).Up to the arbitrary normalization A, we calculate the
$ J/\psi\rho $ and$ \rho K^- $ mass distributions with$ B/A = 1 $ , as shown in Figs. 5 and 7, respectively. For the$ J/\psi\rho $ mass distribution, a significant peak structure can be seen around 4000 MeV, which is associated with the$ D^*\bar{D}^* $ molecular state$ Z_c(4000) $ . The contributions from the tree diagram in Fig. 2(a) and the resonance$ K_1(1270) $ have little effect on the peak position. For the$ \rho K^- $ mass distribution, Fig. 7 shows a narrow peak close to the$ \rho K^- $ threshold, corresponding to the$ K_1(1270) $ resonance, which is compatible with the$ K\rho $ distribution reported by the Belle Collaboration [26]. Here, although we only consider the contribution from the tree diagram in Fig. 2(a) in S-wave, the tree diagram with$ K^- $ in D-wave also has a contribution, which can be accounted for by replacing$ t^D = t^{\rm{(b)}} $ by$t^D = 1+t^{\rm{(b)}}$ in Eq. (8). In Fig. 6, it can be observed that the results including the contribution from the tree diagram with$ K^- $ in D-wave are significantly small and can be safely neglected, when comparing the curves labeled as 'Total$ ^* $ ' and 'Total'. For simplicity, we neglect the contribution from the tree diagram with$ K^- $ in D-wave in the following calculations.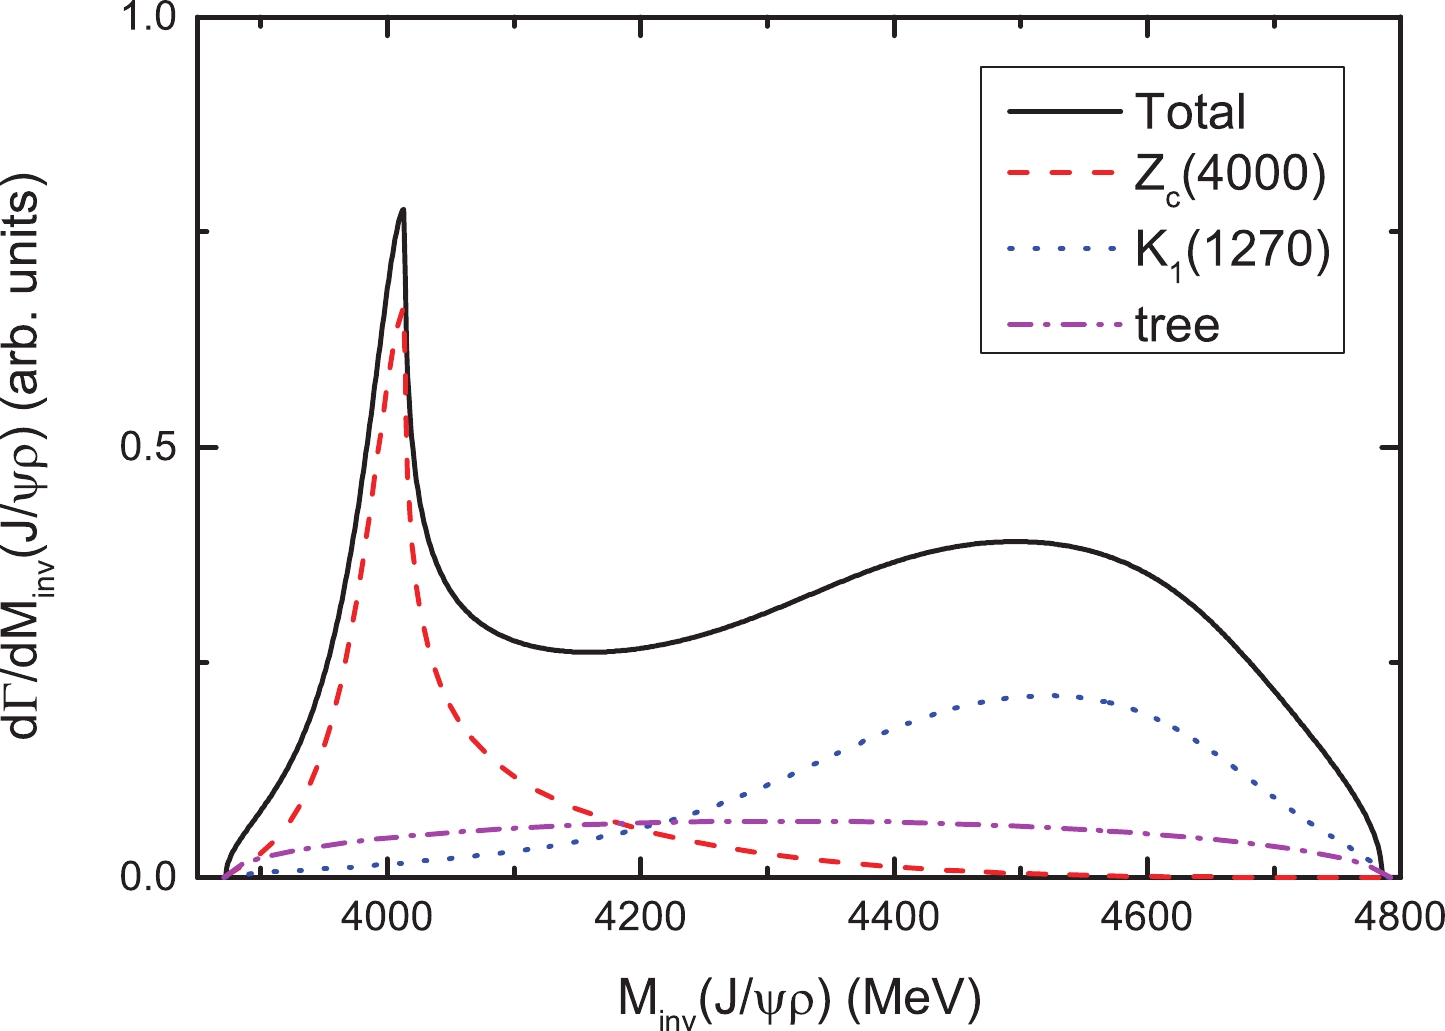
Figure 5. (color online) The
$J/\psi\rho$ mass distribution of the$B^-\rightarrow J/\psi\rho^0 K^-$ reaction. The curves labeled as '$Z_c(4000)$ ', '$K_1(1270)$ ', and 'tree', correspond to the contributions of the$J/\psi\rho$ and$D^{*0}\bar{D}^{*0}$ final state interactions (Fig. 2(b)),$K_1(1270)$ resonance (Fig. 2(c)), and tree diagram (Fig. 2(a)), respectively. The 'Total' curve represents the results of the complete model.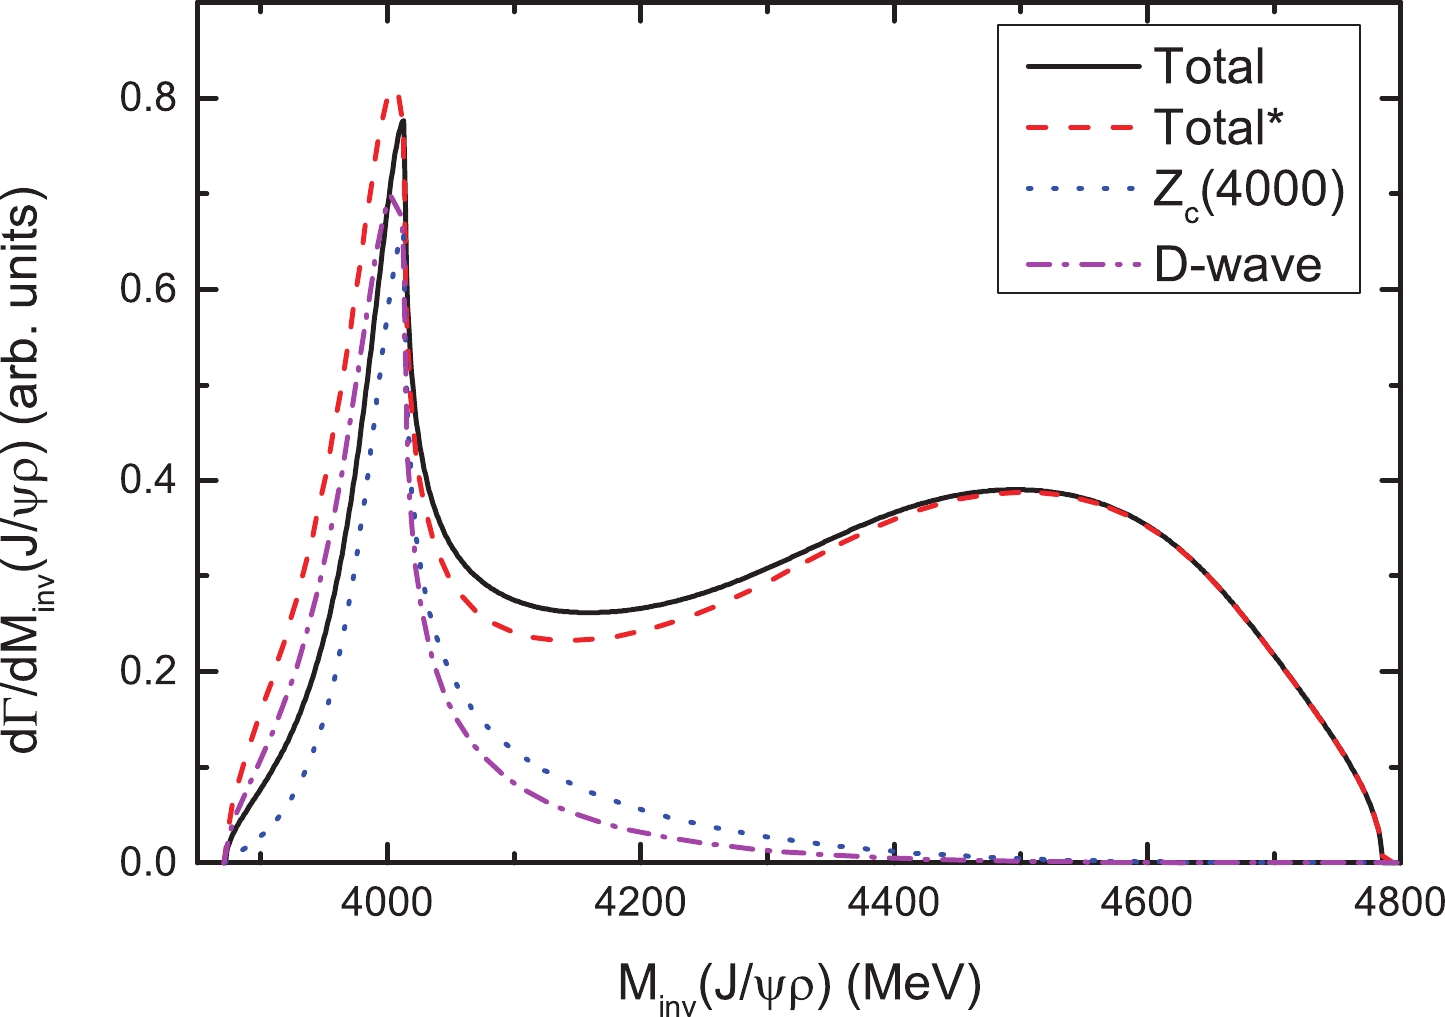
Figure 6. (color online) The
$J/\psi\rho$ mass distribution of the$B^-\rightarrow J/\psi\rho^0 K^-$ reaction. The curves labeled as 'Total' and '$Z_c(4000)$ ' are the same as those defined in Fig. 5, the curve labeled as 'D-wave' shows the contributions from the tree diagram and$J/\psi\rho$ and$D^{*0}\bar{D}^{*0}$ final state interactions, with$K^-$ in$D$ -wave, and the 'Total$^*$ ' curve represents the total results obtained by including the contribution of the tree diagram with$K^-$ in$D$ -wave.
Figure 7. (color online) The
$\rho K^-$ mass distribution of the$B^-\rightarrow J/\psi\rho^0 K^-$ reaction. The labels of the curves are the same as those defined in Fig. 5.Next, the
$ J/\psi\rho $ mass distributions are presented by varying the values of the three parameters. In Fig. 8, the$ J/\psi\rho $ mass distributions with$ \beta = 0.3,0.5,0.8 $ are illustrated. From Fig. 8, it can be concluded that the contribution from the$ K_1(1270) $ resonance does not modify the peak position of the$ Z_c(4000) $ resonance markedly. In addition, the peak structure remains clear even with a very large contribution from the$ K_1(1270) $ resonance, as the narrow peak structure of the$ K_1(1270) $ almost does not contribute to the$ J/\psi\rho $ mass distribution in the$ 3900\sim 4100 $ MeV region, as shown in Fig. 3.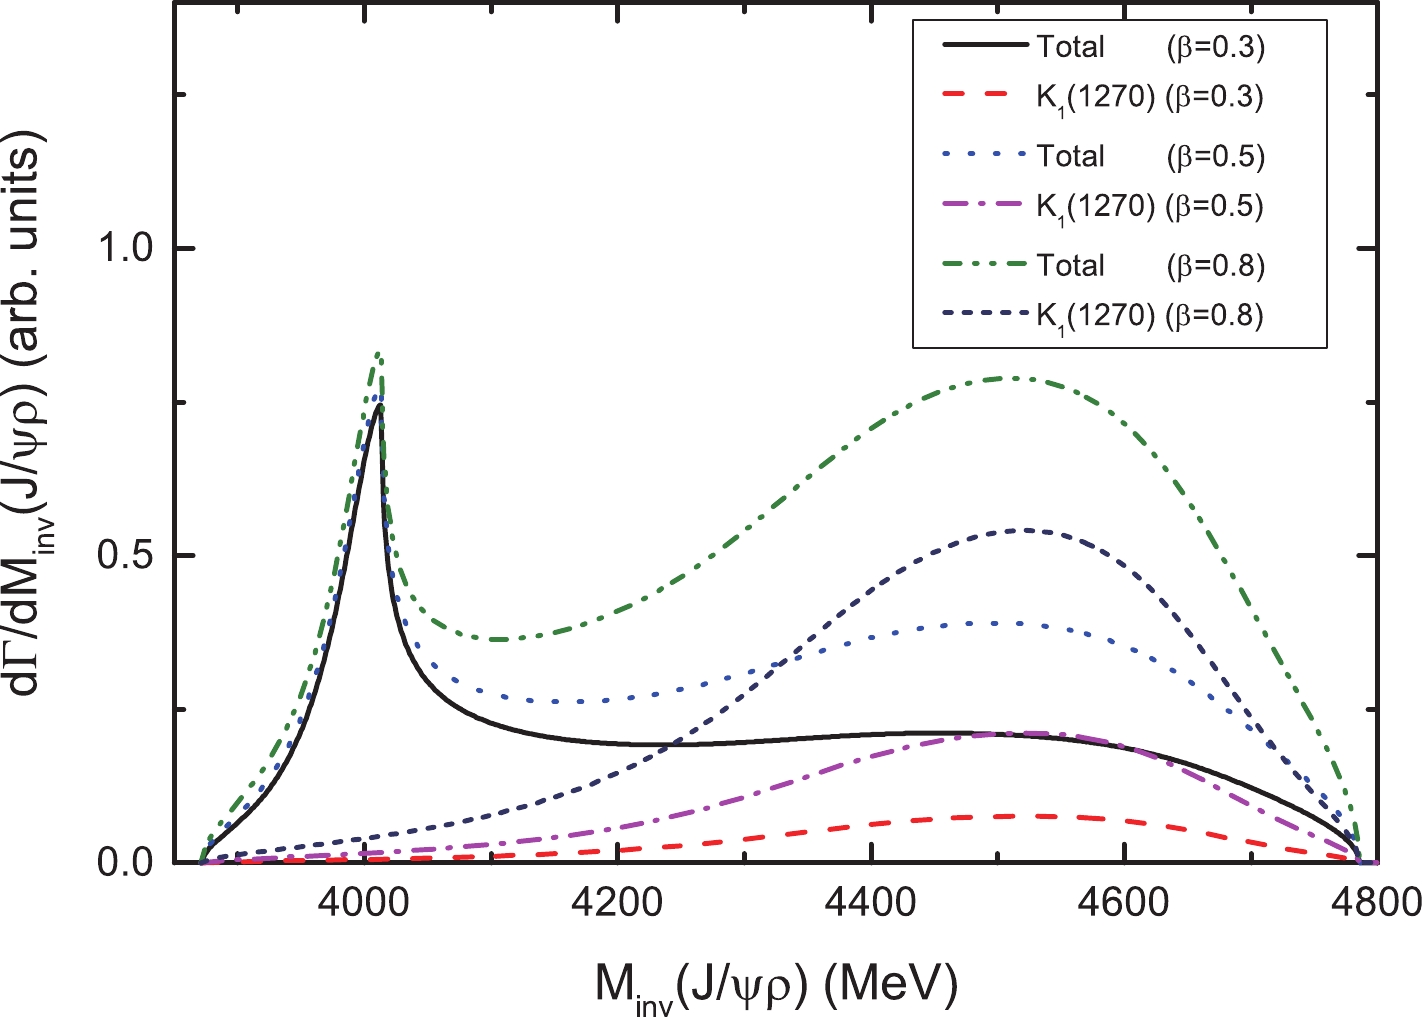
Figure 8. (color online) The
$J/\psi\rho$ mass distribution of the$B^-\rightarrow J/\psi\rho^0 K^-$ reaction for different values of$\beta$ .The
$ J/\psi\rho $ mass distributions with different values of$ B/A = 0.5,1.0,1.5 $ are shown in Fig. 9. While the background contributions shown in Figs. 2(a) and (c) become larger, the peak structure of the$ Z_c(4000) $ becomes weaker. The ratio of$ B/A $ cannot be determined with the present experimental information. Furthermore, whether the signal of$ Z_c(4000) $ can be determined depends on the background or the ratio$ B/A $ . It should be noted that the weight of the tree diagram [Fig. 2(a)] is the same as the$ J/\psi\rho $ final state interaction [Fig. 2(b)], which implies that B and A should have the same order of magnitude if the contribution from$ K_1 (1270) $ is removed. Indeed, the$ K_1 (1270) $ mainly contributes to the region of$ M_{J/\psi\rho}> 4200 $ MeV, which is far from the peak position of the$ Z_c(4000) $ , and the contribution from the$ K_1 (1270) $ can be easily removed with a cut on the$ \rho K^- $ invariant mass (for example, by removing the events of$ M_{\rho K^-}<1400 $ MeV). Thus, even if$ B/A $ is small, one can expect to find a peak around 4000 MeV with respect to the flat distribution from the background, when the contribution of$ K_1 (1270) $ is removed.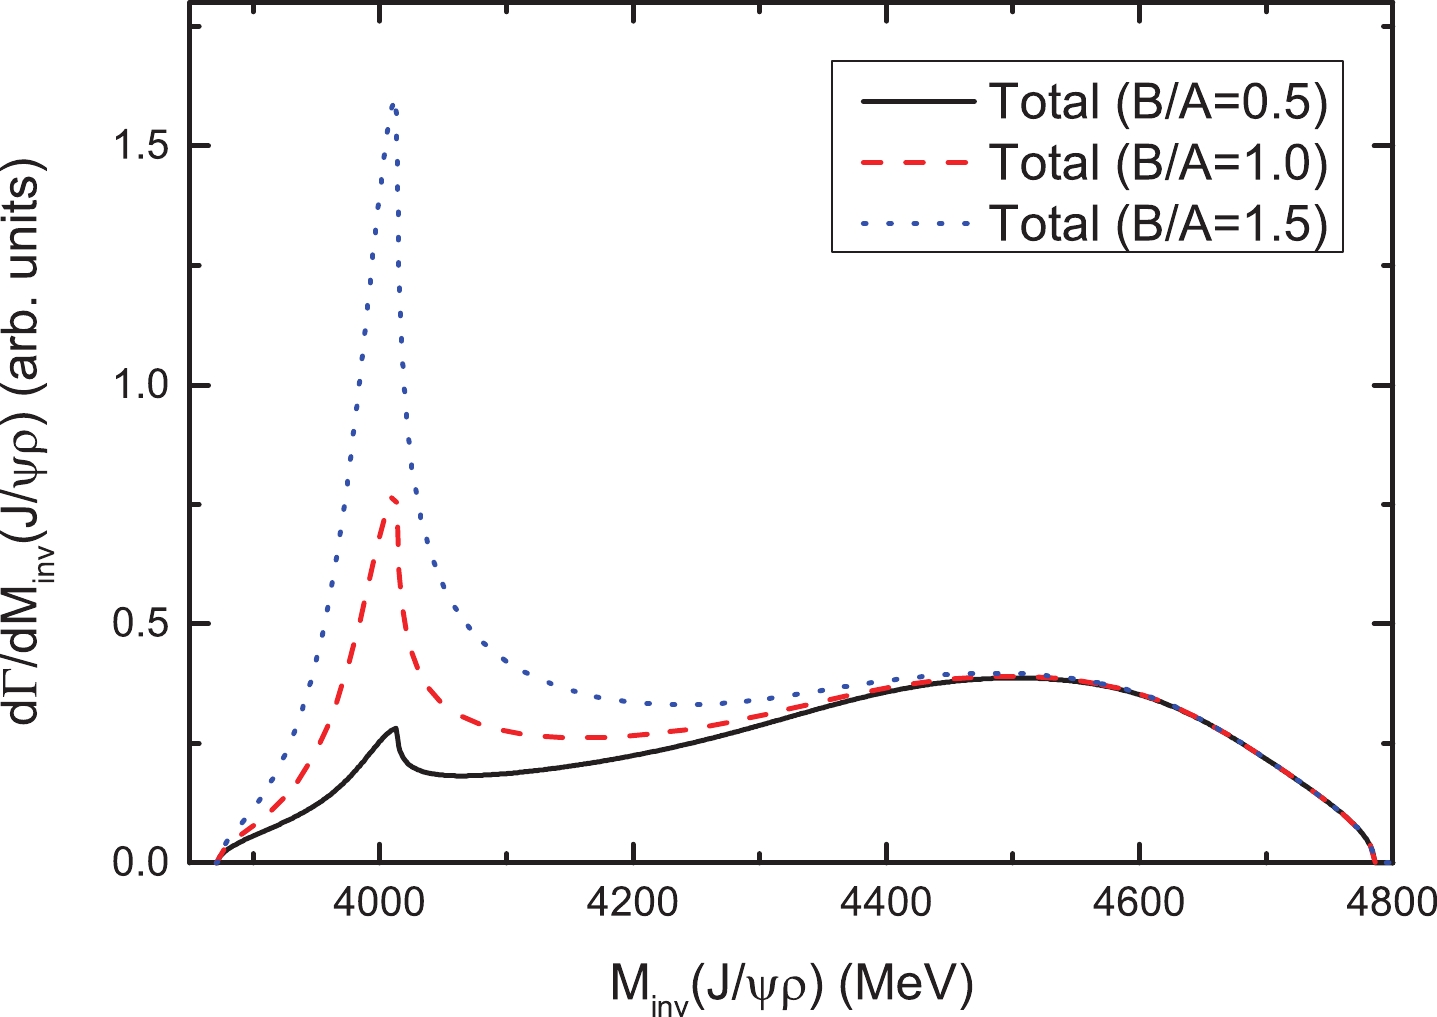
Figure 9. (color online) The
$J/\psi\rho$ mass distribution of the$B^-\rightarrow J/\psi\rho^0 K^-$ reaction for different values of$B$ .The parameter
$ 3C $ , which corresponds to the relative weight of the external emission mechanism [Fig. 1(c)] with respect to the internal emission mechanism [Fig. 1(a)], should be approximately 3, as we consider the number of colors$ N_c = 3 $ . The$ J/\psi\rho $ mass distributions with$ C = 0.8,1.0,1.2 $ are presented in Fig. 10(a). It can be observed that the signals of$ Z_c (4000) $ are always clear for different values of$ 3C $ approximately equal to 3. In addition, the$ N_c $ scaling only indicates the relative strength of the absolute values, and the relative sign between Fig. 1(a) and Fig. 1(c) is not fixed. Thus, the$ J/\psi\rho $ mass distributions with$ C = -0.8,-1.0,-1.2 $ are presented in Fig. 10(b), where it can be observed that while the signal of$ Z_c(4000) $ is a little weaker, it is still very clear.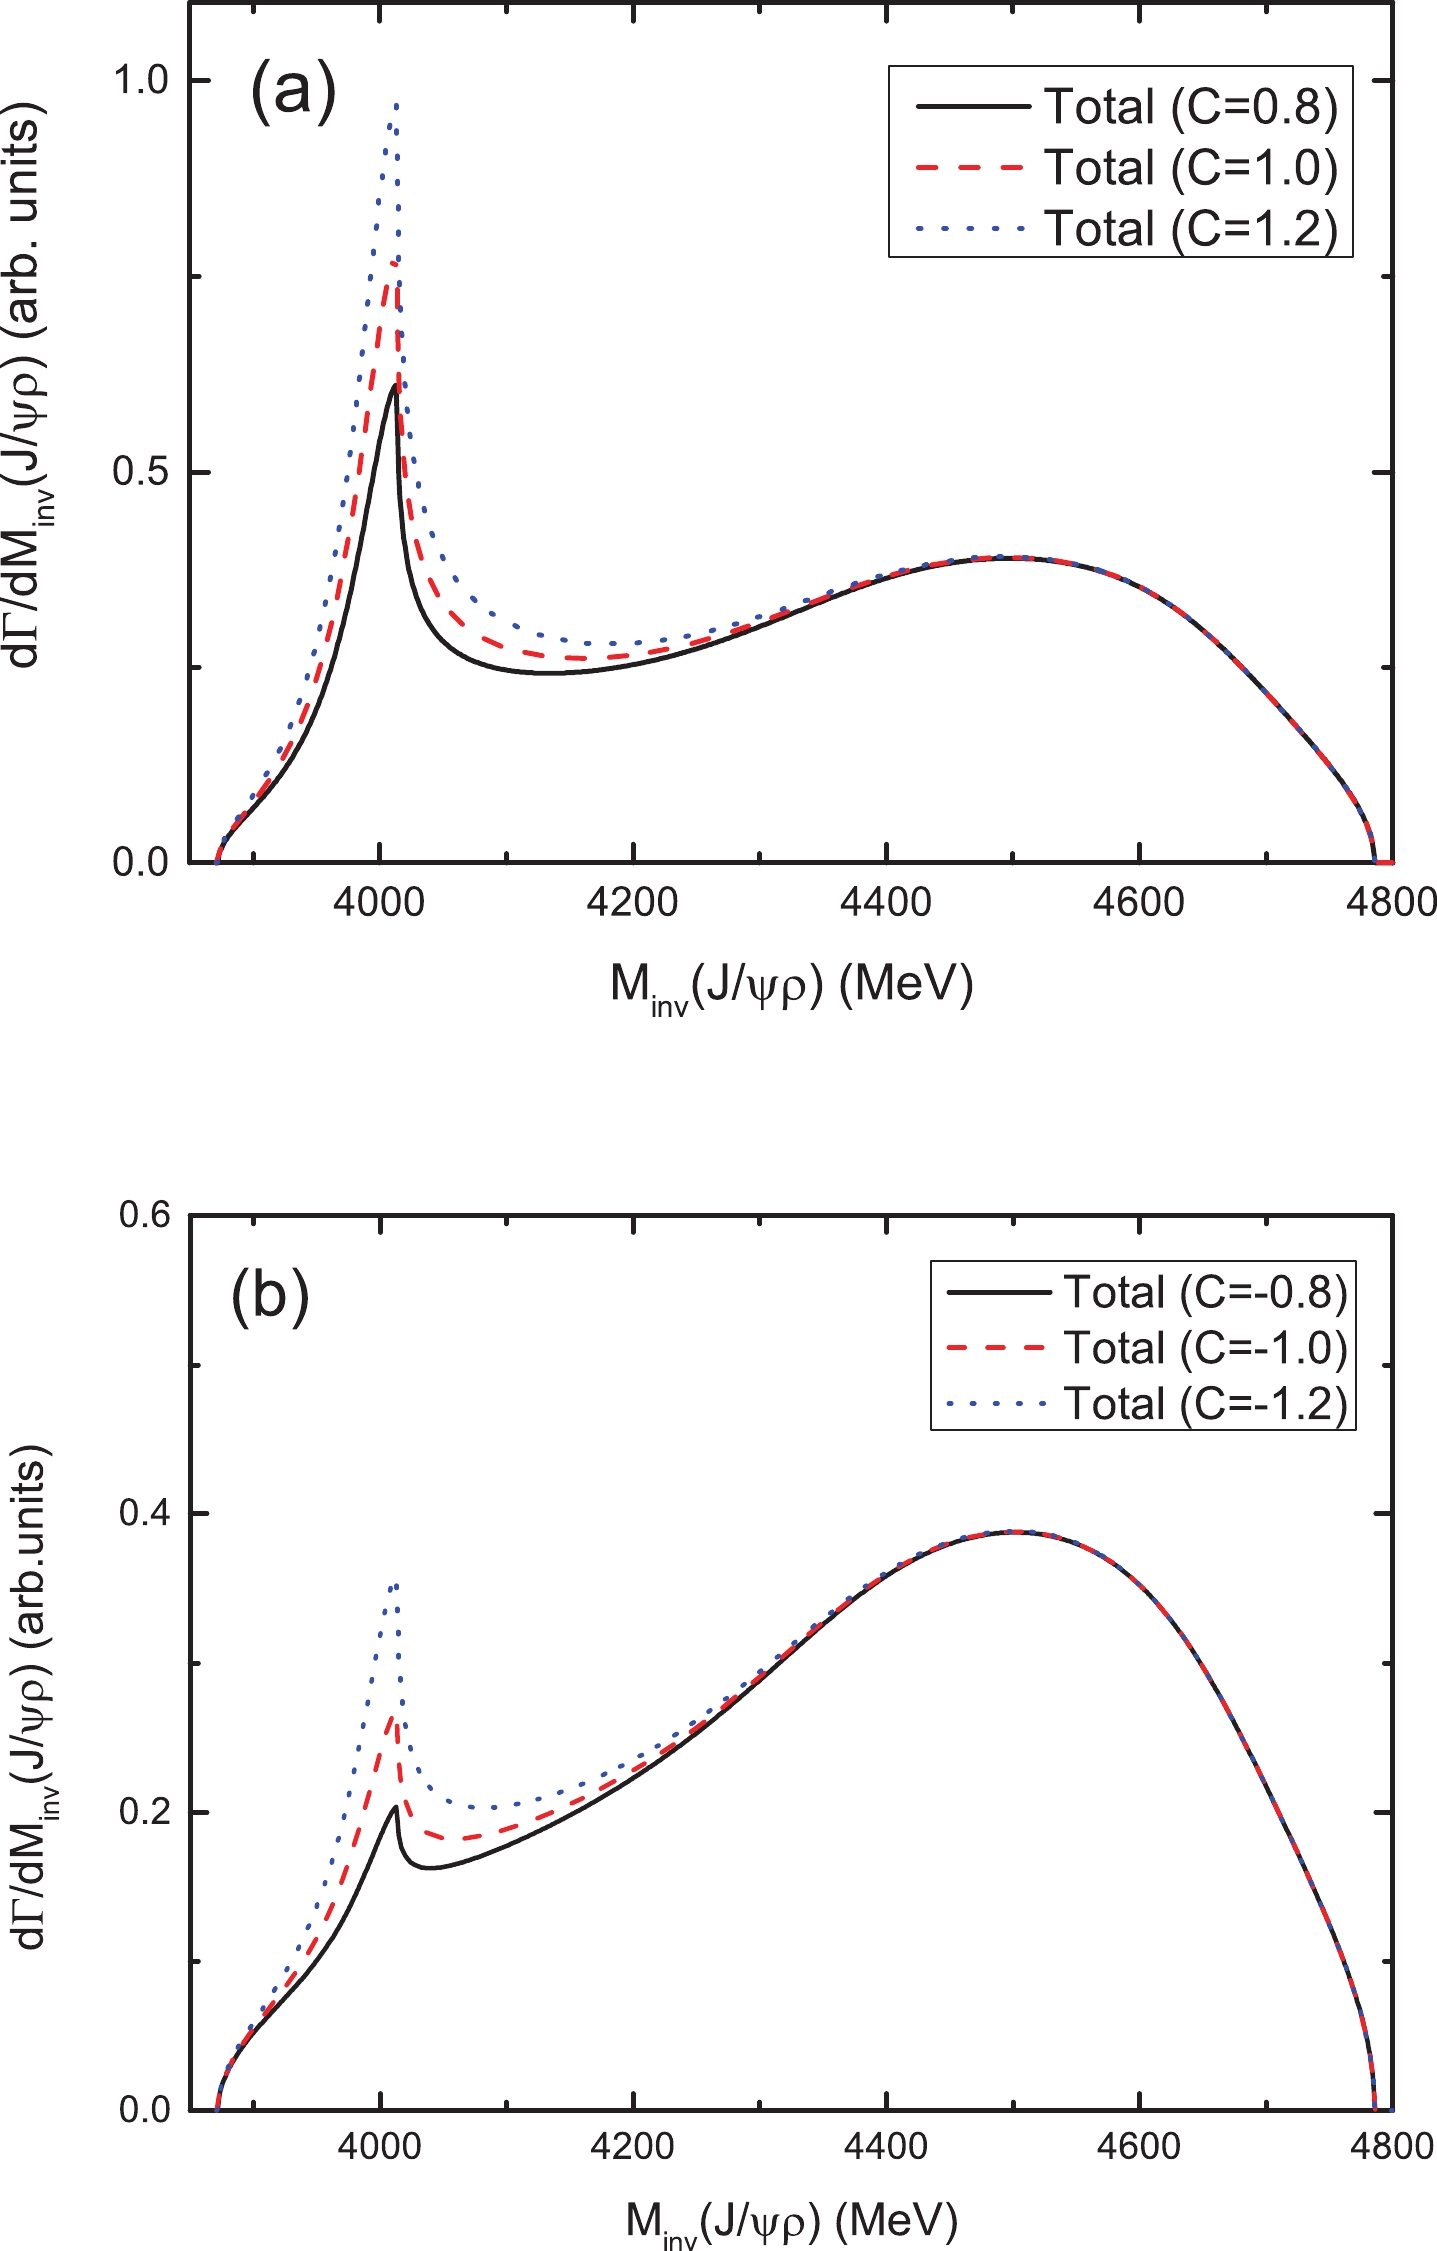
Figure 10. (color online) The
$J/\psi\rho$ mass distribution of the$B^-\rightarrow J/\psi\rho^0 K^-$ reaction for (a) positive values of$C$ , and (b) negative values of$C$ . -
In this work, we studied the reaction
$ B^-\to J/\psi\rho^0 K^- $ , considering the$ D^*\bar{D}^* $ molecular state$ Z_c(4000) $ that couples to the$ J/\psi\rho $ channel and the contribution from the$ K_1(1270) $ resonance. The final state interactions of$ J/\psi\rho $ and$ D^{*0}\bar{D}^{*0} $ with isospin$ I = 1 $ were derived from the local hidden gauge approach.The results showed that the
$ J/\psi\rho $ mass distribution has a peak structure, which can be attributed to the$ D^*\bar{D}^* $ molecular state$ Z_c(4000) $ . In contrast, a narrow peak structure close to the$ \rho K^- $ threshold in the$ \rho K^- $ mass distribution is observed, which corresponds to the$ K_1(1270) $ resonance. The contribution from the$ K_1(1270) $ resonance does not affect the peak position of the$ Z_c(4000) $ . As mentioned in the introduction, any resonance found in the$ J/\psi\rho $ mass distribution can be unambiguously interpreted as an exotic state. Therefore, we encourage experimental physicists to search for the$ Z_c(4000) $ state in the reaction$ B^-\to J/\psi\rho^0 K^- $ .We warmly thank Eulogio Oset, Li-Sheng Geng, Ju-Jun Xie, and Feng-Kun Guo for the useful discussions and comments.
Search for the ${{{D^*}}\!{{\bar{D}^*}}}$ molecular state ${{Z_c(4000)}}$ in the reaction ${{B^{-}\! \rightarrow\! J/\psi \rho^0 K^{-}}}$
- Received Date: 2020-04-16
- Available Online: 2020-09-01
Abstract: Based on the prediction of a


 DownLoad: