-
Heavy quarkonium studies are very important for testing quantum chromodynamics (QCD), both its perturbative and nonperturbative aspects. Owing to the heavy quark mass and the consequent non-relativistic nature, the non-relativistic QCD (NRQCD) factorization framework [1] was proposed as a powerful tool for computing the production and decay of heavy quarkonium. The calculation is factorized into a product of short distance coefficients (SDCs) and universal long distance matrix elements (LDMEs). The SDCs are process-dependent and perturbatively double expansions for both the coupling constant
$ \alpha_s $ and the heavy quark relative velocity v, while the LDMEs can be determined by experimental measurements.NRQCD predicts the process via the color-octet (CO) mechanism and has achieved great successes, especially in explaining
$ J/\psi $ production [2-5] and polarization [6-9] at hadron colliders. As for bottomonium, owing to the heavier mass of the bottom quark, both the coupling constant$ \alpha_s $ and the heavy quark relative velocity v are smaller than those of charmonium, making it more suitable for the NRQCD framework. Some early investigations on the bottomonium production can be found in Refs. [2, 10-15] and references therein. The latest studies on the full next-to-leading order (NLO) NRQCD investigations of inclusive hadroproduction of$ \Upsilon $ are reported in Refs. [16-19]. In these papers, a relatively good agreement with experimental measurements was achieved, but their fitted CO LDMEs exhibit significant differences across different schemes of the NRQCD scale or different fitting strategies. This indicates that further studies and phenomenological testing of the NRQCD framework remain important. In addition to hadron colliders,$ e^+e^- $ colliders are also suitable for studying the physics of heavy quarkonium. There are advantages, from both experimental and theoretical viewpoints [20]. Experimentally, the background is weaker and cleaner for signal reconstruction, while theoretically, the production mechanism is simpler and the calculation uncertainty is smaller. At an$ e^+e^- $ collider, heavy quarkonium can be produced via two routes:$ e^+e^- $ annihilation and$ \gamma\gamma $ collision. The inclusive and exclusive charmonia production via$ e^+e^- $ annihilation had been measured at B factories [21-25], and many theoretical studies were done, seeing the review articles [20, 26, 27]. Very recently, the calculations of charmonia production have proceeded to the next-to-next-to-leading order (NNLO) [28-30]. Regarding the$ \gamma\gamma $ collision, the$ J/\psi $ photoproduction had been measured at CERN LEP-II [31, 32], and the leading order (LO) NRQCD calculation [33] in 2002 described these measurements. The NLO prediction [34] using globally fitted LDMEs in 2011, however, was systematically overshot by the LEP-II data. It is worthy to note, however, that the uncertainties of LEP-II measurements with respect to the$ J/\psi $ photoproduction are very large [20].As for the production of
$ \Upsilon $ mesons, no measurements have been performed at$ e^+e^- $ colliders yet. The proposed Circular Electron Positron Collider (CEPC) [35, 36] can operate at different center of mass energies, such as 91.2 GeV(Z pole), 161 GeV (WW threshold), and 240 GeV (Higgs factory). Its peak luminosity at 240$ {\; {\rm{GeV}}} $ is on the order of$ {10^{34}}\;{\rm{c}}{{\rm{m}}^{ - 2}}{{\rm{s}}^{ - 1}}$ ; hence, considerable heavy quarkonium events are expected. At the energy of 240$ {\; {\rm{GeV}}} $ , the$ \gamma\gamma $ collision mode (photoproduction) dominates the heavy quarkonium production. The measurement can yield precision results for different kinematic distributions and will hopefully clarify the current predicament. It will also expand our knowledge of heavy quarkonium physics.Therefore, estimation and analysis of
$ \Upsilon $ production with roughly detector simulations at the CEPC is very useful. In our previous work [37], we have investigated prompt$ J/\psi $ photoproduction at the CEPC and presented promising results. There are also predictions regarding heavy quarkonium photoproduction at the future$ e^+e^- $ collider ILC [38, 39], where photons will be generated from laser backscattering (LBS) with electrons and positrons. In Ref. [38], several heavy quarkonia photoproduction calculations were reported for color-singlet (CS) channels, and the reported results suggested a sizable yield of$ \Upsilon(1S) $ events. In this work, based on the colliding photons from the electron positron bremsstrahlung, we investigated the$ \Upsilon(1S,2S,3S) $ photoproduction at the CEPC, by considering both direct production and feed-down contributions from heavier quarkonia. In Section II, the basic theoretical framework for the calculation is outlined. The numerical results and analysis are presented in Section III. Finally, a brief summary and conclusion are presented in Section IV. -
Colliding photons are generated as a result of the electron positron bremsstrahlung, which is well described by the Weizäcker-Williams approximation (WWA) [40]:
$ \begin{aligned}[b]f_{\gamma/e}(x) = \dfrac{\alpha}{2\pi}\Bigg[\frac{1 + (1 - x)^2}{x} {\rm log}\dfrac{Q^2_{\rm max}}{Q^2_{\rm min}}+2m_e^2x\left(\frac{1}{Q^2_{\rm max}} -\frac{1}{Q^2_{\rm min}}\right)\Bigg], \end{aligned} $

(1) where
$ \alpha = 1/137 $ is the electromagnetic fine structure constant,$ Q^2_{\rm min} = m_e^2 x^2/(1-x) $ , and$ Q^2_{\rm max} = (E\theta_c)^2(1-x) + Q^2_{\rm min} $ with$ x = E_\gamma/E_e $ . The maximal scattered angular cut,$ \theta_c $ , is set to$ 32\;{\rm{mrad}}$ , to ensure the photons are real, and$ E = E_e = \sqrt{s}/2 $ with$ \sqrt{s} = 240 {\; {\rm{GeV}}} $ at the CEPC.In the NRQCD factorization approach, the SDCs stand for the production of intermediate quark-antiquark pairs in the Fock state (
$ n = {}^{2S+1}\!L^{[c]}_{J} $ ) with total spin S, orbital angular momentum L, total angular momentum J , and CS$ c = 1 $ or CO$ c = 8 $ . The LDMEs describe the probability of hadronization from the intermediate state to physical and colorless meson. In the hard process, the photons from electrons and positrons can either collide directly or can be resolved as hadronic components, which then collide with each other or with the photon. In the NRQCD factorization framework and in the WWA picture, the differential cross section of the hadron (H) photoproduction is then formulated as a double convolution of the cross section of the parton-parton (or photon) process and the corresponding parton distribution functions:$ \begin{aligned}[b] {\rm d} \sigma &(e^+e^-\to e^+e^-H+X)\\ = &\int {\rm d}x_1f_{\gamma/e}(x_1)\int {\rm d}x_2f_{\gamma/e}(x_2)\\ &\times\sum\limits_{i,j,k}\int {\rm d}x_if_{i/\gamma}(x_i,\mu_f)\int {\rm d}x_jf_{j/\gamma}(x_j,\mu_f)\\ &\times\sum\limits_n{\rm d}\sigma(ij\to b\overline{b}[n]+k)\langle{\cal O}^H[n]\rangle, \end{aligned} $

(2) where
$ f_{i/\gamma}(x) $ is the Glück-Reya-Schienbein (GRS) parton distribution function in the photon [41],$ d\sigma(ij\to b\overline{b}[n]+k) $ are the differential partonic cross sections for$ i,j = \gamma,g,q,\bar{q} $ and$ k = g,q,\bar{q} $ with$ q = u,d,s $ .$ b\overline{b}[n] $ is the intermediate$ b\overline{b} $ Fock state with$ n = {}^3\!S_1^{(1)},{}^1\!S_0^{(8)},{}^3\!S_1^{(8)},{}^3\!P_J^{(8)} $ for$ \Upsilon(mS) $ and$ n = {}^3\!P_J^{(1)},{}^3\!S_1^{(8)} $ for$ H = \chi_{bJ}(mP) $ , where$ m = 1, 2,3 $ and$ J = 0,1,2 $ .$ \langle{\cal O}^H[n]\rangle $ is the LDME of H.In addition to the direct production route,
$ \Upsilon $ mesons can also be produced via decays of heavier charmonia such as$ \chi_{bJ}(mP) $ . These feed-down contributions can be taken into account by multiplying their direct-production cross sections with the decay branching ratios to lighter ones, e.g.,$ \begin{aligned}[b] {\rm d}\sigma^{{{\rm{total}} }\;\Upsilon(1S)} =& {\rm d}\sigma^{\Upsilon(1S)}\\ &+\sum\limits_{m,J}{\rm d}\sigma^{\chi_{bJ}(mP)}Br(\chi_{bJ}(mP)\rightarrow \Upsilon(1S))\\ &+\sum\limits_{m = 2,3}{\rm d}\sigma^{\Upsilon(mS)}Br(\Upsilon(mS)\rightarrow \Upsilon(1S)). \end{aligned} $

(3) -
The FDC package [42] was used for generating the Fortran source for numerical calculations, for all of the related physical processes. In the calculations of sub parton-parton processes, the electromagnetic fine structure constant was set to
$ \alpha $ = 1/128 for a typical energy scale on the order of$ 10 {\; {\rm{GeV}}} $ , and one-loop running strong coupling constant$ \alpha_s(\mu_r) $ was used. The mass of the bottom quark was set to$ m_b = m_H/2 $ , to conserve the gauge invariance of the hard-scattering amplitude. The relevant quarkonia masses and branching ratios can be found in Refs. [43, 44]. As for Br($ \chi_{bJ}(3P)\rightarrow \Upsilon(mS) $ ), we used the values in Table 2 of Ref. [17]. The factorization scale ($ \mu_{\rm f} $ ) and the renormalization scale ($ \mu_{\rm r} $ ) were$ \mu_{\rm f} = \mu_{\rm r} = \mu_0 = $ $\sqrt{4m_b^2+p_t^2} $ as the default choice and were varied independently from$ \mu_0/2 $ to$ 2\mu_0 $ in the uncertainty estimations; here,$ p_t $ is the transverse momentum of H meson. A shift$ p_t^H\approx p_t^{H'}\times(M_H/M_{H'}) $ was also used when considering kinematic effects owing to higher excited states.The CS LDMEs are related to the wave functions at the origin by
$ \begin{aligned}[b] &\langle{\cal O}^{\Upsilon(nS)}(^{3}S^{[1]}_{1})\rangle =\frac{9}{2\pi}|R_{\Upsilon(nS)}(0)|^{2}, \\ &\langle{\cal O}^{\chi_{bJ}(mP)}(^{3}P^{[1]}_{J})\rangle = \frac{3}{4\pi}(2J+1)|R'_{\chi_{b}(mP)}(0)|^{2}. \end{aligned} $

(4) The wave functions at the origin can be obtained using the potential model [45] and are listed in Table 1.
$\Upsilon(nS)$ 

$|R_{\Upsilon(nS)}(0)|^{2}$ 

$\chi_b(mP)$ 

$|R'{\chi_{b(mP)}}(0)|^{2}$ 

1S 6.477 GeV3 1P 1.417 GeV5 2S 3.234 GeV3 2P 1.653 GeV5 3S 2.474 GeV3 3P 1.794 GeV5 Table 1. Radial wave functions at the origin [45].
Several sets of CO LDMEs can be found in literature, and it is instructive to compare their predictions regarding the
$ \Upsilon $ photoproduction in$ e^+e^- $ collisions. We employed four different sets of CO LDMEs, listed in Table 2. The values of Feng1(2,3) were taken from Table 2(3,4) of Ref. [18], and these three sets of CO LDMEs were obtained using different fitting schemes. The set of Han2016 was taken from Ref. [17], where the authors decomposed the contribution of P-wave CO subprocesses into a linear combination of two S-wave subprocesses and consequently extracted two linear combinations with three CO LDMEs, obtainingstate Feng1 Feng2 Feng3 Han2016 $ \langle\mathcal{O}^{\Upsilon(1S)}({}^1\!S_0^{[8]})\rangle $ 

13.6 10.1 11.6 13.7 $ \langle\mathcal{O}^{\Upsilon(1S)}({}^3\!S_1^{[8]})\rangle $ 

0.61 0.73 0.47 1.17 $ \langle\mathcal{O}^{\Upsilon(1S)}({}^3\!P_0^{[8]})\rangle/m_Q^2 $ 

−0.93 −0.23 −0.49 − $ \langle\mathcal{O}^{\Upsilon(2S)}({}^1\!S_0^{[8]})\rangle $ 

0.62 1.91 −0.59 6.07 $ \langle\mathcal{O}^{\Upsilon(2S)}({}^3\!S_1^{[8]})\rangle $ 

2.22 1.88 2.94 1.08 $ \langle\mathcal{O}^{\Upsilon(2S)}({}^3\!P_0^{[8]})\rangle/m_Q^2 $ 

−0.13 −0.01 0.28 − $ \langle\mathcal{O}^{\Upsilon(3S)}({}^1\!S_0^{[8]})\rangle $ 

1.45 −0.15 −0.18 2.83 $ \langle\mathcal{O}^{\Upsilon(3S)}({}^3\!S_1^{[8]})\rangle $ 

1.32 1.53 1.52 0.83 $ \langle\mathcal{O}^{\Upsilon(3S)}({}^3\!P_0^{[8]})\rangle/m_Q^2 $ 

−0.27 −0.02 −0.01 − $ \langle\mathcal{O}^{\chi_{b0}(1P)}({}^3\!S_1^{[8]})\rangle $ 

0.94 0.91 1.16 0.71 $ \langle\mathcal{O}^{\chi_{b0}(2P)}({}^3\!S_1^{[8]})\rangle $ 

1.09 1.07 1.50 1.37 $ \langle\mathcal{O}^{\chi_{b0}(3P)}({}^3\!S_1^{[8]})\rangle $ 

0.69 1.76 1.92 2.15 $M^{\Upsilon}_{0,r_0} = \langle O^{\Upsilon}(^1S_0^8)\rangle+\frac{r_0}{m^2_b}\langle O^{\Upsilon}(^3P_0^8)\rangle, $

(5) $ M^{\Upsilon}_{1,r_1} = \langle O^{\Upsilon}(^3S_1^8)\rangle+\frac{r_1}{m^2_b}\langle O^{\Upsilon}(^3P_0^8)\rangle, $

(6) where
$ r_0 $ = 3.8,$ r_1 $ = −0.52,$ M^{\Upsilon}_{0,r_0} = 13.70\times10^{-2} $ GeV3, and$ M^{\Upsilon}_{1,r_1} = 1.17\times10^{-2} $ GeV3.Table 3 lists the total cross sections for the
$ \Upsilon(1S,2S,3S) $ photoproduction at three typical collision energies at the CEPC. It shows that the cross sections increase with collision energy, and the contribution of CO is much stronger than that of CS. The integrated luminosities per year at the CEPC are 8, 2.6, and 0.8$ \; {\rm ab}^{-1} $ for collision energies 91.2, 161, and 240 GeV, respectively. The CEPC is planned to be operated for the first seven years as a Higgs factory (240 GeV), followed by a two-year-long operation as a Super Z factory (91 GeV) and a one-year-long operation as a W factory (161 GeV). Therefore, many$ \Upsilon $ mesons will be produced, and by employing LDMEs of Han2016, for example, the predicted yearly meson yields are$ 7.86\times10^4 $ (91.2 GeV),$ 7.91\times10^4 $ (161 GeV), and$ 4.81\times10^4 $ (240 GeV)$ \Upsilon(1S) $ . In the following discussion, we adopt$ \sqrt{S} = 240 $ GeV for the Higgs factory is the primary physics usage of the CEPC.$\sqrt{S}$ /GeV

91.2 161 240 CS, NRQCD CS, NRQCD CS, NRQCD $\sigma_{\Upsilon(1S)}$ /fb

0.88, 10.99 3.13, 34.23 6.34, 67.66 $\sigma_{\Upsilon(2S)}$ /fb

0.32, 3.75 1.15, 11.86 2.43, 23.75 $\sigma_{\Upsilon(3S)}$ /fb

0.20, 1.56 0.71, 5.02 1.51, 10.13 Table 3. Total cross sections for the
$ \Upsilon(1S,2S,3S) $ photoproduction at the CEPC, for three typical collision energies. Here, we consider the feed-down contributions and take Han2016 LDMEs for the NRQCD predictions.Figure 1 shows the
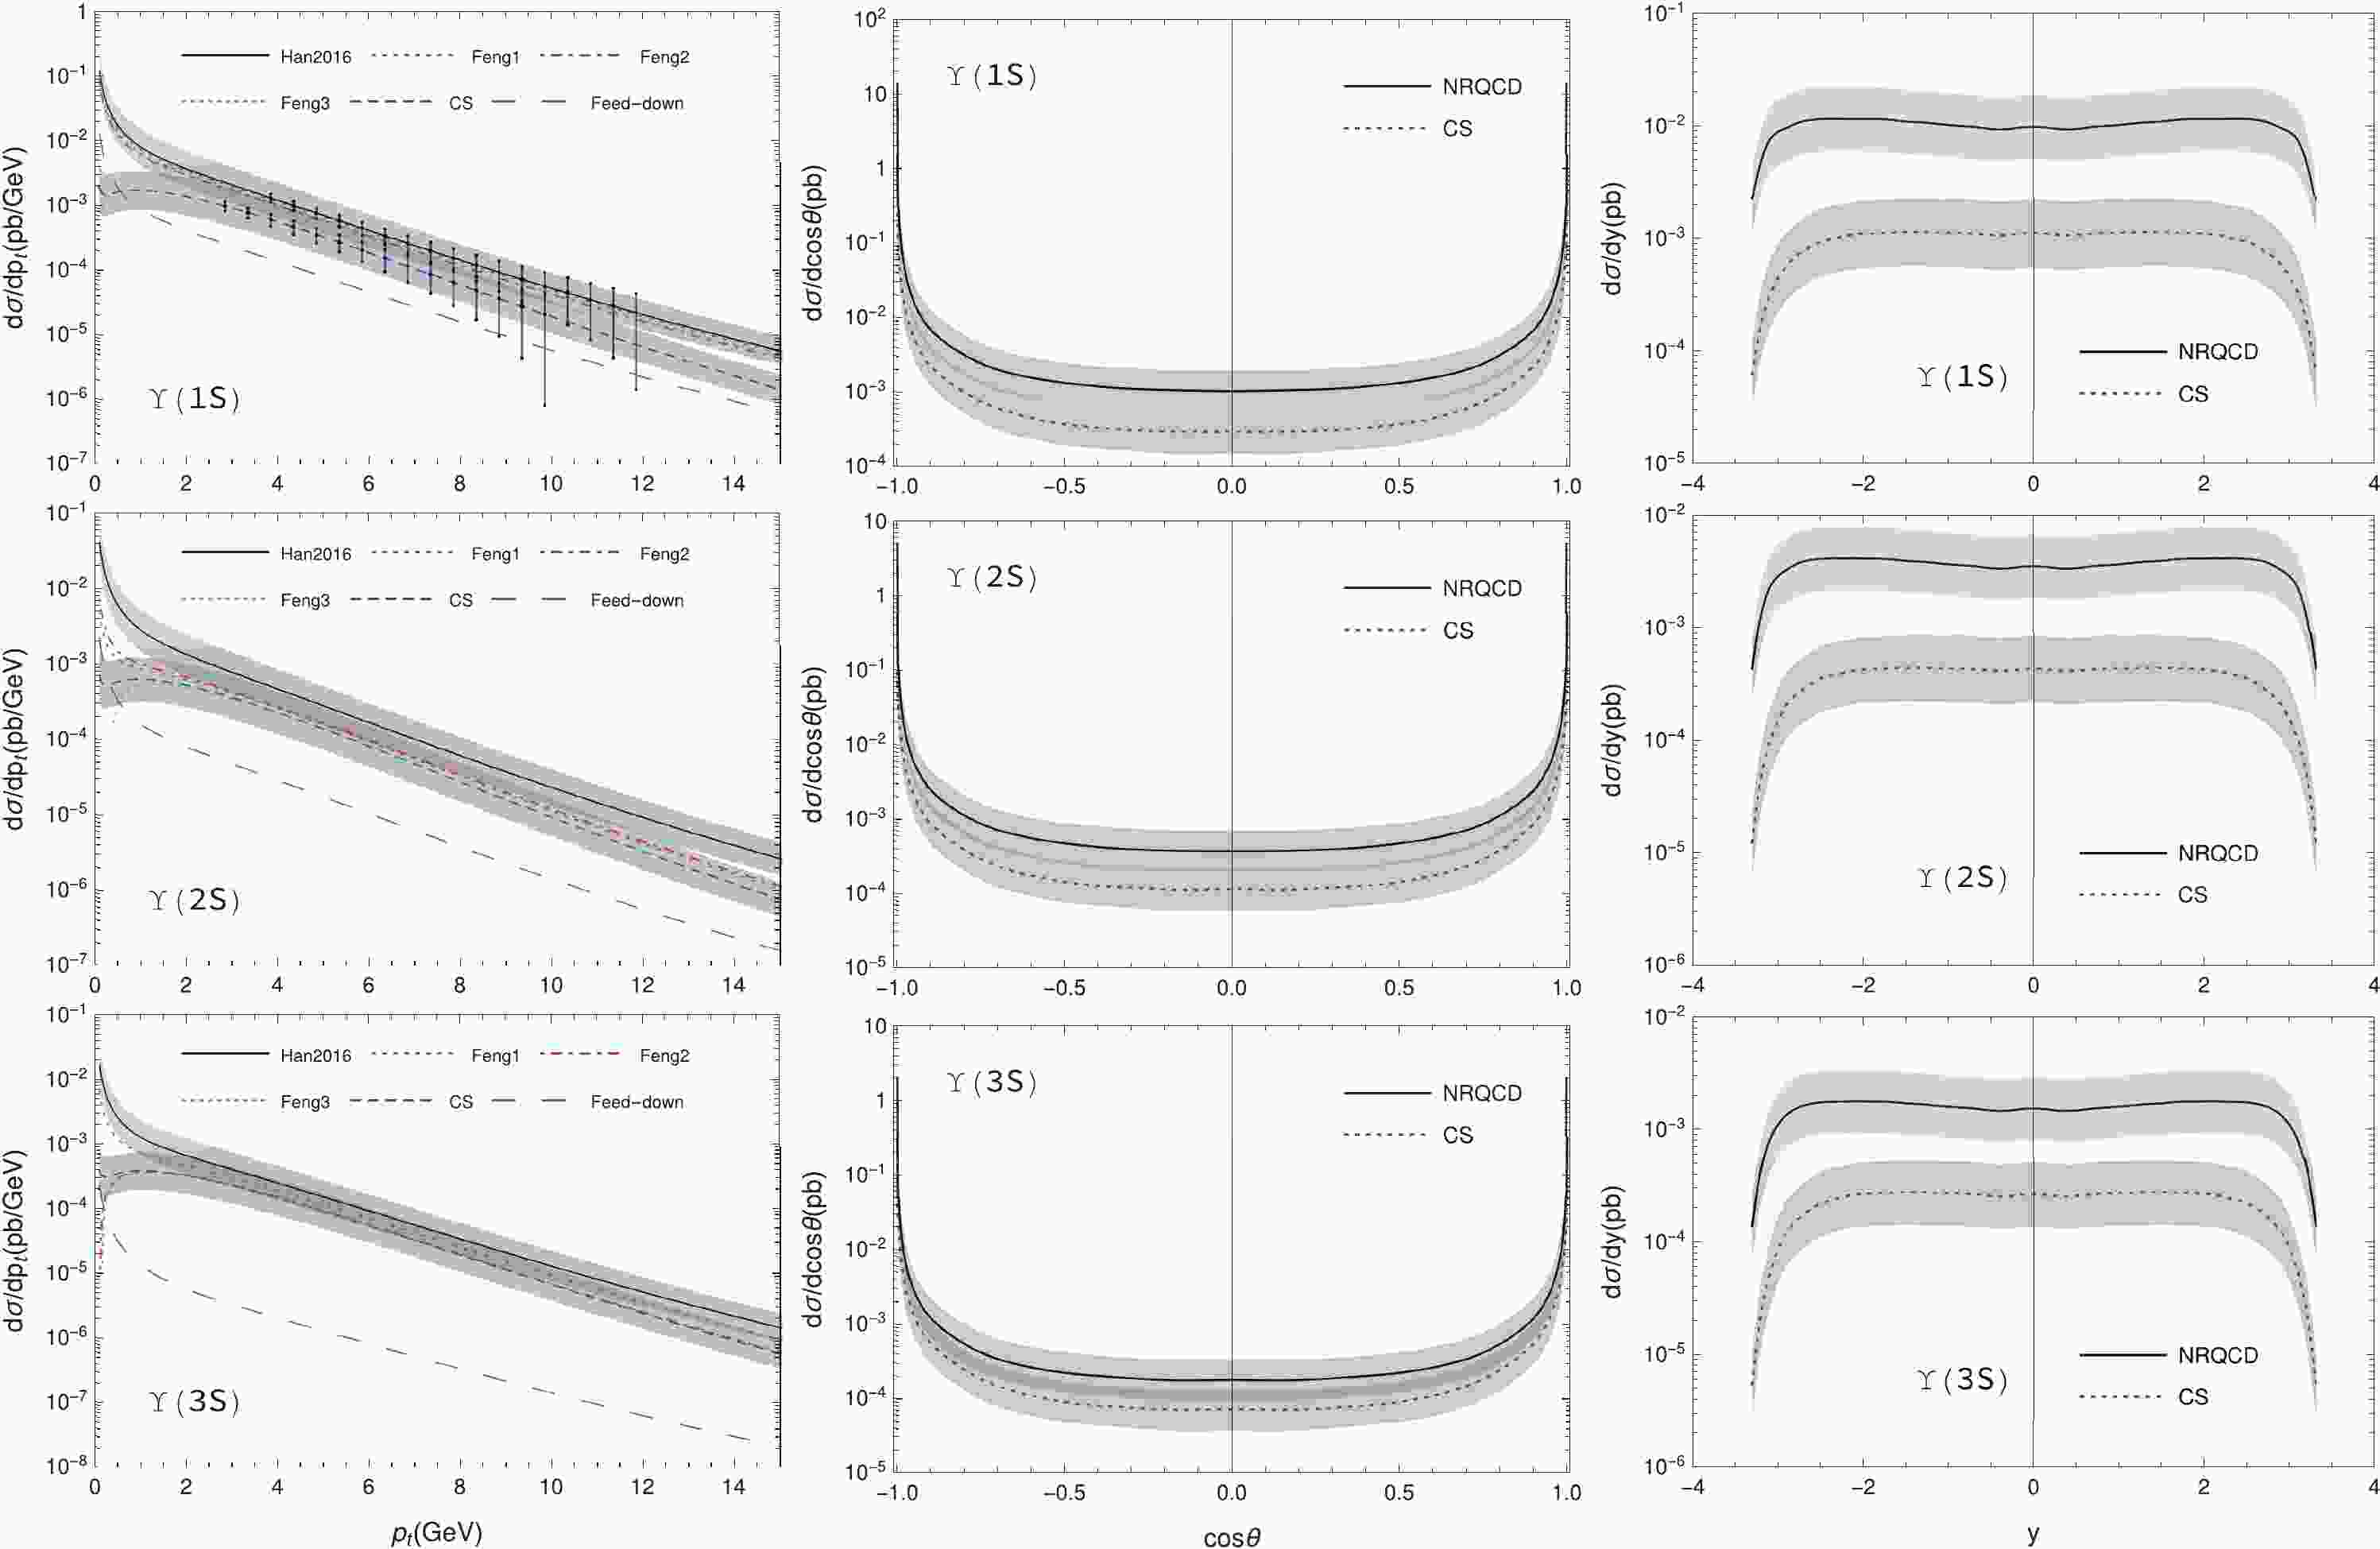
$ p_t $ , cos$ \theta $ , and rapidity (y) distributions of the$ \Upsilon $ photoproduction, where$ \theta $ is the angle between the$ \Upsilon $ momentum and the$ e^+e^- $ beam. Both cos$ \theta $ and y distributions were calculated assuming the cut$ p_t\geqslant 0.01 {\; {\rm{GeV}}} $ . We varied$ \mu_{\rm r} $ and$ \mu_{\rm f} $ from$ \mu_0/2 $ to$ 2\mu_0 $ to estimate theoretical uncertainties. When setting$ \mu_{\rm r} = \mu_{\rm f} $ and varying them simultaneously, the uncertainties canceled each other to some extent. Hence, we varied them independently, and the largest uncertainties were obtained with the upper bound for$ \mu_{\rm r} = \mu_0/2,\;\mu_{\rm f} = 2\mu_0 $ and the lower bound for$ \mu_{\rm r} = 2\mu_0,\;\mu_{\rm f} = \mu_0/2 $ , as shown by the light gray bands in Fig. 1. Most of these uncertainties were owing to the variation in$ \mu_{\rm f} $ in the GRS parton distribution functions of the photon [41]. The$ p_t $ distributions in Fig. 1 show that different CO LDMEs in Table 2 do not yield consistent predictions for the$ \Upsilon $ photoproduction, and Feng2 and Feng3 even give unphysical results for$ \Upsilon(2S) $ and$ \Upsilon(3S) $ . This situation differs from that for the$ \Upsilon $ hadroproduction [18], where the results of these CO LDMEs sets show little difference, although they themselves have sizable differences. From the curves in Fig. 1, after considering the uncertainties, there is no significant difference between the NRQCD and CS predictions for$ p_t $ and$ \cos\theta $ distributions. However, they are distinguishable in their y plots. This suggests that the y distribution may be a better observable than$ p_t $ and$ \cos\theta $ for discriminating between the CO and CS mechanisms at the CEPC.
Figure 1. (color online) The
$ p_t $ (left), cos$ \theta $ (mid), and y (right) distributions of the$ \Upsilon $ photoproduction. The cos$ \theta $ and y plots only employ the CO LDMEs of Han2016. The light gray bands represent the theoretical uncertainties from the$ \mu_{\rm r} $ and$ \mu_{\rm f} $ dependence, and the vertical lines in the$ p_t $ distribution plots show the statistical error estimated from our simple detector simulations. Here, only the uncertainties for CS and CO LDMEs of Han2016 are shown.In Fig. 1, the feed-down contributions are shown by employing the CO LDMEs of Han2016 (default choice). Evidently, most of the
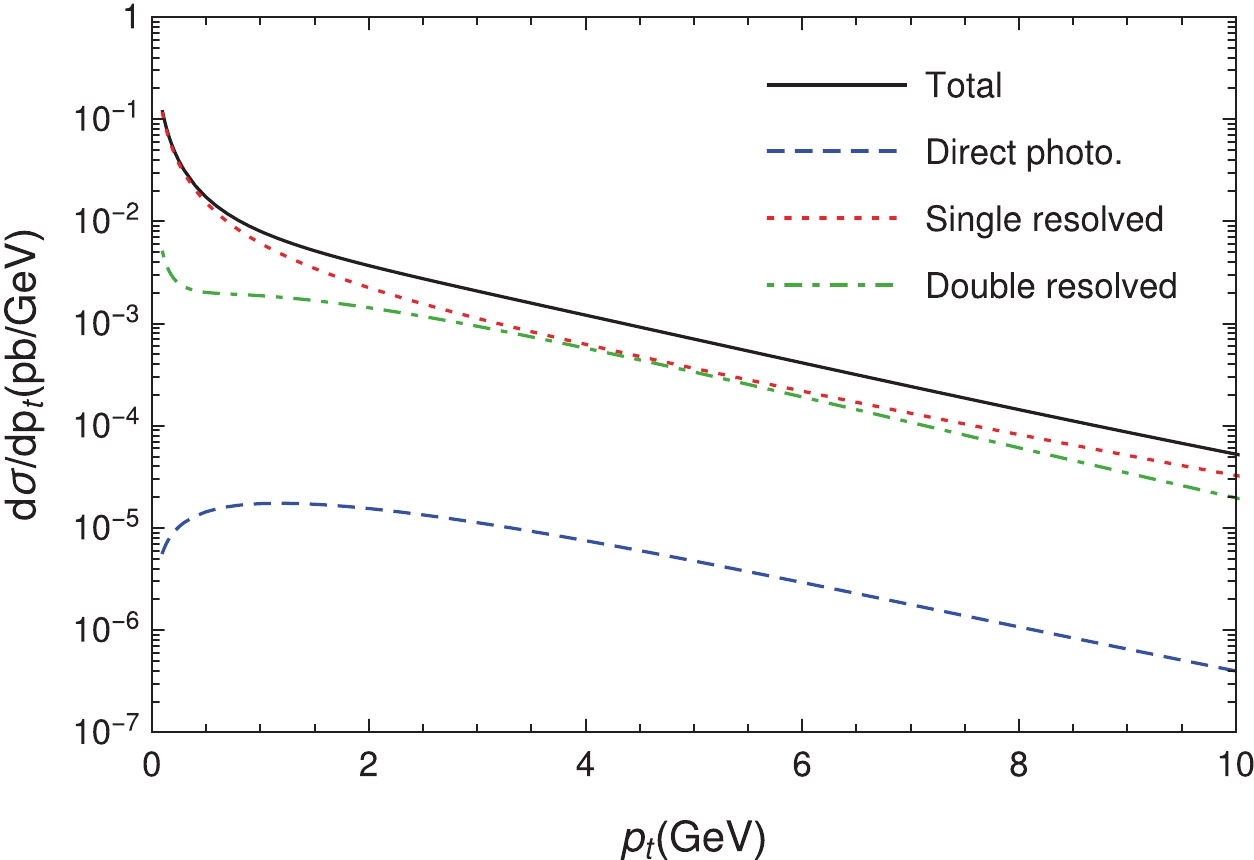
$ \Upsilon $ mesons are produced directly. In the region$ 0.1 {\; {\rm{GeV}}}\leqslant p_t\leqslant 10 {\; {\rm{GeV}}} $ , for example, only (11, 5.6, 1.1)% of$ \Upsilon(1S,2S,3S) $ are owing to the decays of heavier charmonia. The resolved channels are also dominated, as shown in Fig. 2. As a reference, for the$ p_t $ distribution integrated from 0.1 to 10$ {\; {\rm{GeV}}} $ , the direct, single-resolved, and double-resolved channels account for 0.2%, 80.4%, and 19.4% of the NRQCD prediction, respectively.
Figure 2. (color online) The
$ p_t $ distributions of the cross section, for direct photoproduction and resolved photoproduction.Figure 3 presents the distributions for the number of
$ \Upsilon(1S,2S,3S) $ events, as functions of$ p_t $ (upper),$ \cos\theta $ (middle), and y (lower), respectively, for the integrated luminosity of$ 5.6\; {\rm{{ab}}}^{-1} $ at the CEPC [35]. The bin widths are 0.5$ {\; {\rm{GeV}}} $ for$ p_t $ , 0.1 for$ \cos\theta $ , and 0.2 for y. These results suggest that, at the CEPC, the number of events is considerable for discriminating between CS and NRQCD.
Figure 3. (color online) The event number distributions for
$ \Upsilon(1S,2S,3S) $ . The bin widths are 0.5$ {\; {\rm{GeV}}} $ for$ p_t $ , 0.1 for$ \cos\theta $ , and 0.2 for y. The y plots use the same legends as$ p_t $ .According to the
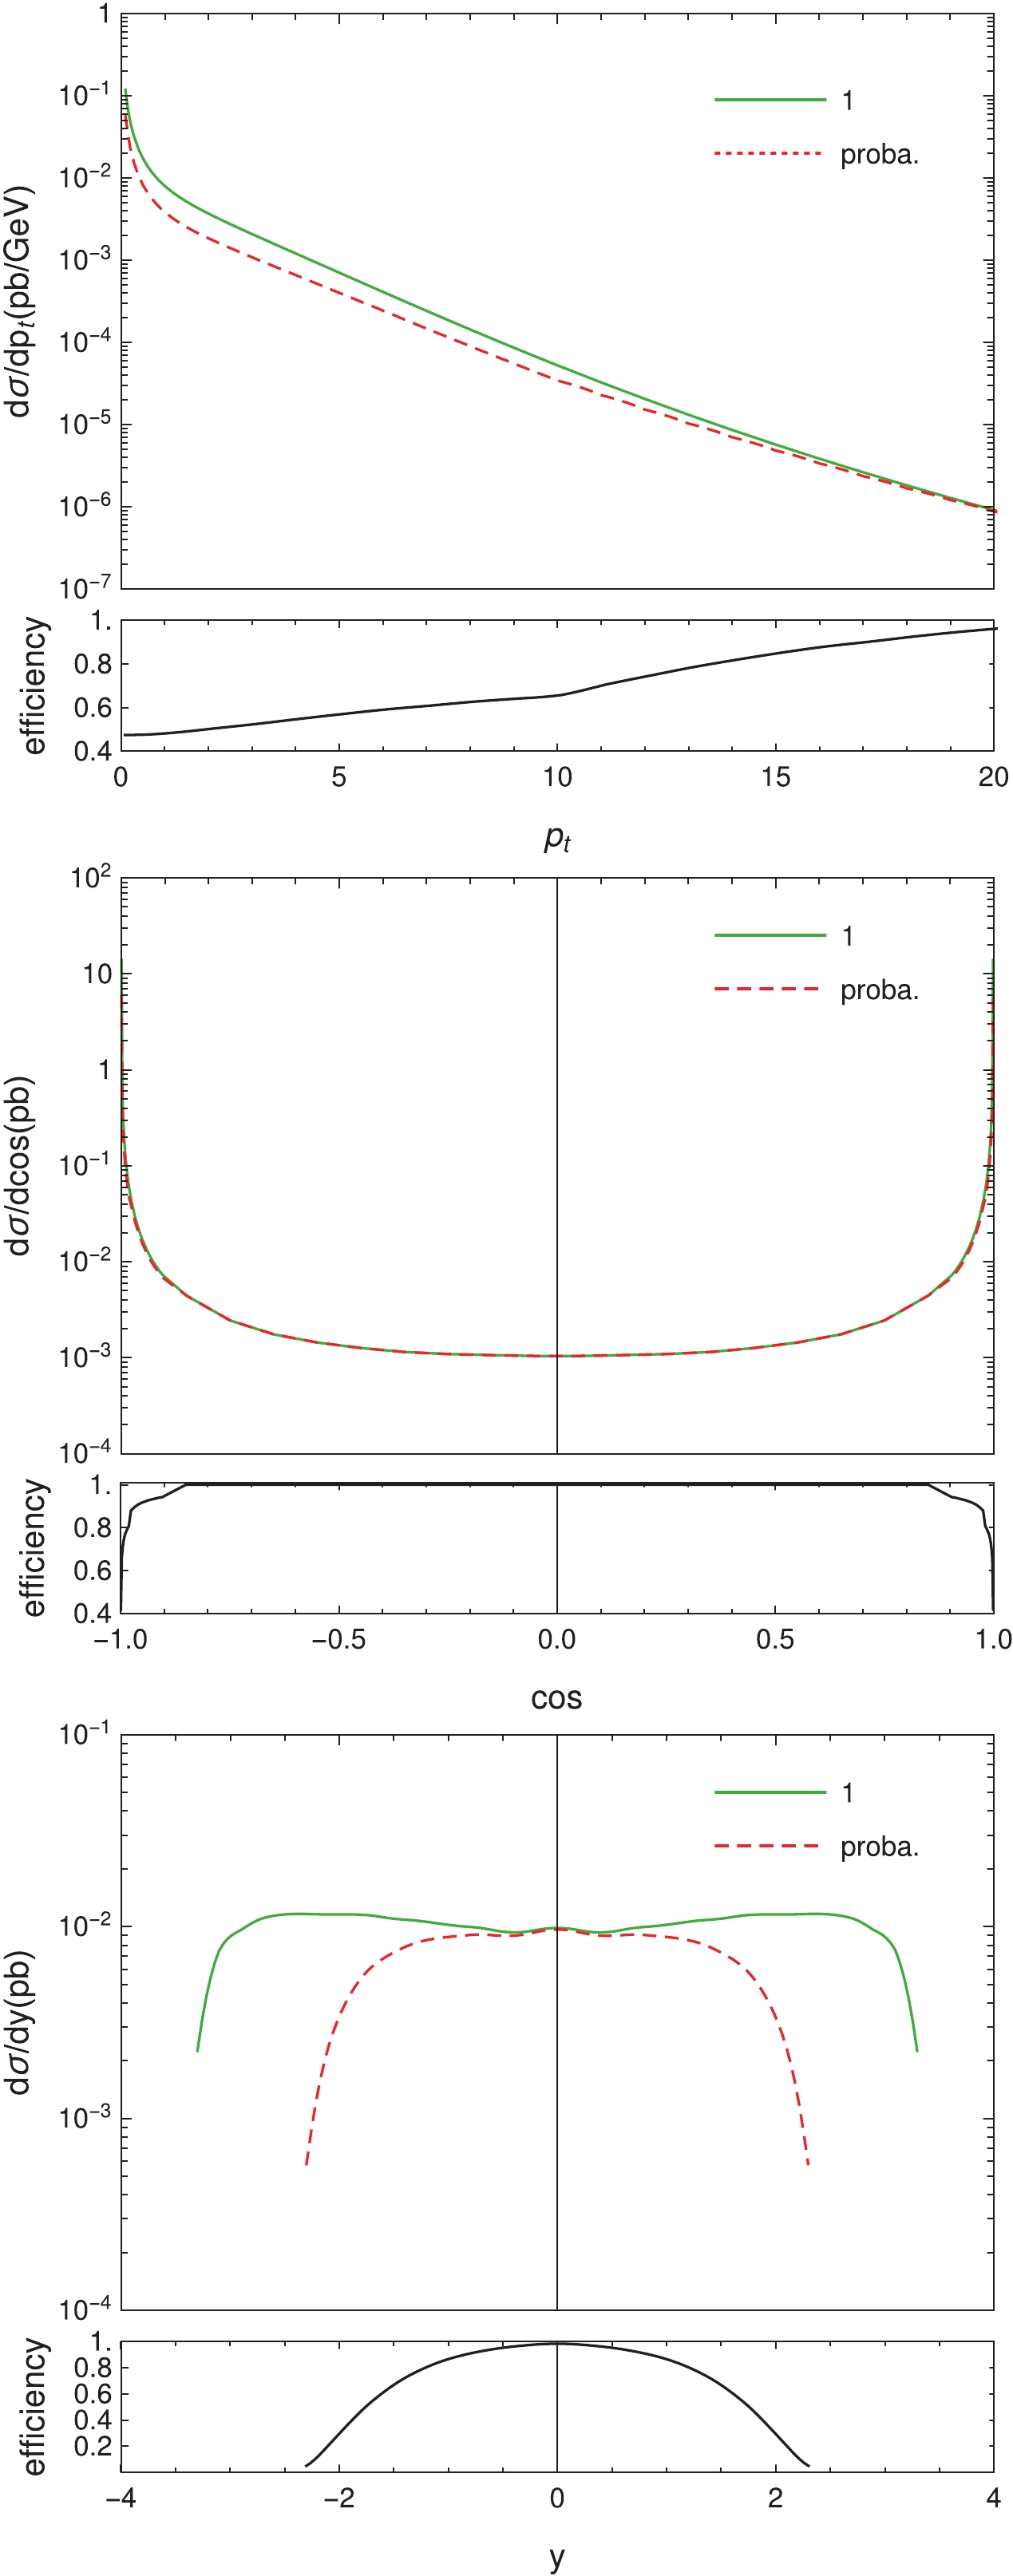
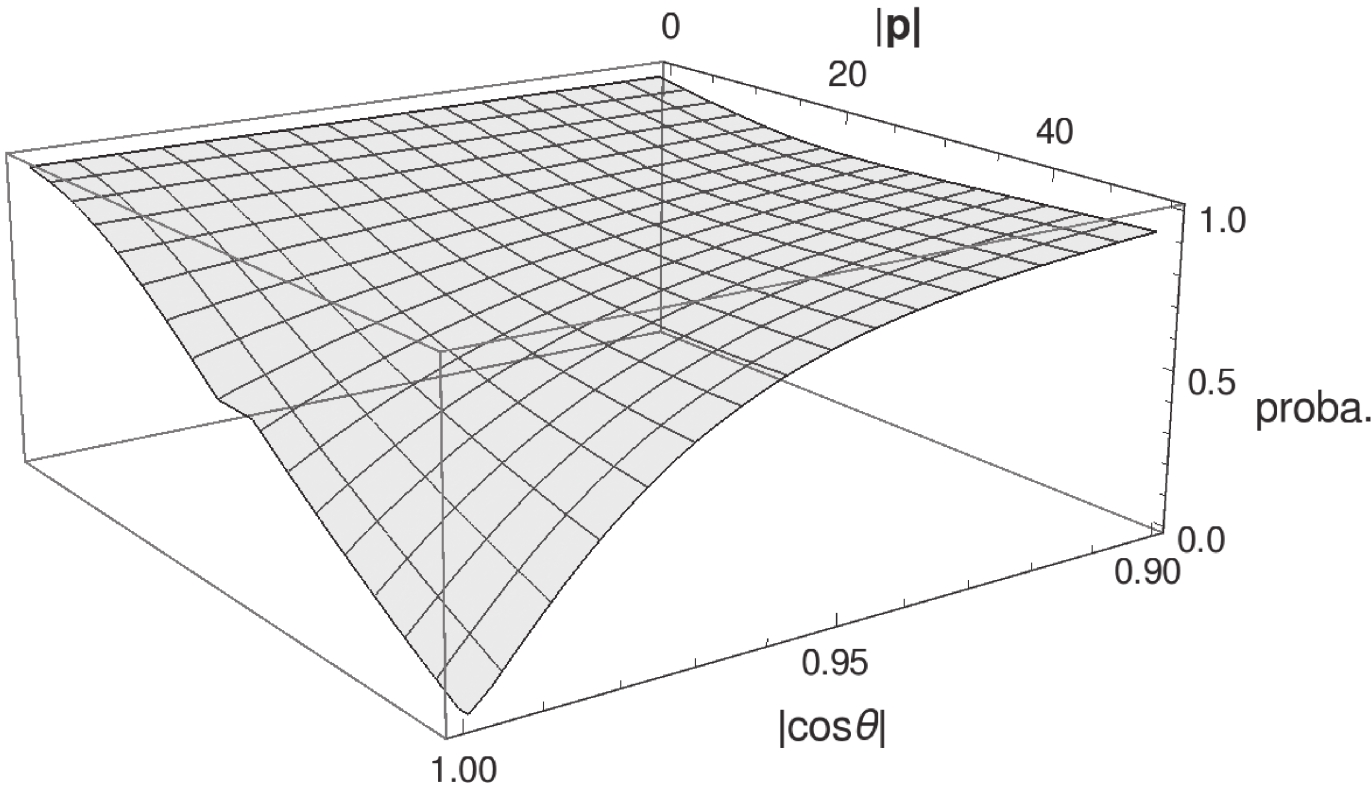
$ \cos\theta $ plots in Fig. 3, most of the$ \Upsilon $ mesons are located in the closed beam region, and actually, more than 90% of the$ \Upsilon(1S) $ mesons are inside$ |\cos\theta|\geqslant 0.98 $ , which is the angular cut-off for the experimental detection. In fact, however,$ \Upsilon $ mesons decay almost immediately after their production at the colliding point. The$ \mu^+\mu^- $ pair, for example, is used for reconstructing the$ \Upsilon $ mesons in experiments, and hence, the probability of detecting$ \mu^+\mu^- $ pairs should be investigated. If both$ \mu^+ $ and$ \mu^- $ are detected in the laboratory frame, their parent$ \Upsilon $ meson would be a valid event. So, there is an issue of detection efficiency for$ \Upsilon $ . For simplicity, we assume that, in the center-of-mass frame of$ \Upsilon $ , the$ \mu^+\mu^- $ pair is isotropic with respect to the entire$ 4\pi $ solid angle. Then, we can easily calculate the probability of a$ \Upsilon $ meson with a given 4-momentum being a valid event. Some brief derivations of this simple “detector simulation” can be found in the Appendix of Ref. [37]. In Fig. 4, we plot the two-dimensional distribution of the probability as a function of the magnitude of the 3-momentum and$ |\cos\theta| $ of$ \Upsilon(1S) $ . It shows that the$ \Upsilon(1S) $ meson, which has$ |\cos\theta|\geqslant 0.98 $ but small |p|, still has the probability to be a valid event. Fig. 5 shows the kinematic distributions both before (Line-1) and after (Line-proba.) considering the detection efficiency; here, we only present the NRQCD results. The plots show that the efficiency increases with$ p_t $ , which is reasonable, as expected. The efficiency is close to one in most of the$ \cos\theta $ region, and$ \Upsilon(1S) $ mesons with smaller$ |{\rm{y}}| $ have higher probability of being valid. Consequently, there would be more valid events than those observed by directly using the experimentally detected angular cut to$ \Upsilon $ mesons.
Figure 5. (color online) The kinematic distributions of the
$ \Upsilon(1S) $ photoproduction before (Line-1) and after (Line-proba.) considering the detection efficiency. The curves in the flat frames are the corresponding efficiencies.Considering the simple “detector simulation” discussed above, the total detection efficiencies for
$ \Upsilon(1S) $ are 83.68% (91.2 GeV), 74.05% (161 GeV), and 66.68%(240 GeV). We further estimated the statistical uncertainties arising from the detection efficiency for the measurements on the$ p_t $ distributions, which are shown in Fig. 1 as the error bars at some$ p_t $ points. We set the bin width to$ \Delta p_t = 0.5 {\; {\rm{GeV}}} $ for counting the events. In the small$ p_t $ region, the uncertainties are smaller. Specifically, the uncertainties of the CS and NRQCD (employing Han2016 CO LDMEs) distributions are approximately 12.9% and 6.3% for$ p_t = 1 {\; {\rm{GeV}}} $ and approximately 26.5% and 18.9% for$ p_t = 5 {\; {\rm{GeV}}} $ . In the larger$ p_t $ region, there would be less than one$ \mu^+\mu^- $ pair in each bin for$ p_t>10 {\; {\rm{GeV}}} $ and$ p_t> 12 {\; {\rm{GeV}}} $ for CS and NRQCD distributions respectively; consequently, wider bins should be used in experimental measurements. -
In this work, we have investigated the inclusive
$ \Upsilon(1S,2S,3S) $ photoproduction at the CEPC within the NRQCD framework at the leading order, including the contributions from both direct and resolved photons. The dominant contribution is the one from the CO processes; the decays of heavier bottomonia contribute 11% to the$ \Upsilon(1S) $ production. Different kinematic distributions for both the production yield and the number of events were presented based on the integrated luminosity$ 5.6\; {\rm ab}^{-1} $ at the CEPC. These results show that the rapidity (y) distribution is a better observable than both$ p_t $ and$ \cos\theta $ distributions, for distinguishing between the CS contribution and the CO one. Under simple assumptions, the detection efficiency of$ \Upsilon $ was studied, and the results demonstrate that considerable$ \Upsilon $ events could be reconstructed. Our results indicate that measurements of the$ \Upsilon $ photoproduction at the CEPC can play an important role in determining whether only CS mechanisms contribute at the$ e^+e^- $ collider as the case of charmonia production at B factories and in further testing the CO mechanism in the NRQCD framework, thus improving our understanding of heavy quarkonium physics. We suggest that inclusive$ \Upsilon $ photoproduction should be measured at the future CEPC.
Inclusive $ {{\Upsilon(1S,2S,3S)}}$ photoproduction at the CEPC
- Received Date: 2020-09-21
- Available Online: 2021-02-15
Abstract: Inclusive


 Abstract
 HTML
HTML Reference
 Related
 PDF
PDF


 DownLoad: