


 Abstract
 HTML
HTML Reference
 Related
 PDF
PDF


-
The
$ {{B^0}} {\rightarrow} {{{J/\psi}}} {{K^+}} {{K^-}} $ decay was first observed by the LHCb experiment with a branching fraction of$ (2.51\pm 0.35\pm0.19)\times10^{-6} $ [1]. It proceeds primarily through the Cabibbo-suppressed$ \bar{b}{\rightarrow}\bar{c}c\bar{d} $ transition. The$ {{K^+}} {{K^-}} $ pair can come either directly from the$ {{B^0}}$ decay via an$ s\bar{s} $ pair created in the vacuum, or from the decay of intermediate states that contain both$ d\bar{d} $ and$ s\bar{s} $ components, such as the$ a_0(980) $ resonance①. There is a potential contribution from the$ \phi $ meson as an intermediate state. The decay$ {{B^0}} {\rightarrow} {{{J/\psi}}} \phi $ is suppressed by the Okubo-Zweig-Iizuka (OZI) rule that forbids disconnected quark diagrams [2-4]. The size of this contribution and the exact mechanism to produce the$ \phi $ meson in this process are of particular theoretical interest [5-7]. Under the assumption that the dominant contribution is via a small$ d\bar{d} $ component in the$ \phi $ wave-function, arising from$ \omega-\phi $ mixing (Fig. 1(a)), the branching fraction of the$ {{B^0}} {\rightarrow} {{{J/\psi}}} \phi $ decay is predicted to be of the order of$ 10^{-7} $ [5]. Contributions to$ {{B^0}} {\rightarrow} {{{J/\psi}}} \phi $ decays from the OZI-suppressed tri-gluon fusion (Fig. 1(b)), photoproduction and final-state rescattering are estimated to be at least one order of magnitude lower [7]. Experimental studies of the decay$ {{B^0}} {\rightarrow} {{{J/\psi}}} \phi $ could provide important information about the dynamics of OZI-suppressed decays.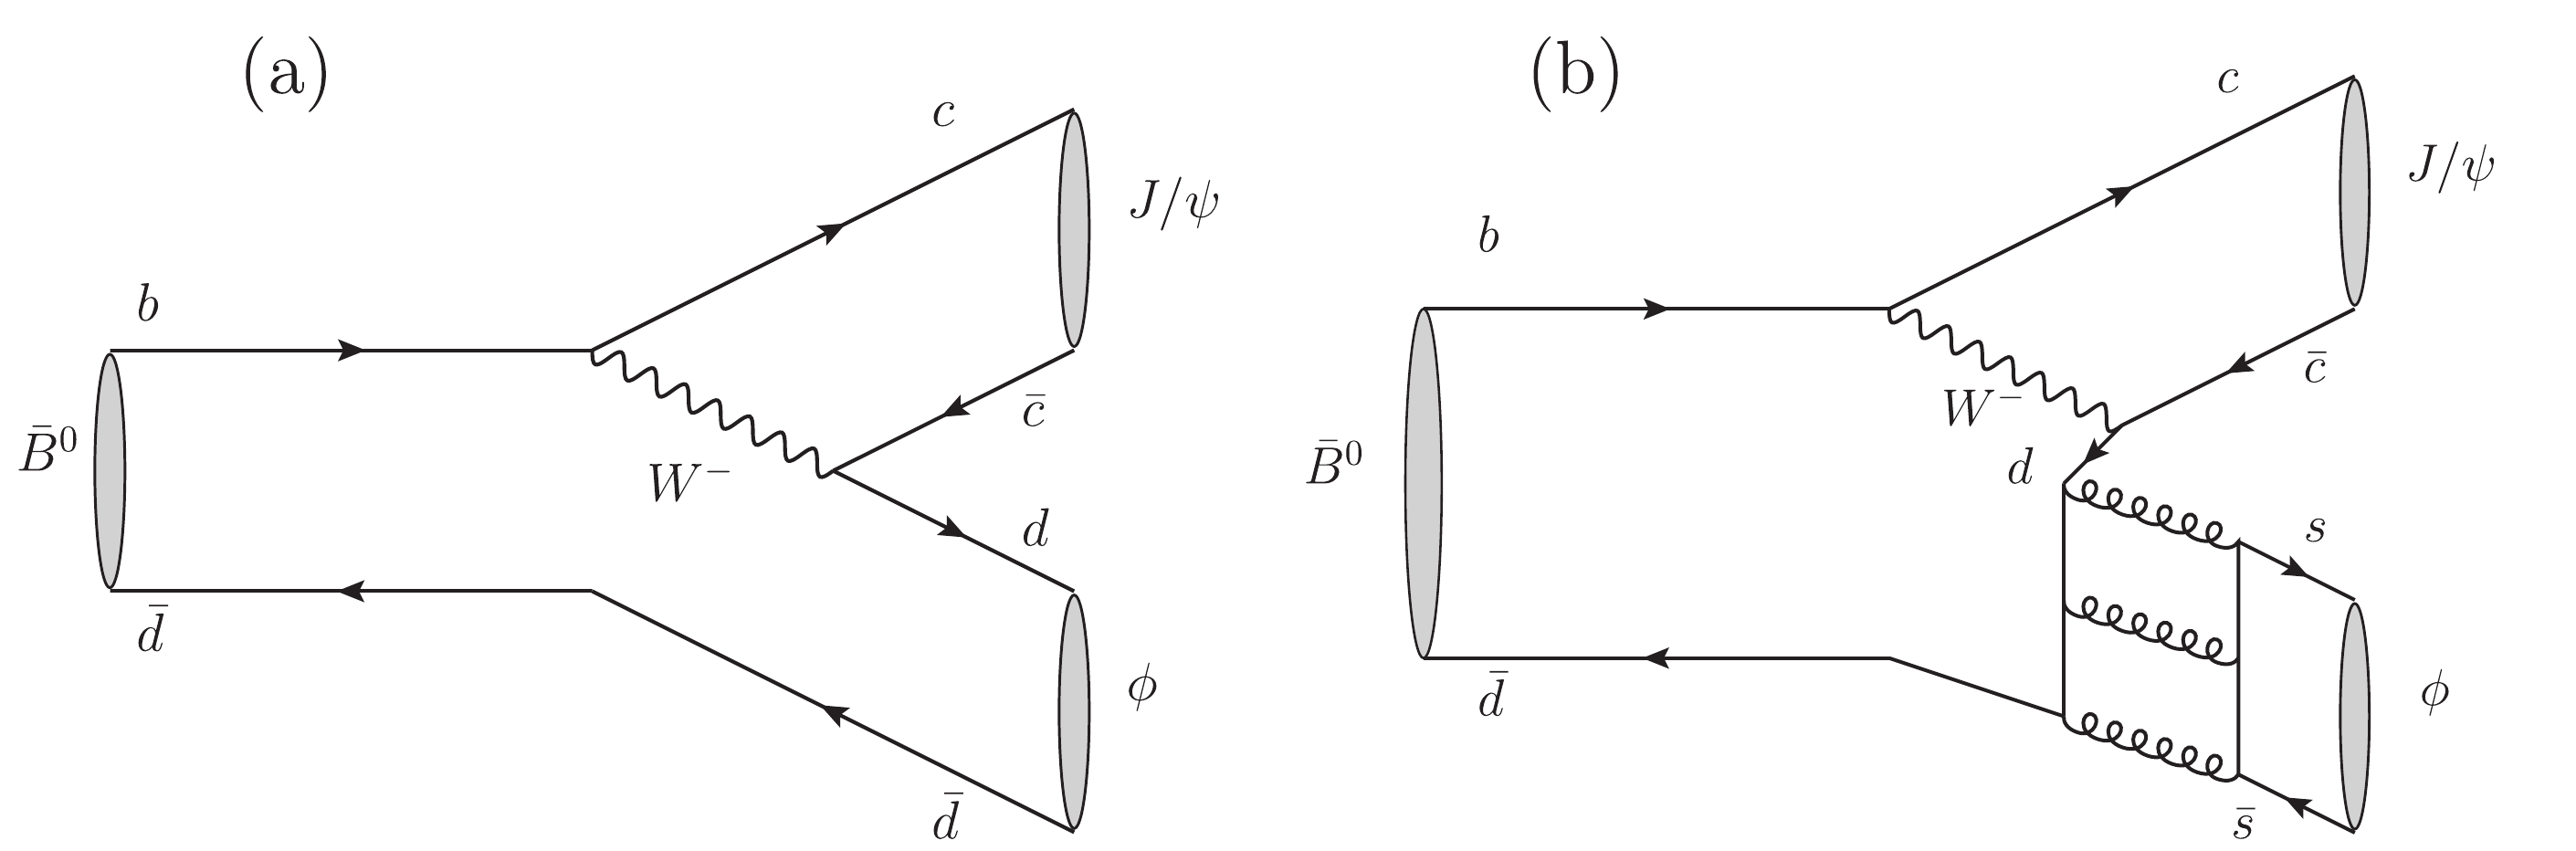
Figure 1. Feynman diagrams for the decay
$ B^0 \to J/ \psi\phi$ via (a)$\omega-\phi$ mixing and (b) tri-gluon fusion.No significant signal of
$ {{B^0}} {\rightarrow} {{{J/\psi}}} \phi $ decay has been observed in previous searches by several experiments. Upper limits on the branching fraction of the decay have been set by BaBar [8], Belle [9] and LHCb [1]. The LHCb limit was obtained using a data sample corresponding to an integrated luminosity of 1$ {{\rm{fb}}^{-1}} $ of$ pp$ collision data, collected at a centre-of-mass energy of 7$ {\rm{TeV}}$ . This paper presents an update on the search for$ {{B^0}} {\rightarrow} {{{J/\psi}}} \phi $ decays using a data sample corresponding to an integrated luminosity of 9$ {{\rm{fb}}^{-1}} $ , including 3$ {{\rm{fb}}^{-1}} $ collected at 7 and 8$ {\rm{TeV}}$ , denoted as Run 1, and 6$ {{\rm{fb}}^{-1}} $ collected at 13$ {\rm{TeV}}$ , denoted as Run 2.The LHCb measurement in Ref. [1] is obtained from an amplitude analysis of
$ {{B^0}} {\rightarrow} {{{J/\psi}}} {{K^+}} {{K^-}} $ decays over a wide$ m({{K^+}} {{K^-}} ) $ range from the$ {{K^+}} {{K^-}} $ mass threshold to 2200$ {\rm{MeV}}/c^2$ . This paper focuses on the$ \phi(1020) $ region, with the$ {{K^+}} K^+ $ mass in the range 1000–1050$ {\rm{MeV}}/c^2$ , and on studies of the$ {{{J/\psi}}} {{K^+}} {{K^-}} $ and$ {{K^+}} {{K^-}} $ mass distributions, to distinguish the$ {{B^0}} {\rightarrow} {{{J/\psi}}} \phi $ signal from the non-resonant decay$ {{B^0}} {\rightarrow} {{{J/\psi}}} {{K^+}} {{K^-}} $ and background contaminations. The abundant decay$ {B^0_s} {\rightarrow} {{{J/\psi}}} \phi $ is used as the normalisation channel. The choice of mass fits over a full amplitude analysis is motivated by several considerations. The sharp$ \phi $ mass peak provides a clear signal characteristic and the lineshape can be very well determined using the copious$ {B^0_s} {\rightarrow} {{{J/\psi}}} \phi $ decays. On the other hand, interference of the S-wave (either$ a_0(980)/f_0 $ (980) or non-resonant) and P-wave amplitudes vanishes in the$ m({{K^+}} {{K^-}} ) $ spectrum, up to negligible angular acceptance effects, after integrating over the angular variables. Furthermore, significant correlations observed between$ m({{{J/\psi}}} {{K^+}} {{K^-}} ) $ ,$ m({{K^+}} {{K^-}} ) $ and angular variables make it challenging to describe the mass-dependent angular distributions of both signal and background, which are required for an amplitude analysis. Finally, the power of the amplitude analysis in discriminating the signal from the non-$ \phi $ contribution and background is reduced by the large number of parameters that need to be determined in the fit. In addition, a good understanding of the contamination from$ {{{B^0_s} }{\rightarrow} {{{{J/\psi}}} {{K^+}} {{K^-}} }} $ decays in the$ {{B^0}} $ mass-region is essential in the search for$ {{B^0}} {\rightarrow} {{{J/\psi}}} \phi $ . -
The LHCb detector [10, 11] is a single-arm forward spectrometer covering the pseudorapidity range
$ 2<\eta <5 $ , designed for the study of particles containing b or c quarks. The detector includes a high-precision tracking system consisting of a silicon-strip vertex detector surrounding the$ pp $ interaction region, a large-area silicon-strip detector located upstream of a dipole magnet with a bending power of about$ 4\,{\rm{Tm}} $ , and three stations of silicon-strip detectors and straw drift tubes placed downstream of the magnet. The tracking system provides a measurement of the momentum, p, of charged particles with a relative uncertainty that varies from 0.5% at low momentum to 1.0% at 200$ {\rm{GeV}}/c$ . The minimum distance of a track to a primary vertex (PV), the impact parameter (IP), is measured with a resolution of$(15+ 29/{p_{\rm{T}}} )\;{\rm{\mu m}}$ , where$ {p_{\rm{T}}}$ is the component of the momentum transverse to the beam, in$ {\rm{GeV}}/c$ . Different types of charged hadrons are distinguished using information from two ring-imaging Cherenkov detectors. Photons, electrons and hadrons are identified by a calorimeter system consisting of scintillating-pad and preshower detectors, an electromagnetic and a hadronic calorimeter. Muons are identified by a system composed of alternating layers of iron and multiwire proportional chambers.Samples of simulated decays are used to optimise the signal candidate selection and derive the efficiency of selection. In the simulation,
$ pp$ collisions are generated using PYTHIA [12, 13] with a specific LHCb configuration [14]. Decays of unstable particles are described by EVTGEN [15], in which final-state radiation is generated using PHOTOS [16]. The interaction of the generated particles with the detector, and its response, are implemented using the GEANT4 toolkit [17, 18] as described in Ref. [19]. -
The online event selection is performed by a trigger, which consists of a hardware stage, based on information from the calorimeter and muon systems, followed by a software stage, which applies a full event reconstruction. An inclusive approach for the hardware trigger is used to maximise the available data sample, as described in Ref. [20]. Since the centre-of-mass energies and trigger thresholds are different for the Run 1 and Run 2 data-taking, the offline selection is performed separately for the two periods, following the procedure described below. The resulting data samples for the two periods are treated separately in the subsequent analysis procedure.
The offline selection comprises two stages. First, a loose selection is used to reconstruct both
$ {{B^0}} {\rightarrow} {{{J/\psi}}} \phi $ and$ {B^0_s} {\rightarrow} {{{J/\psi}}} \phi $ candidates in the same way, given their similar kinematics. Two oppositely charged muon candidates with$ {p_{\rm{T}}} > 500 \;{{\rm{MeV}}/c} $ are combined to form a$ {{{J/\psi}}} $ candidate. The muon pair is required to have a common vertex and an invariant mass,$ m(\mu^+\mu^-) $ , in the range 3020–3170$ {\rm{MeV}}/c^2$ . A pair of oppositely charged kaon candidates identified by the Cherenkov detectors is combined to form a$ \phi $ candidate. The$ {{K^+}} {{K^-}} $ pair is required to have an invariant mass,$ m({{K^+}} {{K^-}} ) $ , in the range 1000–1050$ {\rm{MeV}}/c^2$ . The$ {{{J/\psi}}} $ and$ \phi $ candidates are combined to form a$ B^{0}_{(s)} $ candidate, which is required to have good vertex quality and invariant mass,$ m({{{J/\psi}}} {{K^+}} {{K^-}} ) $ , in the range 5200–5550$ {\rm{MeV}}/c^2$ . The resulting$ B^{0}_{(s)} $ candidate is assigned to the PV with which it has the smallest$ {\chi^2_{\rm{IP}}} $ , where$ {\chi^2_{\rm{IP}}} $ is defined as the difference in the vertex-fit$ {\chi^2} $ of a given PV reconstructed with and without the particle being considered. The invariant mass of the$ B^{0}_{(s)} $ candidate is calculated from a kinematic fit for which the momentum vector of the$ B^{0}_{(s)} $ candidates is aligned with the vector connecting the PV to the$ B^{0}_{(s)} $ decay vertex and$ m({{{\mu^+}{\mu^-}}} ) $ is constrained to the known$ {{{J/\psi}}} $ meson mass [21]. In order to suppress the background due to the random combination of a prompt$ {{{J/\psi}}} $ meson and a pair of charged kaons, the decay time of the$ B^{0}_{(s)} $ candidate is required to be greater than 0.3$ {\rm{ps}}$ .In a second selection stage, a boosted decision tree (BDT) classifier [22, 23] is used to further suppress combinatorial background. The BDT classifier is trained using simulated
$ {B^0_s} {\rightarrow} {{{J/\psi}}} \phi $ decays representing the signal, and candidates with$ m({{{J/\psi}}} {{K^+}} {{K^-}} ) $ in the range 5480–5550$ {\rm{MeV}}/c^2$ as background. Candidates in both samples are required to have passed the trigger and the loose selection described above. Using a multivariate technique [24], the$ {B^0_s} {\rightarrow} {{{J/\psi}}} \phi $ simulation sample is corrected to match the observed distributions in background-subtracted data, including that of the$ {p_{\rm{T}}}$ and pseudorapidity of the$ {B^0_s}$ , the$ {\chi^2_{\rm{IP}}} $ of the$ {B^0_s}$ decay vertex, the$ {\chi^2} $ of the decay chain of the$ {B^0_s}$ candidate [25], the particle identification variables, the track-fit$ {\chi^2} $ of the muon and kaon candidates, and the numbers of tracks measured simultaneously in both the vertex detector and tracking stations.The input variables of the BDT classifier are the minimum track–fit
$ {\chi^2} $ of the muons and the kaons, the$ {p_{\rm{T}}} $ of the$ B^{0}_{(s)} $ candidate and the$ {{K^+}} {{K^-}} $ combination, the$ {\chi^2} $ of the$ B^{0}_{(s)} $ decay vertex, particle identification probabilities for muons and kaons, the minimum$ {\chi^2_{\rm{IP}}} $ of the muons and kaons, the$ {\chi^2} $ of the$ {{{J/\psi}}} $ decay vertex, the$ {\chi^2_{\rm{IP}}} $ of the$ B^{0}_{(s)} $ candidate, and the$ {\chi^2} $ of the$ B^{0}_{(s)} $ decay chain fit. The optimal requirement on the BDT response for the$ B^{0}_{(s)} $ candidates is obtained by maximising the quantity$ \varepsilon/\sqrt{N} $ , where$ \varepsilon $ is the signal efficiency determined in simulation and N is the number of candidates found in the$ \pm15 \;{\rm{MeV}}/c^2$ region around the known$ {{B^0}}$ mass [21].In addition to combinatorial background, the data also contain fake candidates from
$ {\varLambda _b^0} {\rightarrow} {{{J/\psi}}} {p}{{K^-}} $ ($ {{B^0}} {\rightarrow} {{{J/\psi}}} {{K^+}} {{{\pi^-}}} $ ) decays, where the proton (pion) is misidentified as a kaon. To suppress these background sources, a$ B^{0}_{(s)} $ candidate is rejected if its invariant mass, computed with one kaon interpreted as a proton (pion), lies within$ \pm 15 \;{\rm{MeV}}/c^2$ of the known$ {\varLambda _b^0} $ ($ {{B^0}} $ ) mass [21] and if the kaon candidate also satisfies proton (pion) identification requirements.A previous study of
$ {B^0_s} {\rightarrow} {J/\psi} \phi $ decays found that the yield of the background from$ {{B^0}} {\rightarrow} {J/\psi} {{K^+}} {{{\pi^-}}} $ decays is only 0.1% of the$ {B^0_s} {\rightarrow} {{{J/\psi}}} \phi $ signal yield [20]. Furthermore, only 1.2% of these decays, corresponding to about one candidate (three candidates) in the Run 1 (Run 2) data sample, fall in the$ {{B^0}}$ mass region 5265–5295$ {\rm{MeV}}/c^2$ , according to simulation. Thus this background is neglected. The fraction of events containing more than one candidate is 0.11% in Run 1 data and 0.70% in Run 2 data and these events are removed from the total data sample. The acceptance, trigger, reconstruction and selection efficiencies of the signal and normalization channels are determined using simulation, which is corrected for the efficiency differences with respect to the data. The ratio of the total efficiencies of$ {{B^0}} {\rightarrow} {J/\psi} \phi $ and$ {B^0_s} {\rightarrow} {J/\psi} \phi $ is estimated to be$ 0.99\pm0.03\pm0.03 $ for Run 1 and$ 0.99\pm 0.01\pm0.02 $ for Run 2, where the first uncertainties are statistical and the second ones are associated with corrections to the simulation. The polarisation amplitudes are assumed to be the same in$ {{B^0}} {\rightarrow} {J/\psi} \phi $ and$ {B^0_s} {\rightarrow} {J/\psi} \phi $ decays. The systematic uncertainty associated with this assumption is found to be small and is neglected. -
There is a significant correlation between
$ m(J/ {{{\psi}}} {{K^+}} {{K^-}} ) $ and$ m({{K^+}} {{K^-}} ) $ in$ B^0_{(s)}{\rightarrow} {{{J/\psi}}} {{K^+}} {{K^-}} $ decays, as illustrated in Fig. 2. Hence, the search for$ {{B^0}} {\rightarrow} {{{J/\psi}}} \phi $ decays is carried out by performing sequential fits to the distributions of$ m({{{J/\psi}}} {{K^+}} {{K^-}} ) $ and$ m({{K^+}} {{K^-}} ) $ . A fit to the$ m(J/ {{{\psi}}} {{K^+}} {{K^-}} ) $ distribution is used to estimate the yields of the background components in the$ \pm15 \;{\rm{MeV}}/c^2$ regions around the$ {B^0_s}$ and$ {{B^0}}$ nominal masses. A subsequent simultaneous fit to the$ m({{K^+}} {{K^-}} ) $ distributions of candidates falling in the two$ {{{J/\psi}}} {{K^+}} {{K^-}} $ mass windows, with the background yields fixed to their values from the first step, is performed to estimate the yield of$ {{B^0}} {\rightarrow} {{{J/\psi}}} \phi $ decays.
Figure 2. (color online) Distributions of the invariant mass
$m( K^+ K^- )$ in different$m( J/ \psi K^+ K^- )$ intervals with boundaries at 5220, 5265, 5295, 5330, 5400 and 5550$ {\rm{MeV}}/c^2$ . They are obtained using simulated$ B^0_s \to J/ \psi\phi$ decays and normalised to unity.The probability density function (PDF) for the
$ m({{{J/\psi}}} {{K^+}} {{K^-}} ) $ distribution of both the$ {{B^0}} {\rightarrow} {{{J/\psi}}} {{K^+}} {{K^-}} $ and$ {B^0_s} {\rightarrow} {{{J/\psi}}} {{K^+}} {{K^-}} $ decays is modelled by the sum of a Hypatia [26] and a Gaussian function sharing the same mean. The fraction, the width ratio between the Hypatia and Gaussian functions and the Hypatia tail parameters are determined from simulation. The$ m({{{J/\psi}}} {{K^+}} {{K^-}} ) $ shape of the$ {\varLambda _b^0} {\rightarrow} {{{J/\psi}}} {p}{{K^-}} $ background is described by a template obtained from simulation, while the combinatorial background is described by an exponential function with the slope left to vary. The PDFs of$ {{B^0}} {\rightarrow} {{{J/\psi}}} {{K^+}} {{K^-}} $ and$ {B^0_s} {\rightarrow} {{{J/\psi}}} {{K^+}} {{K^-}} $ decays share the same shape parameters, and the difference between the$ {B^0_s}$ and$ {{B^0}}$ masses is constrained to the known mass difference of$ 87.23\pm0.16 $ $ {\rm{MeV}}/c^2$ [21].An unbinned maximum-likelihood fit is performed in the
$ m({{{J/\psi}}} {{K^+}} {{K^-}} ) $ range 5220–5480$ {\rm{MeV}}/c^2$ for Run 1 and Run 2 data samples separately. The yield of$ {\varLambda _b^0} {\rightarrow} {{{J/\psi}}} {p}{{K^-}} $ is estimated from a fit to the$ {{{J/\psi}}} {p}{{K^-}} $ mass distribution with one kaon interpreted as a proton. This yield is then constrained to the resulting estimate of$ 399\pm26 $ ($ 1914\pm47 $ ) in the$ {{{J/\psi}}} {{K^+}} {{K^-}} $ mass fit for the Run 1 (Run 2). The$ m({{{J/\psi}}} {{K^+}} {{K^-}} ) $ distributions, superimposed by the fit results, are shown in Fig. 3. Table 1 lists the obtained yields of the$ {{B^0}} {\rightarrow} {{{J/\psi}}} {{K^+}} {{K^-}} $ and$ {B^0_s} {\rightarrow} {{{J/\psi}}} {{K^+}} {{K^-}} $ decays, the$ {\varLambda _b^0}$ background and the combinatorial background in the full range as well as in the$ \pm15 $ $ {\rm{MeV}}/c^2$ regions around the known$ {B^0_s}$ and$ {{B^0}}$ masses.
Figure 3. (color online) The distributions of
$m( J/ \psi K^+ K^- )$ , superimposed by the fit results, for (left) Run 1 and (right) Run 2 data samples. The top row shows the full$ B^0_s $ signals in logarithmic scale while the bottom row is presented in a reduced vertical range to make the B0 peaks visible. The violet (red) solid lines represent the$B^{0}_{(s)}\to J/ \psi K^+ K^- $ decays, the orange dotted lines show the$ \varLambda _b^0$ background and the green dotted lines show the combinatorial background.Data Category Full $ B^0_s$ region

$ B^0$ region

Run 1 $ B^0_s \to J/ \psi K^+ K^- $ 

55498 ± 238 51859 ± 220 35 ± 6 $ B^0 \to J/ \psi K^+ K^- $ 

127 ± 19 0 119 ± 18 $ \varLambda _b^0 \to J/ \psi{p} K^- $ 

407 ± 26 55 ± 8 61 ± 8 Combinatorial background 758 ± 55 85 ± 11 94 ± 11 Run 2 $ B^0_s \to J/ \psi K^+ K^- $ 

249670 ± 504 233663 ± 472 153 ± 12 $ B^0 \to J/ \psi K^+ K^- $ 

637 ± 39 0 596 ± 38 $ \varLambda _b^0 \to J/ \psi{p} K^- $ 

1943 ± 47 261 ± 16 290 ± 17 Combinatorial background 2677 ± 109 303 ± 20 331 ± 21 Table 1. Measured yields of all contributions from the fit to
$ J/ \psi K^+ K^- $ mass distribution, showing the results for the full mass range and for the$ B^0_s$ and$ B^0$ regions.Assuming the efficiency is independent of
$ m({{K^+}} {{K^-}} ) $ , the$ \phi $ meson lineshape from$ {{B^0}} {\rightarrow} {{{J/\psi}}} \phi $ ($ {B^0_s} {\rightarrow} {{{J/\psi}}} \phi $ ) decays in the$ {{B^0}}$ ($ {B^0_s}$ ) region is given by$ \begin{aligned}[b]{\rm{S}}_{\phi}(m) \equiv & P_{B}P_{R}F_{R}^{2}(P_{R},P_0,d)\left(\frac{P_{R}}{m^{\prime}}\right)^{2L_{R}} {\left|A_{\phi}(m^{\prime};m_0,\Gamma_0)\right|}^2\\ &\otimes{G(m-m^{\prime};0,\sigma)}, \end{aligned} $

(1) where
$ {A}_{\phi} $ is a relativistic Breit-Wigner amplitude function [27] defined as$ \begin{aligned}[b] {A_{\phi}}(m;m_0,\Gamma_0) =&\, \frac{1}{m_0^{2}-m^2-{\rm i}m_0\Gamma(m)}, \; \\ {\Gamma(m)} = &\, \Gamma_0\left(\frac{P_{R}}{P_0}\right)^{2L_{R}+1}\frac{m_0}{m}F_{R}^{2}(P_{R},P_0,d) \;. \end{aligned} $

(2) The parameter m (
$ m^{\prime} $ ) denotes the reconstructed (true)$ {{K^+}} {{K^-}} $ invariant mass,$ m_0 $ and$ \Gamma_0 $ are the mass and decay width of the$ \phi(1020) $ meson,$ P_{B} $ is the$ {{{J/\psi}}} $ momentum in the$ {B^0_s}$ ($ {{B^0}}$ ) rest frame,$ P_{R} $ ($ P_0 $ ) is the momentum of the kaons in the$ {{K^+}} {{K^-}} $ ($ \phi(1020) $ ) rest frame,$ L_{R} $ is the orbital angular momentum between the$ {{K^+}} $ and$ {{K^-}} $ ,$ F_{R} $ is the Blatt-Weisskopf function, and d is the size of the decaying particle, which is set to be 1.5$ ({\rm{GeV/c}})^{-1}\sim $ 0.3 fm [28]. The amplitude squared is folded with a Gaussian resolution function G. For$ L_{R} = 1 $ ,$ F_R $ has the form$ F_{R}(P_{R},P_0,d) = \sqrt{\frac{1+(P_{0}\,d)^2}{1+(P_{R\,}d)^2}}\;, $

(3) and depends on the momentum of the decay products
$ P_{R} $ [27].As is shown in Fig. 2, due to the correlation between the reconstructed masses of
$ {{K^+}} {{K^-}} $ and$ {{{J/\psi}}} {{K^+}} {{K^-}} $ , the shape of the$ m({{K^+}} {{K^-}} ) $ distribution strongly depends on the chosen$ m({{{J/\psi}}} {{K^+}} {{K^-}} ) $ range. The top two plots in Fig. 3 show the$ m({{{J/\psi}}} {{K^+}} {{K^-}} ) $ distributions for Run 1 and Run 2 separately, where a small$ {{B^0}}$ signal can be seen on the tail of a large$ {B^0_s}$ signal. Therefore, it is necessary to estimate the lineshape of the$ K^+K^- $ mass spectrum from$ {B^0_s} {\rightarrow} {{{J/\psi}}} \phi $ decays in the$ B^0 $ region. The$ m({{K^+}} {{K^-}} ) $ distribution of the$ {B^0_s} {\rightarrow} {{{J/\psi}}} \phi $ tail leaking into the$ {{B^0}}$ mass window can be effectively described by Eq. (1) with modified values of$ m_0 $ and$ \Gamma_0 $ , which are extracted from an unbinned maximum-likelihood fit to the$ {B^0_s} {\rightarrow} {{{J/\psi}}} \phi $ simulation sample.The non-
$ \phi $ $ {{K^+}} {{K^-}} $ contributions to$ {{B^0}} {\rightarrow} {{{J/\psi}}} {{K^+}} {{K^-}} $ ($ {B^0_s} {\rightarrow} {{{J/\psi}}} {{K^+}} {{K^-}} $ ) decays include that from$ a_0 $ (980) [1] ($ f_0 $ (980) [29]) and nonresonant$ {{K^+}} {{K^-}} $ in an S-wave configuration. The PDF for this contribution is given by$ {\rm{S}}_{\rm non}(m) \equiv P_{B}P_{R}{F_B}^2\left(\frac{P_B}{m_B}\right)^{2} {\left|A_{R}(m)\times{{\rm e}^{{\rm i}\delta}}+A_{NR}\right|}^2\;, $

(4) where m is the
$ {{K^+}} {{K^-}} $ invariant mass,$ m_B $ is the known$ B^{0}_{(s)} $ mass [21],$ F_B $ is the Blatt-Weisskopf barrier factor of the$ B^{0}_{(s)} $ meson,$ A_{R} $ and$ A_{NR} $ represent the resonant ($ a_0 $ (980) or$ f_0 $ (980)) and nonresonant amplitudes, and$ \delta $ is a relative phase between them. The nonresonant amplitude$ A_{NR} $ is modelled as a constant function. The lineshape of the$ a_0 $ (980) ($ f_0 $ (980)) resonance can be described by a Flatté function [30] considering the coupled channels$ \eta{{{\pi}^0}} $ ($ \pi\pi $ ) and$ K {K} $ . The Flatté functions are given by$ A_{a_0}(m) = \dfrac{1}{m_{R}^{2}-m^2-{\rm i}(g_{\eta\pi}^2\rho_{\eta\pi}+g_{KK}^2\rho_{KK})} $

(5) for the
$ a_0 $ (980) resonance and$ A_{f_0}(m) = \dfrac{1}{m_{R}^{2}-m^2-{\rm i}m_{R}(g_{\pi\pi}\rho_{\pi\pi}+g_{KK}\rho_{KK})} $

(6) for the
$ f_0 $ (980) resonance. The parameter$ m_{R} $ denotes the pole mass of the resonance for both cases. The constants$ g_{\eta\pi} $ ($ g_{\pi\pi} $ ) and$ g_{KK} $ are the coupling strengths of$ a_0 $ (980) ($ f_0 $ (980)) to the$ \eta{{{\pi}^0}} $ ($ \pi\pi $ ) and$ K {K} $ final states, respectively. The$ \rho $ factors are given by the Lorentz-invariant phase space:$ \rho_{\pi\pi} = \frac{2}{3}\sqrt{1-\frac{4m_{{{{\pi}^\pm}} }^2}{m^2}}+\frac{1}{3}\sqrt{1-\frac{4m_{{{{\pi}^0}} }^2}{m^2}}\;, $

(7) $ \rho_{KK} = \frac{1}{2}\sqrt{1-\frac{4m_{{{{K}^\pm}} }^2}{m^2}}+\frac{1}{2}\sqrt{1-\frac{4m_{{{{K}^0}} }^2}{m^2}}\;, $

(8) $ \rho_{\eta\pi} = \sqrt{\left(1-\frac{(m_{\eta}-m_{{{{\pi}^0}} })^2}{m^2}\right)\left(1-\frac{(m_{\eta}+m_{{{{\pi}^0}} })^2}{m^2}\right)}\;. $

(9) The parameters for the
$ a_0 $ (980) lineshape are$ m_{R} = 0.999\pm0.002 \;\; {\rm{GeV}}/c^2$ ,$ g_{\eta\pi} = 0.324\pm0.015\;\;{{{\rm{GeV}}}/c^2} $ , and$ g_{KK}^2/g_{\eta\pi}^2 = 1.03\pm0.14 $ , determined by the Crystal Barrel experiment [31]; the parameters for the$ f_0 $ (980) lineshape are$ m_{R} = 0.9399\pm0.0063\; {\rm{GeV}}/c^2$ ,$ g_{\pi\pi} = 0.199\pm 0.030\; {\rm{GeV}}/c^2$ , and$ g_{KK}/g_{\pi\pi} = 3.0\pm0.3 $ , according to the previous analysis of$ {B^0_s} {\rightarrow} {{{J/\psi}}} {{{\pi}^+}} {{{\pi^-}}} $ decays [32].For the
$ {\varLambda _b^0} {\rightarrow} {{{J/\psi}}} {p}{{K^-}} $ background, no dependency of the$ m({{K^+}} {{K^-}} ) $ shape on$ m({{{J/\psi}}} {{K^+}} {{K^-}} ) $ is observed in simulation. Therefore, a common PDF is used to describe the$ m({{K^+}} {{K^-}} ) $ distributions in both the$ {B^0_s}$ and$ {{B^0}}$ regions. The PDF is modelled by a third-order Chebyshev polynomial function, obtained from the unbinned maximum-likelihood fit to the simulation shown in Fig. 4.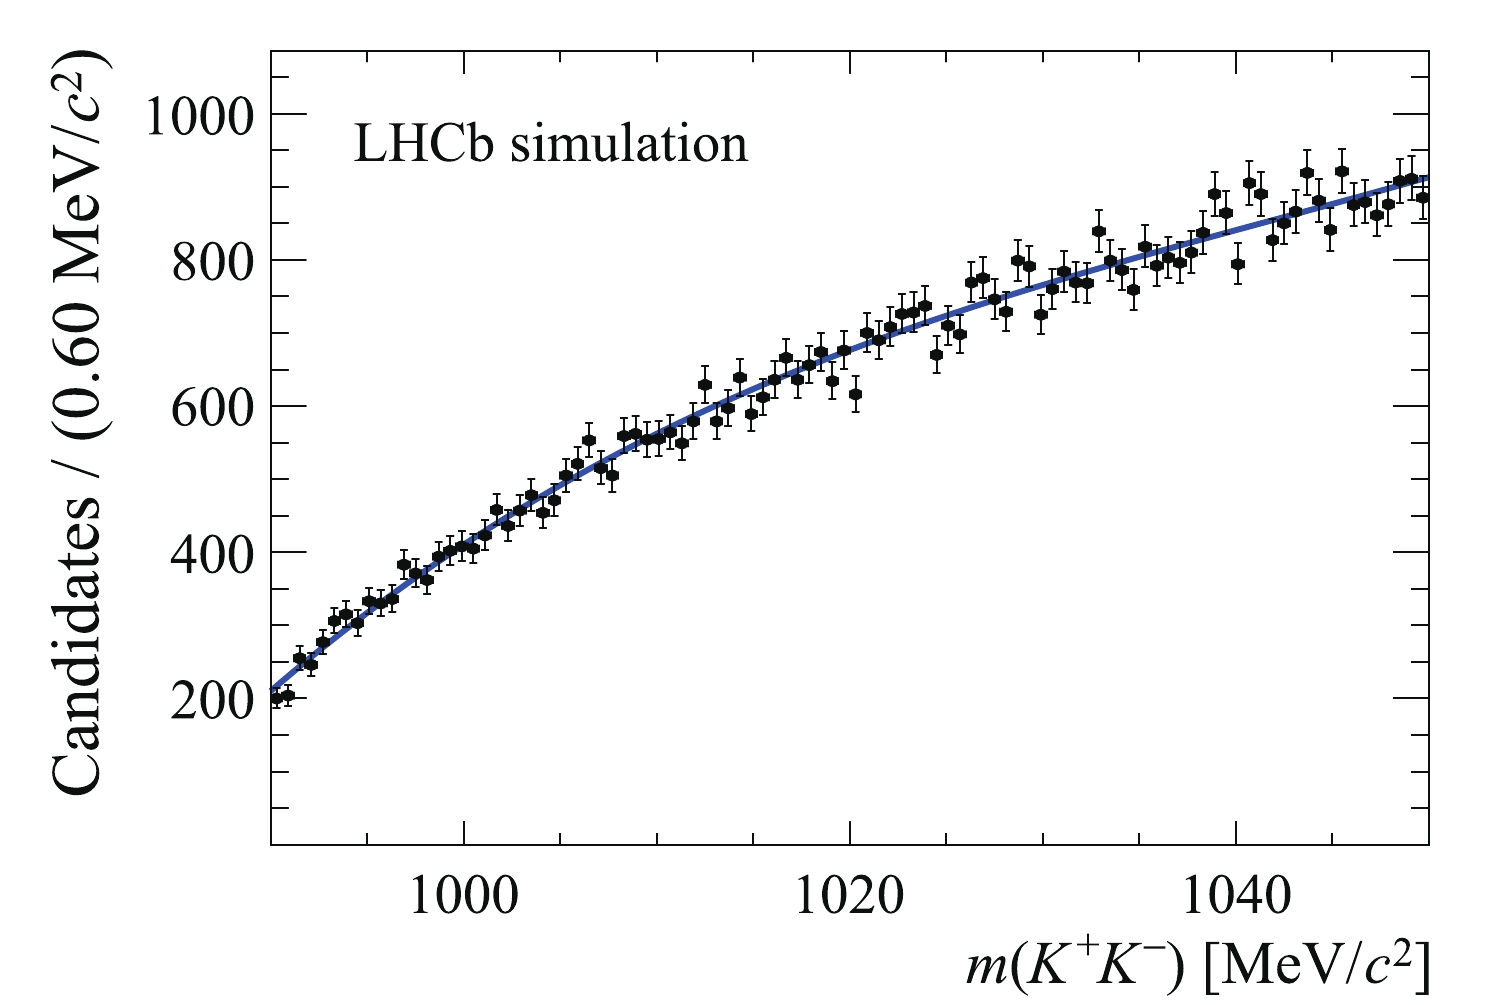
Figure 4. Distribution of
$m( K^+ K^- )$ in a$ \varLambda _b^0 \to J/ \psi{p} K^- $ simulation sample superimposed with a fit to a polynomial function.In order to study the
$ m({{K^+}} {{K^-}} ) $ shape of the combinatorial background in the$ {{B^0}}$ region, a BDT requirement that strongly favours background is applied to form a background-dominated sample. Simulated$ {\varLambda _b^0} {\rightarrow} {{{J/\psi}}} {p}{{K^-}} $ and$ {B^0_s} {\rightarrow} {{{J/\psi}}} \phi $ events are then injected into this sample with negative weights to subtract these contributions. The resulting$ m({{K^+}} {{K^-}} ) $ distribution is shown in Fig. 5, which comprises a$ \phi $ resonance contribution and random$ {{K^+}} {{K^-}} $ combinations, where the shape of the former is described by Eq. (1) and the latter by a second-order Chebyshev polynomial function. To validate the underlying assumptions of this procedure, the$ m({{K^+}} {{K^-}} ) $ shape has been checked to be compatible in different$ {{{J/\psi}}} {{K^+}} {{K^-}} $ mass regions and with different BDT requirements.
Figure 5. (color online)
$m( K^+ K^- )$ distributions of the enhanced combinatorial background in the (left) Run 1 and (right) Run 2 data samples. The$ B^0_s \to J/ \psi\phi$ and$ \varLambda _b^0 \to J/ \psi{p} K^- $ backgrounds are subtracted by injecting simulated events with negative weights.A simultaneous unbinned maximum-likelihood fit to the four
$ m({{K^+}} {{K^-}} ) $ distributions in both$ {B^0_s}$ and$ {{B^0}}$ regions of Run 1 and Run 2 data samples is performed. The$ \phi $ resonance in$ B^0_{(s)}{\rightarrow} {{{J/\psi}}} \phi $ decays is modelled by Eq. (1). The non-$ \phi $ $ {{K^+}} {{K^-}} $ contribution to$ B^0_{(s)}{\rightarrow} {{{J/\psi}}} {{K^+}} {{K^-}} $ decays is described by Eq. (4). The tail of$ {B^0_s} {\rightarrow} {{{J/\psi}}} \phi $ decays in the$ {{B^0}}$ region is described by the extracted shape from simulation. The$ {\varLambda _b^0} $ background and the combinatorial background are described by the shapes shown in Figs. 4 and 5, respectively. All$ m({{K^+}} {{K^-}} ) $ shapes are common to the$ {{B^0}}$ and$ {B^0_s}$ regions, except that of the$ {B^0_s}$ tail, which is only needed for the$ {{B^0}}$ region. The mass and decay width of$ \phi(1020) $ meson are constrained to their PDG values [21] while the width of the$ m({{K^+}} {{K^-}} ) $ resolution function is allowed to vary in the fit. The pole mass of$ f_0 $ (980) ($ a_0 $ (980)) and the coupling factors, including$ g_{\pi\pi} $ ,$ g_{KK}/g_{\pi\pi} $ ,$ g_{\eta\pi}^2 $ and$ g_{KK}^2/g_{\eta\pi}^2 $ , are fixed to their central values in the reference fit. The amplitude$ A_{NR} $ is allowed to vary freely, while the relative phase$ \delta $ between the$ f_0 $ (980) ($ a_0 $ (980)) and nonresonance amplitudes is constrained to$ -255\pm35 $ ($ -60\pm26 $ ) degrees, which was determined in the amplitude analysis of$ {B^0_s} {\rightarrow} {{{J/\psi}}} {{K^+}} {{K^-}} $ ($ {{B^0}} {\rightarrow} {{{J/\psi}}} {{K^+}} {{K^-}} $ ) decays [1, 29]. The yields of the$ {\varLambda _b^0}$ background, the$ {B^0_s} {\rightarrow} {{{J/\psi}}} \phi $ tail leaking into the$ {{B^0}}$ region and the combinatorial background are fixed to the corresponding values in Table 1, while the yields of non-$ \phi $ $ {{K^+}} {{K^-}} $ for$ {B^0_s}$ and$ {{B^0}}$ decays as well as the yield of$ {B^0_s} {\rightarrow} {{{J/\psi}}} \phi $ decays take different values for Run 1 and Run 2 data samples and are left to vary in the fit.The branching fraction
$ {\cal{B}}({{B^0}} {\rightarrow} {{{J/\psi}}} \phi) $ , the parameter of interest to be determined by the fit, is common for Run 1 and Run 2. The yield of$ {{B^0}} {\rightarrow} {{{J/\psi}}} \phi $ decays is internally expressed according to$ N_{{{B^0}} {\rightarrow} {{{J/\psi}}} \phi} = N_{{B^0_s} {\rightarrow} {{{J/\psi}}} \phi}\times\frac{{\cal{B}}({{B^0}} {\rightarrow} {{{J/\psi}}} \phi)}{{\cal{B}}({B^0_s} {\rightarrow} {{{J/\psi}}} \phi)} \times\frac{\varepsilon_{{{B^0}} }}{\varepsilon_{{B^0_s} }}\times\frac{1}{f_s/f_d} \;, $

(10) where the branching fraction
$ {\cal{B}}({B^0_s} {\rightarrow} {{{J/\psi}}} \phi) $ has been measured by the LHCb collaboration [29],$ {\varepsilon_{{{B^0}} }}/{\varepsilon_{{B^0_s} }} $ is the efficiency ratio given in Sec. III,$ f_s/f_d $ is the ratio of the production fractions of$ B_s^0 $ and$ B^0 $ mesons in$ pp$ collisions, which has been measured at 7$ {\rm{TeV}}$ to be$ 0.256\pm0.020 $ in the LHCb detector acceptance [33]. The effect of increasing collision energy on$ f_s/f_d $ is found to be negligible for 8$ {\rm{TeV}}$ and a scaling factor of$ 1.068\pm0.046 $ is needed for 13$ {\rm{TeV}}$ [34]. The parameters$ {\cal{B}}({B^0_s} {\rightarrow} {{{J/\psi}}} \phi) $ ,$ {\varepsilon_{{{B^0}} }}/{\varepsilon_{{B^0_s} }} $ and$ f_s/f_d $ are fixed to their central values in the baseline fit and their uncertainties are propagated to$ {\cal{B}}({{B^0}} {\rightarrow} {{{J/\psi}}} \phi) $ in the evaluation of systematic uncertainties.The
$ m({{K^+}} {{K^-}} ) $ distributions in the$ {B^0_s}$ and$ {{B^0}}$ regions are shown in Fig. 6 for both Run 1 and Run 2 data samples. The branching fraction$ {\cal{B}}({{B^0}} {\rightarrow} {{{J/\psi}}} \phi) $ is found to be$ (6.8 \pm 3.0({\rm{stat.}}))\times10^{-8} $ . The significance of the decay$ {{B^0}} {\rightarrow} {{{J/\psi}}} \phi $ , over the background-only hypothesis, is estimated to be 2.3 standard deviations using Wilks' theorem [35].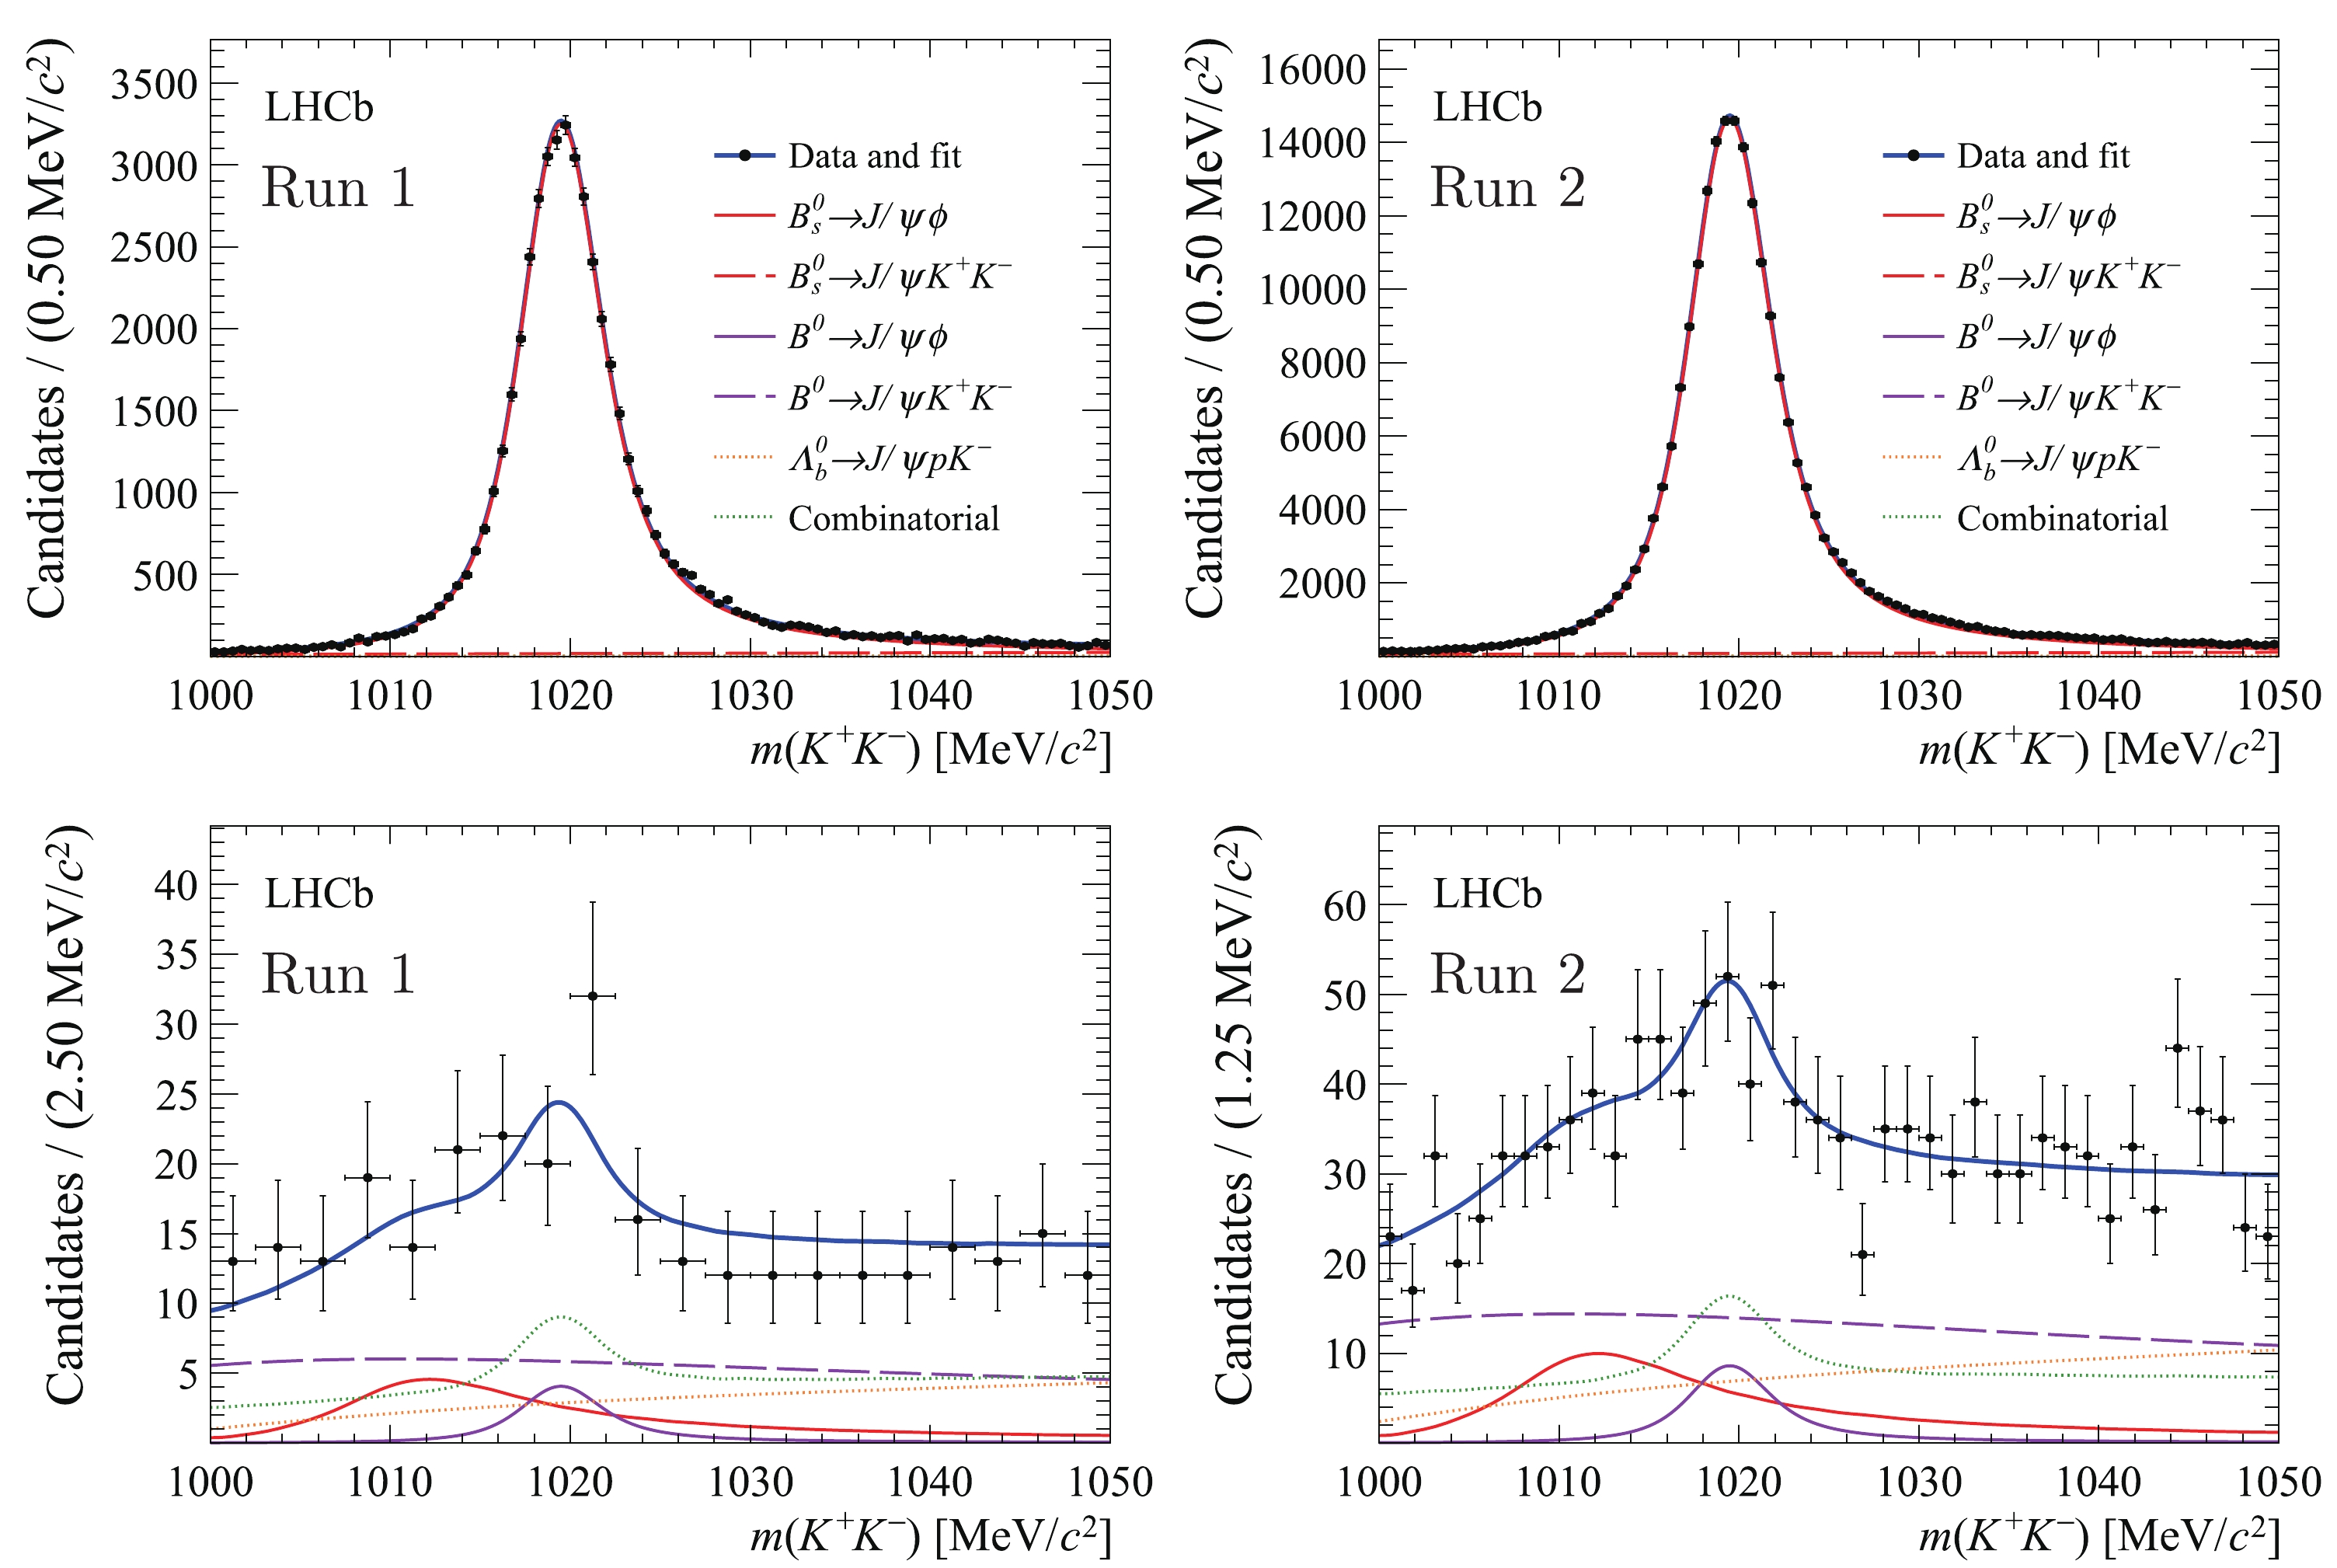
Figure 6. (color online) Distributions in the (top)
$ B^0_s$ and (bottom)$ B^{0}$ $m( K^+ K^- )$ regions, superimposed by the fit results. The left and right columns show the results for the Run 1 and Run 2 data samples, respectively. The violet (red) solid lines are$B^{0}_{(s)}\to J/ \psi\phi$ decays, violet (red) dashed lines are non-$\phi$ $B^{0}_{(s)}\to J/ \psi K^+ K^- $ signal, green dotted lines are the combinatorial background component, and the orange dotted lines are the$ \varLambda _b^0$ background component.To validate the sequential fit procedure, a large number of pseudosamples were generated according to the fit models for the
$ m(J/\psi{{K^+}} {{K^-}} ) $ and$ m({{K^+}} {{K^-}} ) $ distributions. The model parameters were taken from the result of the baseline fit to the data. The fit procedure described above was applied to each pseudosample. The distributions of the obtained estimate of$ {\cal{B}}({{B^0}} {\rightarrow} {{{J/\psi}}} \phi) $ and the corresponding pulls are found to be consistent with the reference result, which indicates that the procedure has negligible bias and its uncertainty estimate is reliable. A similar check has been performed using pseudosamples generated with an alternative model for the$ {{B^0}} {\rightarrow} {{{J/\psi}}} {{K^+}} {{K^-}} $ decays, which is based on the amplitude model developed for the$ {B^0_s} {\rightarrow} {{{J/\psi}}} {{K^+}} {{K^-}} $ analysis [20] and includes contributions from P-wave$ {{B^0}} {\rightarrow} {{{J/\psi}}} \phi $ decays, S-wave$ {{B^0}} {\rightarrow} {{{J/\psi}}} {{K^+}} {{K^-}} $ decays and their interference. In this case, the robustness of the fit method has also been confirmed. -
Two categories of systematic uncertainties are considered: multiplicative uncertainties, which are associated with the normalisation factors; and additive uncertainties, which affect the determination of the yields of the
$ {{B^0}} {\rightarrow} {{{J/\psi}}} \phi $ and$ {B^0_s} {\rightarrow} {{{J/\psi}}} \phi $ modes.The multiplicative uncertainties include those propagated from the estimates of
$ {\cal{B}}({B^0_s} {\rightarrow} {{{J/\psi}}} \phi) $ ,$ f_s/f_d $ and$ {\varepsilon_{{B^0_s} }}/{\varepsilon_{{{B^0}} }} $ . Using the$ f_s/f_d $ measurement at 7$ {\rm{TeV}}$ [29, 33],$ {\cal{B}}({B^0_s} {\rightarrow} {{{J/\psi}}} \phi) $ was measured to be$(10.50\pm0.13\,({\rm{stat.}}) \pm 0.64\,({\rm{syst.}})\pm0.82\,({ {f_s}}/{ {f_d}}))\times10^{-4}$ . The third uncertainty is completely anti-correlated with the uncertainty on$ f_s/f_d $ , since the estimate of$ {\cal{B}}({B^0_s} {\rightarrow} {{{J/\psi}}} \phi) $ is inversely proportional to the value used for$ f_s/f_d $ . Taking this correlation into account yields$ {\cal{B}}({B^0_s} {\rightarrow} {{{J/\psi}}} \phi)\times f_s/f_d = (2.69 \pm 0.17) \times 10^{-4} $ for 7$ {\rm{TeV}}$ . The luminosity-weighted average of the scaling factor for$ f_s/f_d $ for 13$ {\rm{TeV}}$ has a relative uncertainty of 3.4%. For the efficiency ratio$ {\varepsilon_{{B^0_s} }}/{\varepsilon_{{{B^0}} }} $ , its luminosity-weighted average has a relative uncertainty of 1.8%. Summing these three contributions in quadrature gives a total relative uncertainty of 7.3% on$ {\cal{B}}({{B^0}} {\rightarrow} {{{J/\psi}}} \phi) $ .The additive uncertainties are due to imperfect modeling of the
$ m({{{J/\psi}}} {{K^+}} {{K^-}} ) $ and$ m({{K^+}} {{K^-}} ) $ shapes of the signal and background components. To evaluate the systematic effect associated with the$ m({{{J/\psi}}} {{K^+}} {{K^-}} ) $ model of the combinatorial background, the fit procedure is repeated by replacing the exponential function for the combinatorial background with a second-order polynomial function. A large number of simulated pseudosamples were generated according to the obtained alternative model. Each pseudosample was fitted twice, using the baseline and alternative combinatorial shape, respectively. The average difference of$ {\cal{B}}({{B^0}} {\rightarrow} {{{J/\psi}}} \phi) $ is$ 0.03\times10^{-8} $ , which is taken as a systematic uncertainty.In the
$ m({{K^+}} {{K^-}} ) $ fit, the yields of$ {\varLambda _b^0} {\rightarrow} {{{J/\psi}}} {p}{{K^-}} $ decay, combinatorial backgrounds under the$ {{B^0}}$ and$ {B^0_s}$ peaks, and that of the$ {B^0_s}$ tail leaking into the$ {{B^0}}$ region are fixed to the values in Table 1. Varying these yields separately leads to a change of$ {\cal{B}}({{B^0}} {\rightarrow} {{{J/\psi}}} \phi) $ by$ 0.05\times 10^{-8} $ for$ {\varLambda _b^0} {\rightarrow} {{{J/\psi}}} {p}{{K^-}} $ ,$ 0.61\times 10^{-8} $ for the combinatorial background and$ 0.24\times 10^{-8} $ for the$ {B^0_s}$ tail in the$ {{B^0}}$ region, and these are assigned as systematic uncertainties on$ {\cal{B}}({{B^0}} {\rightarrow} {{{J/\psi}}} \phi) $ .The constant d in Eq. (3) is varied between 1.0 and 3.0
$ ({\rm{GeV/c}})^{-1} $ . The maximum change of$ {\cal{B}}({{B^0}} {\rightarrow} {{{J/\psi}}} \phi) $ is evaluated to be$ 0.01\times10^{-8} $ , which is taken as a systematic uncertainty.The
$ m({{K^+}} {{K^-}} ) $ shape of the$ {B^0_s}$ tail under the$ {{B^0}}$ peak is extracted using a$ {B^0_s} {\rightarrow} {{{J/\psi}}} \phi $ simulation sample. The statistical uncertainty due to the limited size of this sample is estimated using the bootstrapping technique [36]. A large number of new data sets of the same size as the original simulation sample were formed by randomly cloning events from the original sample, allowing one event to be cloned more than once. The spread in the results of$ {\cal{B}}({{B^0}} {\rightarrow} {{{J/\psi}}} \phi) $ obtained by using these pseudosamples in the analysis procedure is then adopted as a systematic uncertainty, which is evaluated to be$ 0.29\times 10^{-8} $ .In the reference model, the
$ m({{K^+}} {{K^-}} ) $ shape of the$ {\varLambda _b^0} {\rightarrow} {{{J/\psi}}} {p}{{K^-}} $ background is determined from simulation, under the assumption that this shape is insensitive to the$ m({{{J/\psi}}} {{K^+}} {{K^-}} ) $ region. A sideband sample enriched with$ {\varLambda _b^0} {\rightarrow} {{{J/\psi}}} {p}{{K^-}} $ contributions is selected by requiring one kaon to have a large probability to be a proton. An alternative$ m({{K^+}} {{K^-}} ) $ shape is extracted from this sample after subtracting the random combinations, and used in the$ m({{K^+}} {{K^-}} ) $ fit. The resulting change of$ {\cal{B}}({{B^0}} {\rightarrow} {{{J/\psi}}} \phi) $ is$ 0.28\times 10^{-8} $ , which is assigned as a systematic uncertainty.The
$ m({{K^+}} {{K^-}} ) $ shape of the combinatorial background is represented by that of the$ {{{J/\psi}}} {{K^+}} {{K^-}} $ combinations with a BDT selection that strongly favours the background over the signal, under the assumption that this shape is insensitive to the BDT requirement. Repeating the$ m({{K^+}} {{K^-}} ) $ fit by using the combinatorial background shape obtained with two non-overlapping sub-intervals of BDT response, the result for$ {\cal{B}}({{B^0}} {\rightarrow} {{{J/\psi}}} \phi) $ is found to be stable, with a maximum variation of$ 0.16\times 10^{-8} $ , which is regarded as a systematic uncertainty.In Eqs. (7)–(9), the coupling factors
$ g_{\eta\pi} $ ,$ g_{KK}^2/g_{\eta\pi}^2 $ ,$ g_{\pi\pi} $ and$ g_{KK}/g_{\pi\pi} $ , are fixed to their mean values from Ref. [31, 32]. The fit is repeated by varying each factor by its experimental uncertainty and the maximum variation of the branching fraction is considered for each parameter. The sum of the variations in quadrature is$ 0.06\times 10^{-8} $ , which is assigned as a systematic uncertainty.The systematic uncertainties are summarised in Table 2. The total systematic uncertainty is the sum in quadrature of all these contributions.
Multiplicative uncertainties Value (%) ${\cal{B}}( B^0_s \to J/ \psi\phi)$ 

6.2 Scaling factor for $f_{s}/f_{d}$ 

3.4 ${\varepsilon_{ B^0 }}/{\varepsilon_{ B^0_s }}$ 

1.8 Total 7.3 Additive uncertainties Value (10−8) $m( J/ \psi K^+ K^- )$ model of combinatorial background

0.03 Fixed yields of $ \varLambda _b^0 $ in

$m( K^+ K^- )$ fit

0.05 Fixed yields of combinatorial background in $m( K^+ K^- )$ fit

0.61 Fixed yields of $ B^0_s $ contribution in

$m( K^+ K^- )$ fit

0.24 Constant d 0.01 $m( K^+ K^- )$ shape of

$ B^0_s $ contribution

0.29 $m( K^+ K^- )$ shape of

$ \varLambda _b^0 $ 

0.28 $m( K^+ K^- )$ shape of combinatorial background

0.16 $m( K^+ K^- )$ shape of non-

$\phi$ 

0.06 Total 0.80 Table 2. Systematic uncertainties on
${\cal{B}}( B^0 \to J/ \psi\phi)$ for multiplicative and additive sources.A profile likelihood method is used to compute the upper limit of
$ {\cal{B}}({{B^0}} {\rightarrow} {{{J/\psi}}} \phi) $ [37, 38]. The profile likelihood ratio as a function of$ {\cal{B}} \equiv {\cal{B}}({{B^0}} {\rightarrow} {{{J/\psi}}} \phi) $ is defined as$ \lambda_0({\cal{B}}) \equiv \frac{L({\cal{B}},\widehat{\widehat{\nu}})}{L(\widehat{{\cal{B}}},\widehat{\nu})}\;, $

(11) where
$ \nu $ represents the set of fit parameters other than$ {\cal{B}} $ ,$ \widehat{{\cal{B}}} $ and$ \widehat{\nu} $ are the maximum likelihood estimators, and$ \widehat{\widehat{\nu}} $ is the profiled value of the parameter$ \nu $ that maximises L for the specified$ {\cal{B}} $ . Systematic uncertainties are incorporated by smearing the profile likelihood ratio function with a Gaussian function which has a zero mean and a width equal to the total systematic uncertainty:$ \lambda({\cal{B}}) = \int_{-\infty}^{+\infty}{\lambda_0}({\cal{B}}'){\times} G({\cal{B}}-{\cal{B}}',0,{\sigma_{\rm{sys}}}({\cal{B}}')){\rm d} {\cal{B}}' \;. $

(12) The smeared profile likelihood ratio curve is shown in Fig. 7. The 90% confidence interval starting at
$ {\cal{B}} = 0 $ is shown as the red area, which covers 90% of the integral of the$ \lambda({\cal{B}}) $ function in the physical region. The obtained upper limit on$ {\cal{B}}({{B^0}} {\rightarrow} {{{J/\psi}}} \phi) $ at 90% CL is$ 1.1\times10^{-7} $ .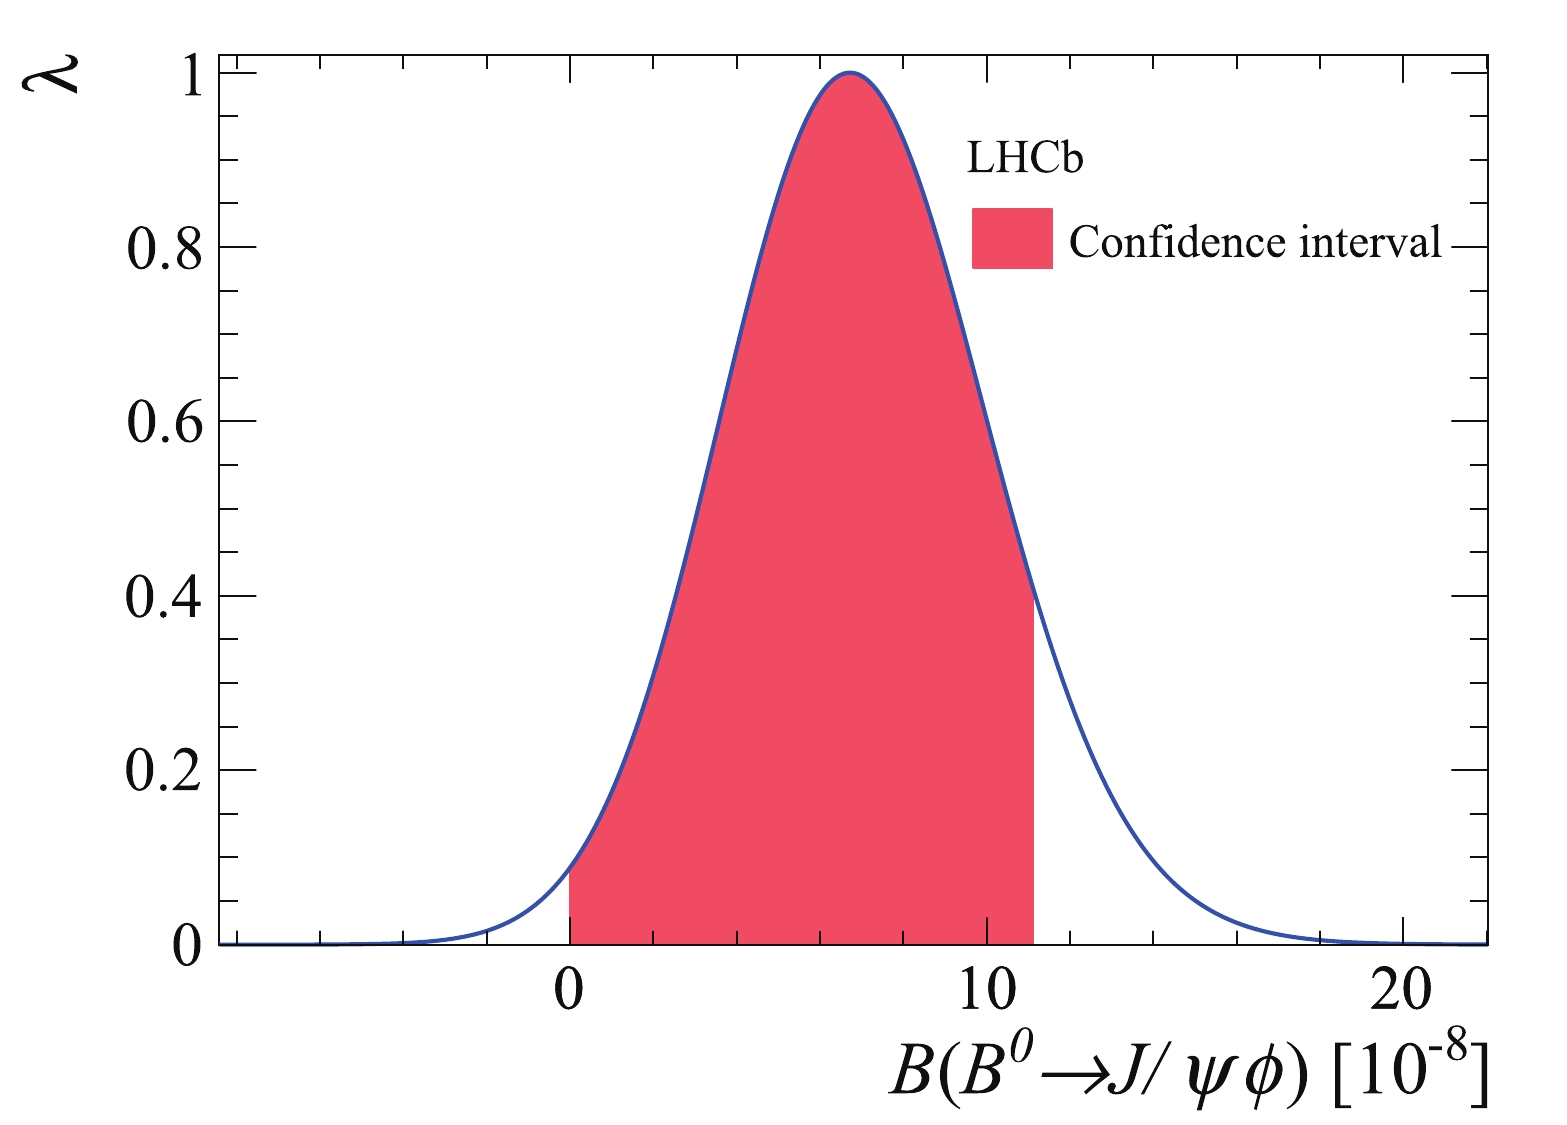
Figure 7. (color online) Smeared profile likelihood ratio curve shown as the blue solid line, and the 90% confidence interval indicated by the red area.
-
A search for the rare decay
$ {{B^0}} {\rightarrow} {{{J/\psi}}} \phi $ has been performed using the full Run 1 and Run 2 data samples of$ pp$ collisions collected with the LHCb experiment, corresponding to an integrated luminosity of 9$ {{\rm{fb}}^{-1}} $ . A br-anching fraction of$ {\cal{B}}({{B^0}} {\rightarrow} {{{J/\psi}}} \phi) = (6.8\pm3.0\pm0.9)\times 10^{-8} $ is measured, which indicates no statistically significant excess of the decay$ {{B^0}} {\rightarrow} {{{J/\psi}}} \phi $ above the background-only hypothesis. The upper limit on its branching fraction at 90% CL is determined to be$ 1.1\times10^{-7} $ , which is compatible with theoretical expectations and improved compared with the previous limit of$ 1.9\times10^{-7} $ obtained by the LHCb experiment using Run 1 data, with a corresponding integrated luminosity of 1$ {{\rm{fb}}^{-1}} $ . -
We express our gratitude to our colleagues in the CERN accelerator departments for the excellent performance of the LHC. We thank the technical and administrative staff at the LHCb institutes. We acknowledge support from CERN and from the national agencies: CAPES, CNPq, FAPERJ and FINEP (Brazil); MOST and NSFC (China); CNRS/IN2P3 (France); BMBF, DFG and MPG (Germany); INFN (Italy); NWO (Netherlands); MNiSW and NCN (Poland); MEN/IFA (Romania); MSHE (Russia); MICINN (Spain); SNSF and SER (Switzerland); NASU (Ukraine); STFC (United Kingdom); DOE NP and NSF (USA). We acknowledge the computing resources that are provided by CERN, IN2P3 (France), KIT and DESY (Germany), INFN (Italy), SURF (Netherlands), PIC (Spain), GridPP (United Kingdom), RRCKI and Yandex LLC (Russia), CSCS (Switzerland), IFINHH (Romania), CBPF (Brazil), PL-GRID (Poland) and OSC (USA). We are indebted to the communities behind the multiple open-source software packages on which we depend.
Search for the rare decay B0 → J/ψϕ
- Received Date: 2020-11-16
- Available Online: 2021-04-15
Abstract: A search for the rare decay


 DownLoad: