-
Nuclei comprising large neutron-proton asymmetry that reside far from the β-stability line (exotic nuclei) are of great importance for understanding modern nuclear structure. There are three main reasons that highlight the importance of exotic nuclei in the study of nuclear physics: First, to extend the data of nuclear structure as a function of N and Z in a well-ordered manner [1]. Second, the nuclear structure phenomena such as the evolution of new shell closure and decay mode occurring far away from the β-stability line are considerably different from those found on and near the β-stability line [2, 3]. Third, they are crucial to the evolutionary study of the universe [4]. The development of radioactive ion beam (RIB) facilities has created new avenues in the study of various nuclear phenomena, namely the island of inversion, proton radioactivity, bubble structure, Efimov effect, exotic shapes, and giant halo around drip-line nuclei [3, 5–12]. Moving across the valley of stability toward the neutron drip-line, there appears to be an increase in the number of neutron-neutron pairs compared with neutron-proton pairs, resulting in a large quantity of repulsive energy, which causes nuclear instability according to Pauli's principle. In this region, the shell effect overcomes the instability, leading to a shift in the drip-line further away and broadening of the peninsula of stability [13].
In recent decades, substantial studies have been performed to establish the shell evolution of the neutron numbers N = 32 and 34 along with the proton-magic chain of calcium (Z = 20), providing the newly emerged closed-shell phenomenon in this region. The basic mechanics corresponding to the appearance of the N = 32 and N = 34 gaps for Ca are discussed in Ref. [14]. It highlights the prediction of magicity based on the strong attractive coupling between the
$ \ell+1 / 2 $ and$ \ell-1 / 2 $ orbits. In the N = 32 and N = 34 sub-shells, the$ p_{3/2}-p_{1/2} $ and$ f_{7/2}-f_{5/2} $ spin-orbit interactions of protons ( π ) and neutrons ( ν ) are used for the determination of structure [15]. Local maxima of the first$ 2^{+} $ excitation energies$ [E (2_{1}^{+})] $ were reported for the case of the even-even nuclei with N = 32 isotopes of Ar (Z = 18) [16], Ca (Z = 20) [17], Sc (Z = 21) [18], Ti (Z = 22) [19–21], and Cr (Z = 24) [22], suggesting neutron shell closure at N = 32. Also, the local minima of reduced transition probabilities B(E2;$ 0^{+}\rightarrow 2_{1}^{+} $ ) have inferred the existence of this sub-shell in Ti [23] and Cr [24] isotopes. A similar degree of the doubly magic nature of$ ^{54} $ Ca [25] offers direct experimental evidence for the beginning of a substantial sub-shell closure isotope at N = 34.Furthermore, in Ref. [26], it is found that the relativistic Lagrangian with the DD-ME2 [27], PC-PK1 [28] and PK series [29], and PKOi (i=1, 2, 3) [30, 31] parametrizations provides a diluted picture for predicting the magicity in N = 32 and 34 Ca isotopes, whereas the relativistic Hartree-Fock (RHF) Lagrangian PKA1 [32], which comprises the degree of freedom of the ρ-tensor, systematically improves the nuclear structure properties [33–35]. The strong coupling between s
$ _{1/2} $ for both protons and neutrons with dissimilar principle numbers and neutron (ν) ν2p$ _{1/2} $ orbits, known as Dirac inversion partners, plays a significant role in the opening of the N = 32 and 34 subshells [36]. Parallel experimental advancements across the world, such as Jyaväskylä (Finland) [37], GSI and FAIR (Germany) [38, 39], FRIB and ORNL (US) [40, 41], RIKEN (Japan) [42], GANIL (France) [43], FLNR (Russia) [44], and CSR (China) [45], create new avenues for exploring the properties of exotic nuclei under the extreme conditions of isospin asymmetry. Here, we have chosen the isotopic chains of Sc- and Ti- nuclei because their atomic numbers are close to one of the doubly magic nuclei$ ^{40, 48} $ Ca (that is, Z = 20 and N = 20 and 28). Hence, the properties of the isotopic chains of these nuclei help us find neutron-to-proton asymmetry and its effect on the properties of nuclei lying closer to the β-stability line and drip-line nuclei.In principle, ground-state properties are related to nuclear bulk properties, such as the binding energy, two neutron separation energy, single-particle spectra, and shell correction energy, which predict traditional magic numbers and shell and/or sub-shell closure for the nuclei. However, moving away from the stability line toward and/or beyond the drip-line, where isospin asymmetry is dominant over traditional observables, makes it unfeasible to predict shell/sub-shell closure using the energy domain [13]. The diluted predictions of traditional observables allow us to consider the quantities dependent on the isospin asymmetry of the system. As shown in Ref. [14], the interplay between the tensor- and central-force monopoles contributes additively to the sharp increase in the
$ 1 f_{5 / 2} $ effective single-particle energies (ESPE) relative to the$ 2 p_{3 / 2} $ and$ 2 p_{1 / 2} $ orbits. This results in the appearance of the (sub-shell closure) magic gaps N = 32 and N = 34 following the shift in the$ 1 f_{5 / 2} $ orbit above$ 2 p_{1 / 2} $ . It is crucial to note that the appearance of the (sub)magic gap N = 32 is only present when$ 1 f_{5 / 2} $ lies between$ 2 p_{3 / 2} $ and$ 2 p_{1 / 2} $ , and for N = 34, this gap becomes larger as a consequence of tensor force. N = 34 vanishes when the effect of the tensor-force is not considered owing to the linear-dependence of proton holes in$ 1 f_{7 / 2} $ . To overcome this issue, the isospin asymmetry dependent observable, which is the symmetry energy of infinite nuclear matter, must be translated to a finite nuclear system. In other words, owing to the abnormally high or low value of isospin asymmetry in drip-line nuclei, observables dependent on isospin asymmetry become crucial in understanding the broadening of the peninsula of stability and successfully predicting the magicity and shell and/or sub-shell closure in finite nuclei.Net asymmetry in stable nuclei is given as
$ I=(N-Z)/(N+Z) $ of$ \sim $ 0.24, which in terms of their baryon density has the form$\alpha = ({\rho_n - \rho_p})/({\rho_n + \rho_p})$ . Here,$ \rho_n $ and$ \rho_p $ are the densities of neutrons and protons, respectively [46]. Density type isospin asymmetry is described by isovector-vector ρ-meson exchange, and mass type asymmetry is described by isovector-scalar δ-exchange [47, 48]. Nuclear symmetry energy is directly related to isospin asymmetry for both finite and infinite nuclear systems. It plays an important role in a variety of areas in nuclear physics, including the study of the ground-state structural properties of exotic nuclei [49–51], the physics of large collective excitation [52, 53], the reaction-dynamics of heavy-ions [54–56], dipole polarizability [57–60], mirror charge radii [61, 62], and the study of neutron stars [46, 63–65]. Nuclear symmetry energy can be defined as a measure of the energy gain in converting asymmetric nuclear matter into symmetric nuclear matter. Symmetry energy depends on the density distribution of the protons and neutrons inside the matter. The increased interest in the study of symmetry energy, coupled with its advantages in predicting the properties of finite and infinite nuclear matter, including nuclei near and beyond the drip-line, has led to new predictions and theoretical confirmation of shell and/or sub-shell closure for the isotopic and isotonic chains of nuclei lying across the nuclear landscape [12, 66, 67]. It has also been observed that the neutron star radius is correlated to the density term associated with symmetry energy at saturation. The neutron skin size is determined by the relative strength of the symmetry energy between the peripheral region (less dense) and central region (near saturation) [68–70]. Thus, the neutron-skin thickness is defined as a density dependence of symmetry energy around the central (saturation) region. Theoretically, the slope parameter (L-coefficient) is correlated with the neutron-skin thickness of 208Pb [68, 69, 71, 72] and neutron star radius [73].In the case of finite nuclei, a significant issue in constraining symmetry energy is a well-defined surface with non-uniformity in the matter density distribution of nucleons. The liquid-drop-model is one of the more straightforward methods of evaluating the coefficients of symmetry energy for finite nuclear systems, with the coefficient of surface symmetry energy being directly proportional to
$ A^{-1/3} $ , where A is the mass number of the nucleus [74]. The volume symmetry energy coefficient is nearly independent of the shape of the nucleus [74, 75]. The coherent density fluctuation model (CDFM) is another effective approach, where the surface properties of the nuclei are analyzed by folding the nuclear matter properties within the Brueckner energy density functional in terms of the weight function$ \vert {\cal{F}}(x) \vert^2 $ [66, 76–80]. Recently, for the isotopic chain of doubly close shell nuclei, Warda et al. theoretically demonstrated that the stiffness of the symmetry energy is due to the bulk and surface constituents of neutron-skin thickness [81, 82]. Additionally, Danielewicz revealed the correlation between surface and volume symmetry energy and their ratio with the neutron-skin thickness [83]. Furthermore, the temperature effect on the surface as well as bulk symmetry has been recently reported, which predicts that surface symmetry energy is more sensitive to temperature than its volume part [84, 85].In this paper, we estimate both the bulk nuclear properties, such as binding energy, binding energy per particle, charge radius, and deformation, and isospin-dependent properties, such as symmetry energy, surface symmetry energy, and volume symmetry energy, of odd-A Scandium (Z = 21) and even-even Titanium (Z = 22) isotopes within the relativistic mean-field (RMF) for non-linear NL3 [86] and relativistic-Hartree-Bogoliubov (RHB) with density-dependent meson-exchange DD-ME2 [27] parameter sets. The CDFM formalism is employed, which allows the transition from the properties of the nuclear matter lying in the momentum space to those of the corresponding finite nuclear matter lying in the coordinate space [66, 76–80]. This paper is organized as follows: In Sec. II, we present the theoretical formalism for the relativistic mean-field model followed by the CDFM. In Sec. III, we discuss our calculations and obtained results. Finally, a summary and conclusion are presented in Sec. IV.
-
In this study, we evaluate the nuclear symmetry energy
$ S(\rho) $ , surface symmetry energy$ S_ {\rm S} $ , and volume symmetry energy$ S_ {\rm V} $ of exotic finite nuclei as a function of baryon density. Nuclear symmetry energy is an essential quantity in finite nuclei and infinite nuclear matter owing to its isospin and density dependence behavior. The most general form of nuclear symmetry energy within the relativistic mean-field formalism can be expressed as$ S^{NM}(\rho)=\dfrac{1}{2}\dfrac{\partial^{2}({\cal{E}}/\rho)}{\partial\alpha^{2}}\bigg|_{\alpha=0}. $

(1) Here,
$ {\cal{E}} $ represents the energy density, and α is the neutron-proton asymmetry in terms of baryon density. Detailed expressions for the symmetry energy coefficient, namely the slope parameter$ L^{NM} $ , curvature$ K_{0}^{NM} $ , and skewness parameter$ Q_{0}^{NM} $ , can be found in Refs. [49, 71, 87] and the references therein. It is worth mentioning that this model has been widely applied to describe finite, infinite, and stellar nuclear matter with extreme isospin asymmetry [49, 71, 87].RMF theory is a microscopic method used to solve the many-body problem in nuclear physics. This theory is formulated within the framework of quantum hydrodynamics (QHD). RMF theory has several advantages over its non-relativistic counterpart. First, it naturally incorporates the spin-orbit force [88]. Second, it solves the shift in the saturation curve toward the empirical values (Coester band) [89]. Third, it provides a successful description of finite nuclei in the stable and drip line regions and super-heavy nuclei on the nuclear chart [90–92]. This model can predict the properties of nuclei, including the binding energy, root-mean-square (rms) radius, nuclear density distributions, deformation parameter, single-particle energies of the ground state, and their intrinsic excited states across the nuclear chart. In this study, we use the microscopic self-consistent RMF formalism to probe the nuclear structure. A characteristic relativistic Lagrangian density (generated after several changes to the original Walecka Lagrangian to account for its various limitations) for nucleon–meson many-body systems has the form (Refs. [66, 87, 93–95])
$\begin{aligned}[b] {\cal L}=&\overline{\psi}\{{\rm i}\gamma^{\mu}\partial_{\mu}-M\}\psi +{\frac12}\partial^{\mu}\sigma \partial_{\mu}\sigma \\ & -{\frac12}m_{\sigma}^{2}\sigma^{2}-{\frac13}g_{2}\sigma^{3} -{\frac14}g_{3}\sigma^{4} -g_{s}\overline{\psi}\psi\sigma \\ & -{\frac14}\Omega^{\mu\nu}\Omega_{\mu\nu}+{\frac12}m_{w}^{2}\omega^{\mu}\omega_{\mu} -g_{w}\overline\psi\gamma^{\mu}\psi\omega_{\mu} \\ &-{\frac14}\vec{B}^{\mu\nu}.\vec{B}_{\mu\nu}+\frac{1}{2}m_{\rho}^2 \vec{\rho}^{\mu}.\vec{\rho}_{\mu} -g_{\rho}\overline{\psi}\gamma^{\mu} \vec{\tau}\psi\cdot\vec{\rho}^{\mu} \\ &-{\frac14}F^{\mu\nu}F_{\mu\nu}-e\overline{\psi} \gamma^{\mu} \frac{\left(1-\tau_{3}\right)}{2}\psi A_{\mu}, \end{aligned}$

(2) with vector field tensors
$ F^{\mu\nu} = \partial_{\mu} A_{\nu} - \partial_{\nu} A_{\mu} \\ \Omega_{\mu\nu} = \partial_{\mu} \omega_{\nu} - \partial_{\nu} \omega_{\mu} \\ \vec{B}^{\mu\nu} = \partial_{\mu} \vec{\rho}_{\nu} - \partial_{\nu} \vec{\rho}_{\mu}. $

(3) Here, the fields for the σ-, ω-, and isovector ρ- mesons are denoted by σ,
$ \omega_{\mu} $ , and$ \vec{\rho}_{\mu} $ , respectively, the electromagnetic field is defined by$ A_{\mu} $ , and the quantities$ \Omega^{\mu\nu} $ ,$ \vec{B}_{\mu\nu} $ , and$ F^{\mu\nu} $ are the field tensors for the$ \omega^{\mu} $ ,$ \vec{\rho}_{\mu} $ , and photon fields, respectively.The RMF formalism permits the density dependence of the meson-nucleon coupling, which is parameterized in the phenomenological approach. More details can be found in Refs. [66, 87, 93–95]. From the above Lagrangian density, we obtain field equations for the nucleons and mesons by expanding the upper and lower components of the Dirac spinors and boson fields in an axially deformed harmonic oscillator basis for an initial deformation
$ \beta_{0} $ . The set of coupled equations is solved numerically using a self-consistent iteration method. The center-of-mass-energy correction is estimated using the formula$ E_{\rm c.m.} = \dfrac{3}{4}(41A^{-1/3}) $ MeV. The centre-of-mass-energy can be obtained from macroscopic and microscopic self-consistent methods [3, 27]. A recent study by Bhuyan [3] showed that the centre-of-mass-energies of both methods almost overlap; hence, the use of the macroscopic method is appropriate and does not affect the final predictions. The total binding energy and other observables are also obtained using the standard relations given in Ref. [96].To study open-shell nuclei, it is crucial to consider the pairing correlation in the ground and excited states. There are various methods, such as the BCS approach, Bogoliubov transformation, and particle number conserving methods, that have been developed to manage pairing correlation in finite nuclei [27, 66, 86, 94–97]. In the present study, two different types of prescriptions are used for pairing correlations: the BCS method with a constant gap for NL3 and the Bogoliubov transformation with DD-ME2 [27, 66, 86, 94–98]. The reason for considering two types of prescriptions is to investigate the effects of pairing as well as their model dependence on nuclear matter quantities at local density. For nuclei lying close to the β-stability line, the constant gap BCS pairing approach can be used to obtain a reasonably good pairing approximation [99], whereas, for nuclei lying in the exotic region, that is, close to the drip-line, a minimal effect is observed when employing the BCS approach. This paves the way for the Bogoliubov transformation, which is found to be a viable method for dealing with pairing correlation in exotic drip-line nuclei [95]. The relativistic-Hartree-Bogoliubov (RHB) energy density functional comprises the RMF functional and the pairing of the RHB model and pairing tensor [100]. In the RHB prescription, energy is expressed as
$ E_{\rm {pair }}[\hat{k}] =\frac{1}{4} \sum_{n_{1} n_{1} / n_{2} n_{2} \prime} \sum_{n_{1} n_{1}^{\prime}}^{*}<n_{1} n_{1} \prime\left|V^{P P}\right| n_{2} n_{2}^{\prime}>K_{n_{2} n_{2} \prime}, $

(4) where
$ <n_{1} n_{1} \prime\left|V^{P P}\right| n_{2} n_{2}^{\prime}> $ refers to the two-body pairing matrix. The RHB equation takes the form$ \left[\begin{array}{cc} \hat{h}_{\rm D}-m-\lambda & \Delta \\ -\Delta^{*} & -\hat{h}_{\rm D}+m+\lambda \end{array}\right]\left[\begin{array}{c} u_{k}(r) \\ v_{k}(r) \end{array}\right] \\ =E_{k}\left[\begin{array}{c} u_{k}(r) \\ v_{k}(r) \end{array}\right]. $

(5) Here,
$ \hat{h}_{\rm D} $ refers to the single nucleon Dirac Hamiltonian, m is the nucleonic mass, λ represents the chemical potential, and$ E_{k} $ is the quasi-particle energy eigenfunction. The pairing field can be represented as$ \left[\begin{array}{ll} \Delta_{++} & \Delta_{+-} \\ \Delta_{-+} & \Delta_{–} \end{array}\right]. $

(6) Even though
$ \Delta_{-+} $ and$ \Delta_{+-} $ contain numerous large terms, they provide minute contributions compared with the$ \sigma \triangledown $ term of the Dirac Hamiltonian [101, 102]. This leads to the introduction of the Gogny force in the pairing correlation [49, 103]. -
The CDFM was developed and formulated by Antonov et al. [104, 105]. It is a natural extension of the Fermi-gas model and is based on the δ-function limit of the generator coordinate method [106]. It is used to transform various quantities from infinite nuclear matter to their corresponding finite matter. Thus, using the CDFM, we can define the symmetry energy of a finite nucleus by weighting the corresponding quantities of infinite nuclear matter at local density. Following the CDFM approach, the effective symmetry energy S is given as [66, 73, 107–111]
$ S = \int_{0}^{\infty}{\rm d}x \vert{\cal{F}}(x)\vert^{2}S^{NM}(x). $

(7) The term
$ \vert{\cal{F}}(x)\vert^2 $ is a weight function, which is given by the expression$ \vert {\cal{F}}(x) \vert^{2} = -\bigg(\frac{1}{\rho_{0}(x)}\frac{{\rm d}\rho(r)}{{\rm d}r} \bigg)_{r=x}, $

(8) with the normalization as
$ \displaystyle\int_{0}^{\infty}{\rm d}x \vert {\cal{F}}(x) \vert^{2} = 1 $ . Here,$ \rho_{0}(x)= ({3A})/({4\pi x^{3}}) $ , and x is the spherical radius generator coordinate for all A nucleons inside the uniformly distributed spherical Fermi gas. The detailed analytical derivation used to obtain the density-dependent weight function is provided in Refs. [104, 105, 107, 108, 110].The surface
$ S_ {\rm S} $ and volume$ S_ {\rm V} $ components of symmetry energy are calculated separately using the Danielewicz method over the liquid drop model [83, 112]. The individual components, namely$ S_{ {\rm V}} $ and$ S_{ {\rm S}} $ , can be calculated from the symmetry energy expression as$ S_{ {\rm V}}=S\bigg(1+\dfrac{1}{\kappa A^{1/3}}\bigg), $

(9) and
$ S_{ {\rm S}}=\dfrac{S}{\kappa}\bigg(1+\dfrac{1}{\kappa A^{1/3}}\bigg), $

(10) respectively. Here, κ=
$S_{ {\rm V}}/S_{ {\rm S}}$ , which is calculated from the expression$ \kappa=\dfrac{3}{R\rho_{0}}\int_{0}^{\infty}{\rm d}x \vert{\cal{F}}(x) \vert^{2} x \rho_{0}(x) \bigg[\bigg(\dfrac{\rho_{0}}{\rho(x)}\bigg)^{\gamma}-1\bigg], $

(11) where
$ \rho_{0} $ is the nuclear matter equilibrium density, and$ R=r_{0}A^{1/3} $ [113]. In these calculations, we use$ \gamma=0.3 $ . The motive behind this selection is detailed in the results and discussion (Sec. III). -
In the RMF approach, the field equations are solved self-consistently by taking different inputs of the initial deformation
$ \beta_0 $ [66, 86, 94, 96–98]. The desired number of major shells for fermions and bosons is$ N_{F} $ =$ N_{B} $ = 12 for the convergence of the ground state solutions in the considered mass region. The number of mesh points for Gauss-Hermite and Gauss-Laguerre integration is 20 and 24, respectively. We obtain the bulk properties from the self-consistent RMF formalism, namely the binding energy, binding energy per particle, charge radius, and deformations. We then utilize the mean-field matter densities and nuclear matter quantities at saturation to calculate the nuclear symmetry energy, volume and surface symmetry energy, and the ratio of volume and surface symmetry energy for the isotopic chains of odd-A Scandium (Z = 21) and even-even Titanium (Z = 22) nuclei. The CDFM is used to construct a bridge between the infinite nuclear matter and finite nuclei in terms of symmetry energy within the non-linear NL3 [86] and density-dependent meson-exchange (DD-ME2) [27] effective interaction parameter sets. It is worth mentioning that these parameters are widely successful in providing a fairly good account of properties from light to super-heavy nuclei across the neutron-proton drip line [3, 80, 114, 115]. -
Nuclear binding energy (
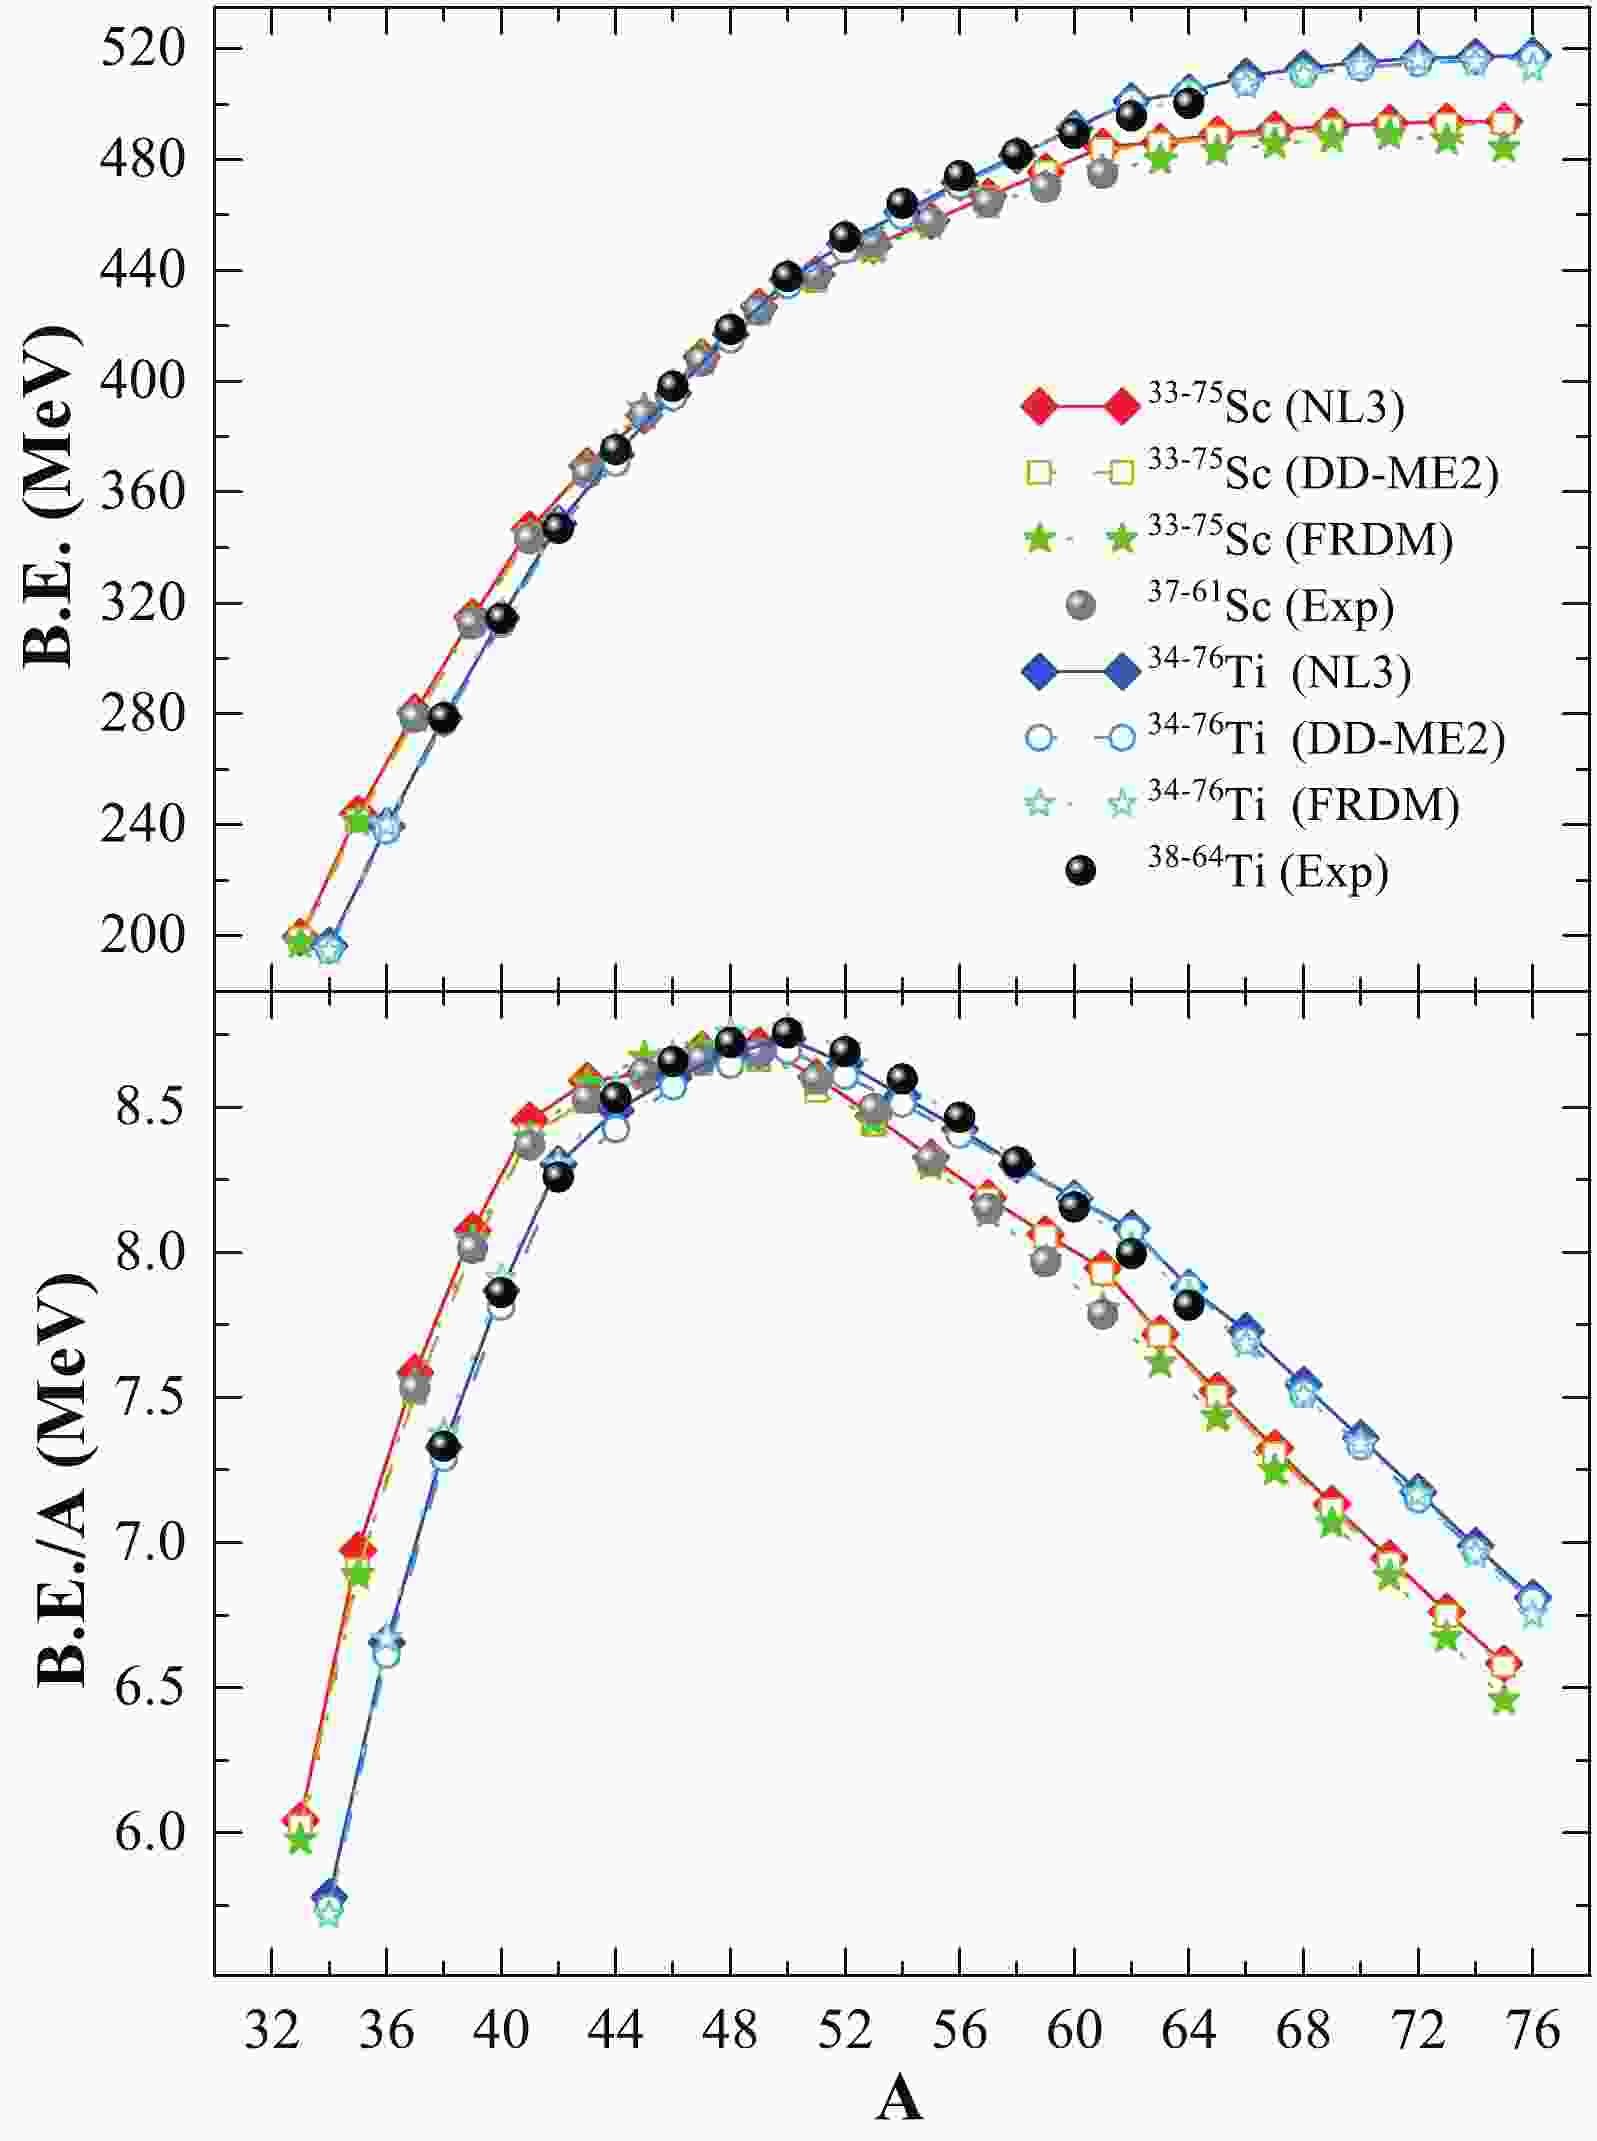
$ {B.E.} $ ) is the most fundamental and precise measured observable, facilitating a profound perspective for the determination of the shell/sub-shell of nuclei over isotopic and isotonic chains. The efficiency of a theoretical model is determined from its consistency in generating accurate experimental binding energies. The binding energy of odd-A Scandium (Z = 21) and even-even Titanium (Z = 22) isotopic chains are calculated using the relativistic mean-field for non-linear NL3 and relativistic-Hartree-Bogoliubov for density-dependent DD-ME2 interaction parameter sets. The results are listed in Tables 1 and 2 and shown in the upper panel of Fig. 1 along with the FRDM predictions [116] and experimental data [117]. The standard deviation of the RMF results are obtained for the NL3 and DD-ME2 parameter sets and FRDM prediction with respect to the available data in the revised final version of the manuscript. The magnitude of the standard deviation of the NL3 and DD-ME2 parameter sets and FRDM predictions is 3.66, 3.16, and 1.43 MeV for the Sc- isotopes and 2.47, 3.41, and 1.34 MeV for the Ti- isotopes, respectively. Note that NL3 and DD-ME2 have higher standard deviations with respect to the FRDM predictions, which is a result of the self-consistent microscopic models [94, 96, 118].Nucleus Binding energy Charge radius Quadrupole deformation Pairing energy NL3 DD-ME2 FRDM
[116]Expt.
[117]NL3 DD-ME2 HF-BCS
[97]Expt.
[119]NL3 DD-ME2 FRDM
[116]NL3 DD-ME2 $ ^{33} $ Sc

199.444 198.811 197.22 – 3.672 3.6685 3.69 – 0.1217 0.19224 0.122 -8.193 -5.794 $ ^{35} $ Sc

244.043 241.688 241.12 – 3.605 3.553 3.52 – 0.0115 0.02075 0.088 −11.576 −2.702 $ ^{37} $ Sc

280.696 278.104 279.25 278.684 3.588 3.5385 3.5 – 0.0063 0.0765 0.086 −15.973 −6.146 $ ^{39} $ Sc

314.941 312.269 313.54 312.527 3.58 3.5272 3.51 – 0.0053 0.0012 −0.063 −17.853 −7.256 $ ^{41} $ Sc

346.66 344.522 344.09 343.137 3.569 3.5231 3.52 – 0.0063 −0.00023 −0.021 −17.786 −3.089 $ ^{43} $ Sc

369.427 366.531 369.08 366.825 3.556 3.5181 3.52 3.5575 0.0043 −0.00241 −0.042 −18.895 −8.493 $ ^{45} $ Sc

387.786 387.128 390.21 387.852 3.543 3.5152 3.54 3.5459 0.0037 0.02165 0.043 −17.893 −9.842 $ ^{47} $ Sc

408.855 406.519 408.97 407.259 3.533 3.5133 3.55 – 0.0038 0.01953 −0.021 −15.799 −8.399 $ ^{49} $ Sc

426.902 424.604 425.49 425.627 3.53 3.5108 3.55 – 0.003 −0.00019 −0.032 −13.301 −3.45 $ ^{51} $ Sc

438.783 436.365 437.98 438.437 3.544 3.533 3.56 – 0.0049 −0.0004 −0.042 −12.712 −6.382 $ ^{53} $ Sc

448.925 447.332 447.86 450.256 3.562 3.5536 3.58 – 0.0075 0.00214 0.064 −11.193 −6.835 $ ^{55} $ Sc

458.004 457.132 456.45 457.655 3.587 3.5852 3.61 – 0.01355 0.01814 −0.104 −9.708 −9.404 $ ^{57} $ Sc

466.716 466.378 463.88 464.607 3.617 3.6172 3.64 – 0.0268 0.01222 −0.105 −8.175 −10.068 $ ^{59} $ Sc

475.708 475.217 470.43 470.053 3.649 3.6493 3.67 – 0.00505 0.00319 −0.073 −6.633 −8.458 $ ^{61} $ Sc

484.672 483.537 475.94 475.007 3.679 3.6801 3.69 – 0.00256 0.00074 −0.018 −4.939 −3.707 $ ^{63} $ Sc

486.301 485.943 480.02 – 3.699 3.7017 3.72 – 0.00825 0.00101 −0.021 −5.16 −9.554 $ ^{65} $ Sc

489.061 487.862 483.12 – 3.73 3.7235 3.74 – 0.15788 0.02663 0.129 −3.548 −12.57 $ ^{67} $ Sc

490.841 489.48 485.61 – 3.752 3.749 3.76 – 0.1862 0.15906 0.128 −3.071 −10.298 $ ^{69} $ Sc

492.145 490.869 487.64 – 3.771 3.768 3.77 – 0.22967 0.18334 −0.042 −2.58 −11.152 $ ^{71} $ Sc

493.187 491.864 488.81 – 3.787 3.7831 3.78 – 0.22064 0.17257 −0.032 −2.119 −12.539 $ ^{73} $ Sc

493.592 492.559 487.17 – 3.799 3.7955 – – 0.14992 0.13791 −0.032 −1.852 −14.115 $ ^{75} $ Sc

493.746 493.1 484.31 – 3.809 3.8059 – – 0.14131 0.08787 −0.042 −1.641 −15.204 Table 1. Ground state binding energy, root-mean-square charge radius, quadrupole deformation, and pairing energy of Sc isotopes of mass 33
$ \leq $ A$ \leq $ 75 are shown for the RMF (NL3 and DD-ME2) parameter sets. The available experimental data [117, 119], finite-range-droplet-model (FRDM) [116], and Hartree–Fock with Bardeen–Cooper–Schrieffer (HF-BCS) [97] predictions are given for comparison. The energies are in MeV, and radii in fm.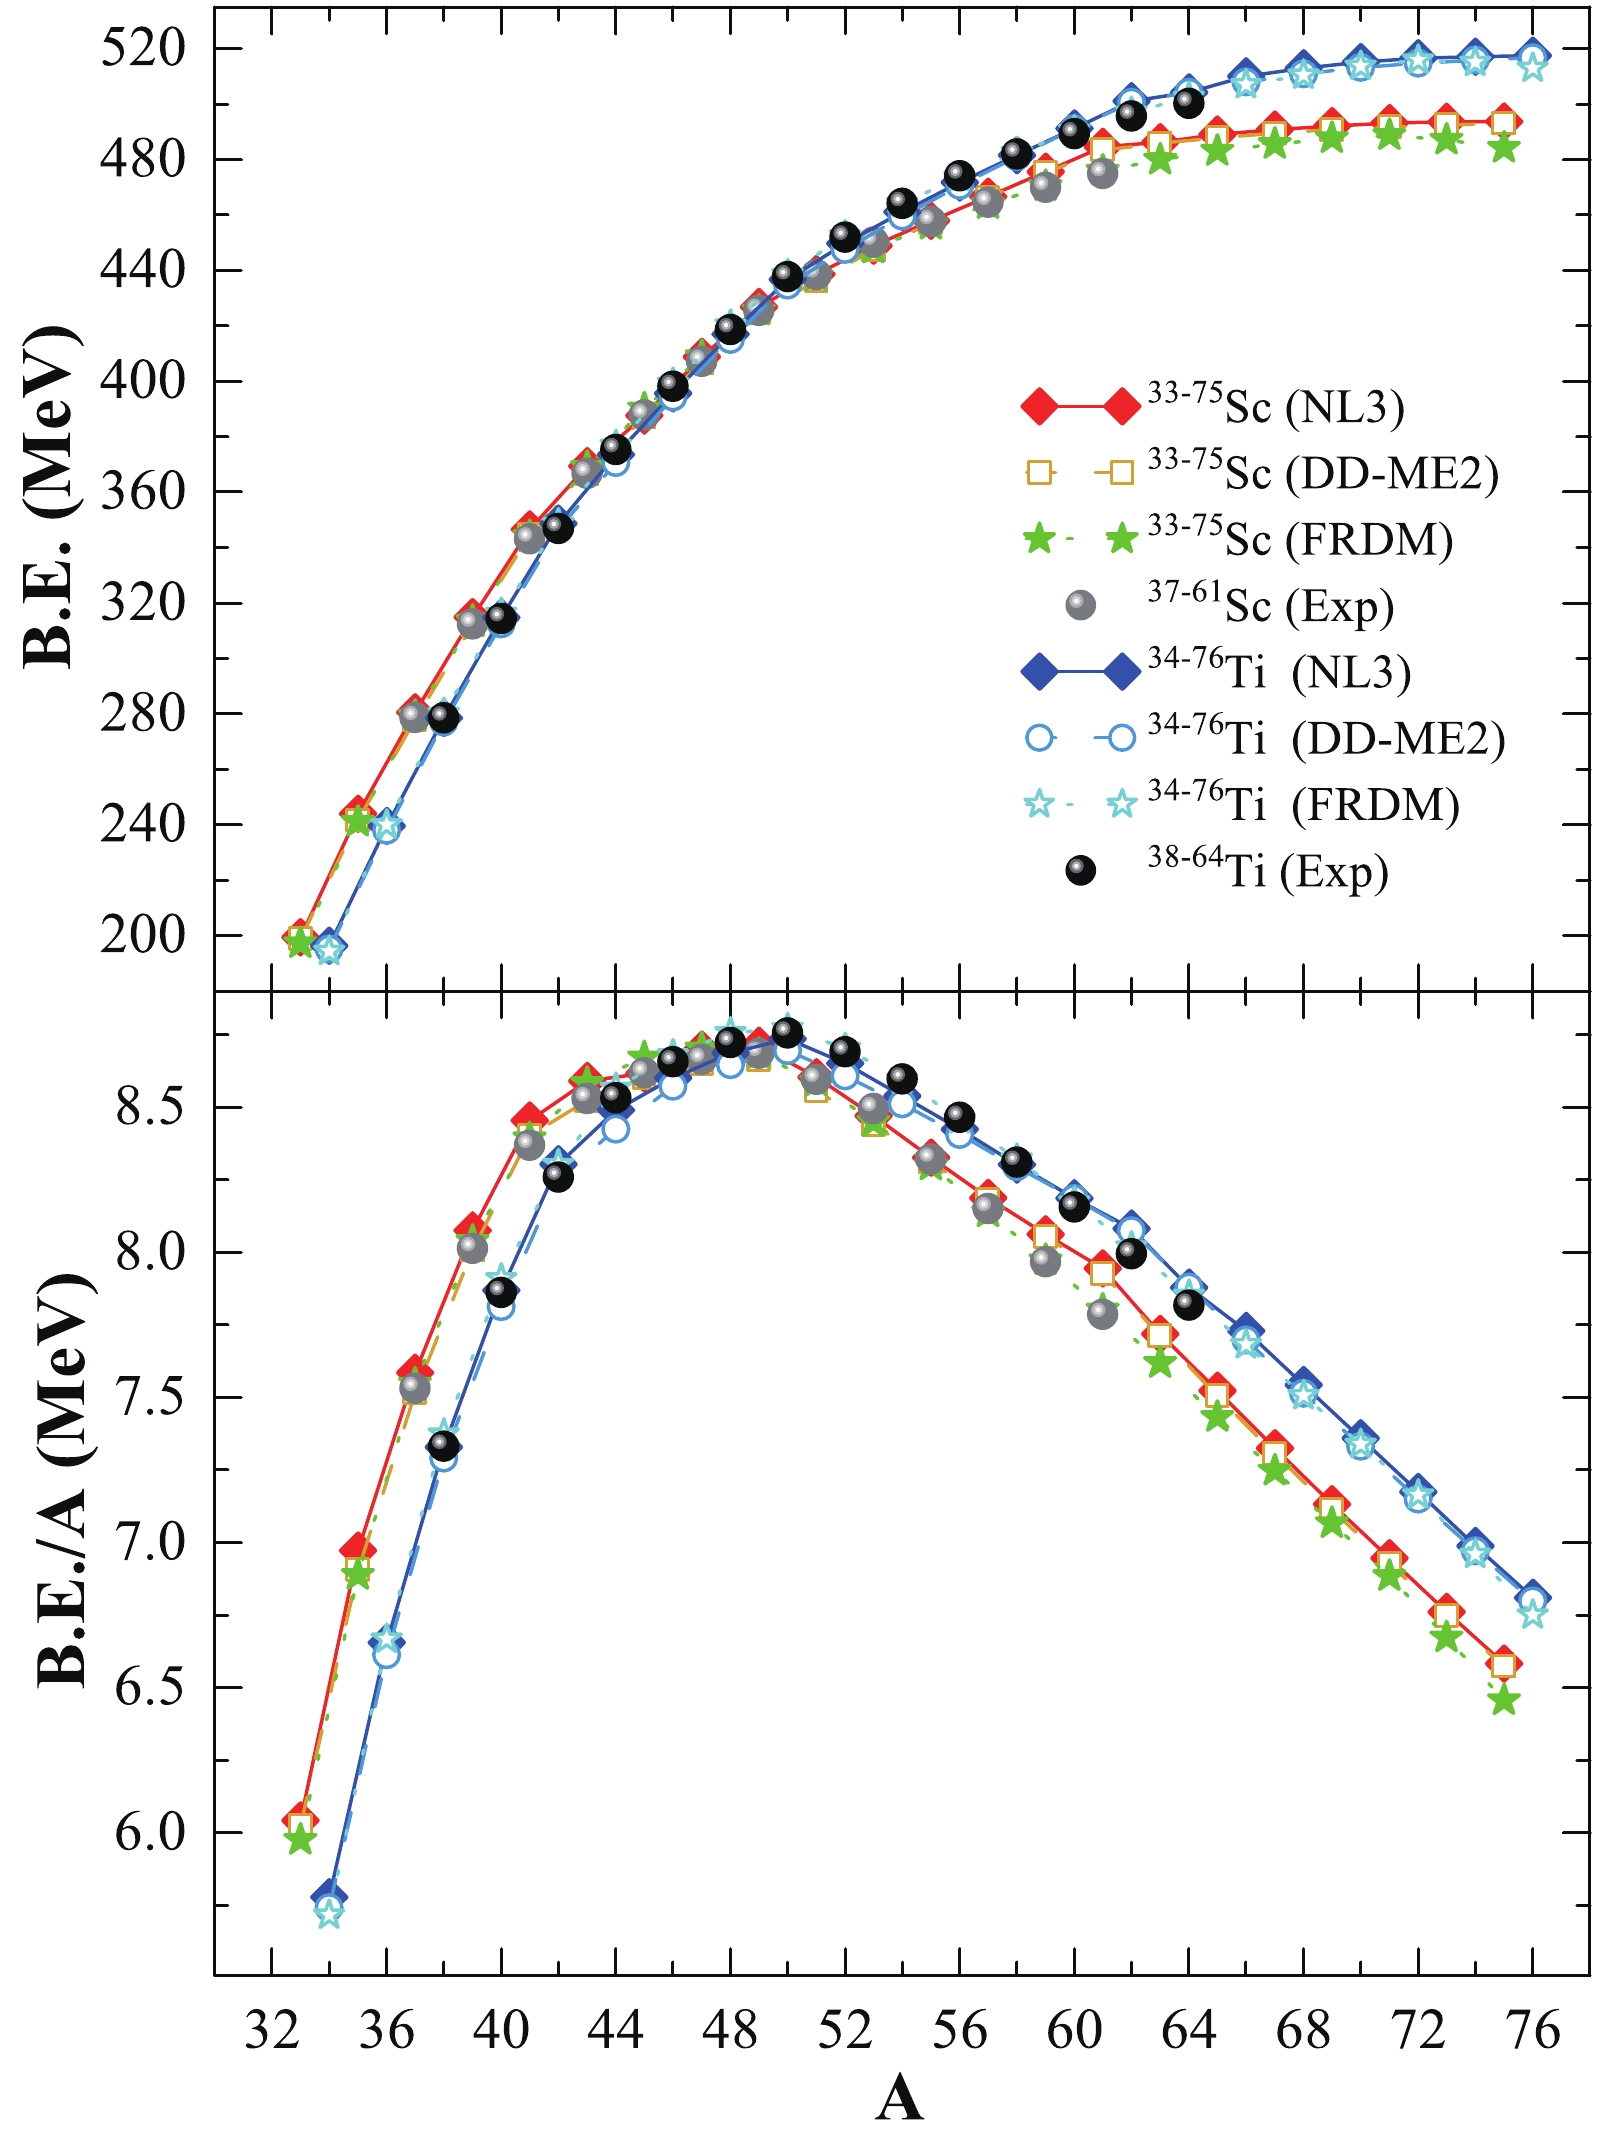
Figure 1. (color online) Binding energy (
$ B.E. $ ) and binding energy per nucleon ($ B.E./A $ ) from the non-linear NL3 and density-dependent DD-ME2 interactions for the Sc and Ti isotopic chains as a function of mass number (A) are shown in the upper and lower panels, respectively. The FRDM predictions [116] and available experimental data [117] are given for comparison.Nucleus Binding energy Charge radius Quadrupole deformation Pairing energy NL3 DD-ME2 FRDM
[116]Expt.
[117]NL3 DD-ME2 HF-BCS
[97]Expt.
[119]NL3 DD-ME2 FRDM
[116]Expt.
[120]NL3 DD-ME2 $ ^{34} $ Ti

196.5 195.259 194.38 – 3.77 3.7662 3.77 – 0.37039 0.37824 0.261 – −6.129 −2.018 $ ^{36} $ Ti

239.629 238.114 240.07 – 3.671 3.6395 3.63 – 0.03558 0.18489 0.106 − −11.128 −2.649 $ ^{38} $ Ti

278.536 277.068 280.22 278.616 3.646 3.6079 3.58 – 0.08241 0.21885 0.118 − −15.363 −2.753 $ ^{40} $ Ti

314.811 312.505 316.36 314.48 3.633 3.5823 3.56 – 0.00393 0.06044 −0.031 − −18.071 −8.615 $ ^{42} $ Ti

348.785 346.784 348.74 346.888 3.619 3.5716 3.56 – 0.00569 −0.0002 0.001 0.319 −18.384 −4.967 $ ^{44} $ Ti

373.608 370.707 376.91 375.475 3.603 3.5642 3.57 3.6115 0.00588 0.07239 0 0.268 −19.892 −9.141 $ ^{46} $ Ti

395.692 394.309 399.29 398.197 3.587 3.5795 3.6 3.607 0.00608 0.24338 0.021 0.317 −19.271 −2.644 $ ^{48} $ Ti

417.018 415.046 420.36 418.704 3.574 3.5621 3.6 3.5921 0.00654 0.16686 0.011 0.269 −17.071 −5.662 $ ^{50} $ Ti

436.809 434.735 438.59 437.786 3.567 3.5473 3.59 3.5704 0.00399 0.00604 0 0.166 −14.717 −5.394 $ ^{52} $ Ti

449.875 447.628 452.6 451.967 3.581 3.5808 3.6 – 0.0088 0.15133 0 − −14.488 −4.914 $ ^{54} $ Ti

461.131 459.622 464.16 464.26 3.605 3.6051 3.62 – 0.08554 0.12822 −0.011 − −12.906 −8.326 $ ^{56} $ Ti

471.776 470.734 473.65 474.102 3.635 3.6324 3.65 – 0.11633 0.11806 0.129 − −11.024 −9.398 $ ^{58} $ Ti

481.569 481.084 482.65 482.038 3.66 3.6582 3.67 – 0.08938 0.06648 −0.105 − −9.487 −11.333 $ ^{60} $ Ti

491.237 491.159 490.44 489.42 3.685 3.6865 3.7 – 0.01385 0.00885 −0.011 − −8.103 −10.762 $ ^{62} $ Ti

501.136 500.647 497.16 495.69 3.712 3.7157 3.73 – 0.00239 0.00056 0 − −6.217 −5.895 $ ^{64} $ Ti

504.292 504.322 502.54 500.352 3.733 3.7369 3.77 – 0.03986 0.00372 0 − −6.176 −11.727 $ ^{66} $ Ti

510.176 508.051 507.01 – 3.778 3.7803 3.78 – 0.206 0.21763 0.011 − −3.801 −2.315 $ ^{68} $ Ti

512.949 511.006 510.5 – 3.798 3.7978 3.8 – 0.22833 0.2319 0.128 – −3.474 −6.918 $ ^{70} $ Ti

515.197 513.276 513.73 – 3.819 3.8182 3.8 – 0.27777 0.26511 0 – −2.898 −7.748 $ ^{72} $ Ti

516.597 514.828 515.85 – 3.831 3.8313 3.81 – 0.25652 0.24713 0 – −2.505 −9.889 $ ^{74} $ Ti

517.177 515.874 515.08 – 3.838 3.8411 3.82 – 0.18922 0.21123 0 – −2.234 −12.311 $ ^{76} $ Ti

517.602 516.697 513.06 – 3.848 3.8495 3.84 – 0.17842 0.16559 0 – −1.982 −13.973 Table 2. Ground state binding energy, root-mean-square charge radius, quadrupole deformation, and pairing energy of Ti isotopes of mass 34
$ \leq $ A$ \leq $ 76 are shown for the RMF (NL3 and DD-ME2) parameter sets. The available experimental data [117, 119, 120], finite-range-droplet-model (FRDM) [116], and Hartree–Fock with Bardeen–Cooper–Schrieffer (HF-BCS) [97] predictions are given for comparison. The energies are in MeV, and radii in fm.The binding energy per particle (
$ B.E./A $ ) for both isotopic chains is shown in the lower panel of Fig. 1. From the figure and Tables 1 and 2, it can be observed that the results of our calculations on binding energy are of reasonably good accuracy because they overlap with the experimental data and FRDM predictions, including the neutron-rich regions of the isotopic chains. A detailed inspection shows that the value of the binding energy per particle increases with neutron number, reaching a peak value at N = 28 for both chains before finally decreasing. Further careful observation of the neutron-rich side of the isotopic chain shows minute discontinuity or a kink at N = 40, which is a main interest in this analysis. Interestingly, no evidence of discontinuity is observed at the traditional magic number N = 50. It is worth mentioning that the kink in the binding energy per particle provides greater stability of the isotope, that is, a possible shell/sub-shell closure of the nuclei, compared to its neighbouring isotopes. From Tables 1 and 2, in the case of the NL3 parameter set, the pairing energy (E$ _{\rm pair} $ ) decreases over both the Sc- and Ti- isotopic chains. In contrast, the DD-ME2 parameter shows relatively large abnormal changes in the pairing energy over both isotopic chains. A careful examination of the relative variation in the magnitude of E$ _{\rm pair} $ shows sharp discontinuities/kinks at specific neutron numbers, namely N= 20, 28, and 40 for Sc- nuclei and N= 20 and 40 for Ti nuclei, in the case of the DD-ME2 parameter set, which is in stark contrast with the minute magnitude obtained with the NL3 parameter set. This method provides a better insight into the trend of pairing energy using Bogoliubov transformation over the BCS approach [95, 103]. -
The quadrupole deformation parameter
$ \beta_2 $ is evaluated from the resulting proton and neutron quadrupole moments [96].$ Q = Q_n + Q_p =\sqrt{\frac{16\pi}5} \left (\frac3{4\pi} A R^2 \beta_2 \right). $

(12) The ground state
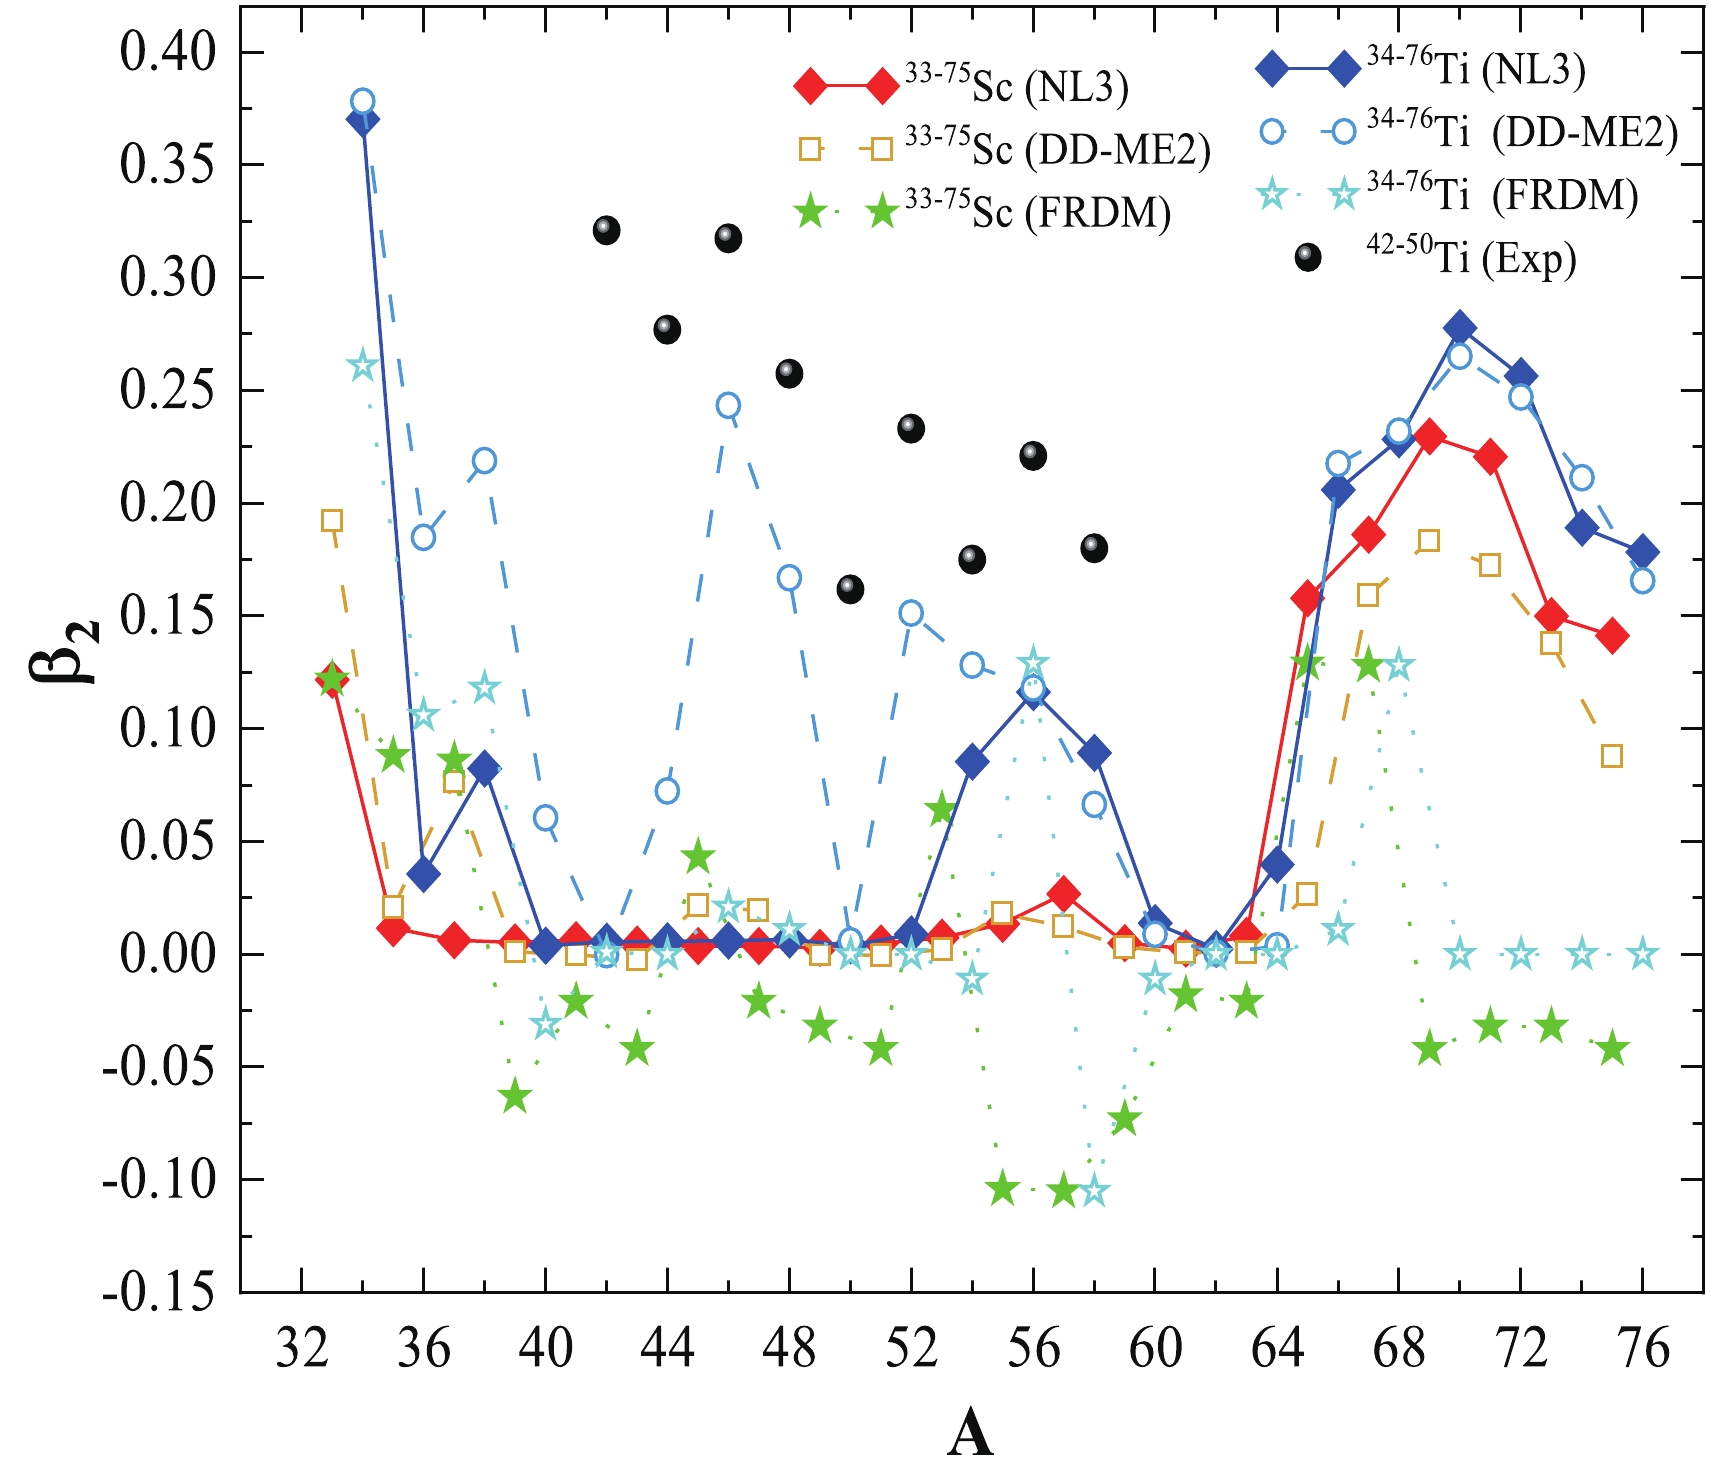
$ \beta_{2} $ is calculated from the RMF of the NL3 and relativistic-Hartree-Bogoliubov DD-ME2 parameter sets for the isotopic chains of Sc- and Ti- nuclei. In Fig. 2, we show$ \beta_{2} $ as a function of neutron number for the odd-A Scandium and even-even Titanium isotopic chains using both parameter sets along with the FRDM predictions [116] and experimental data [120]. In Fig. 2, we notice that the quadrupole deformation for the NL3 parameter set and FRDM predictions underestimate the experimental data, wherever available. In contrast, the DD-ME2 parameter estimate is close to the experimental data, except for a few isotopes of the Ti-nuclei. A miniature oblate configuration is observed for a few isotopes of the Ti- and Sc- nuclei for the DD-ME2 parameter set and FRDM predictions, whereas no such shape is found for the NL3 case. Moreover, we note a shape transition from spherical to prolate near$ N \geq $ 44 for the Scandium and near$ N \geq $ 40 for the Titanium isotopic chains in both the NL3 and DD-ME2 parameter sets. It is important to note that theoretical ground state quadrupole deformation is primarily characterized by shape fluctuations, which present quadrupole moment effectiveness as insignificant [121]. Moreover, in many Sc- and Ti- nuclei, which are not (axially) well-deformed, experimental quadrupole deformation estimated from the experimental B(E2, 2+$ \rightarrow $ 0+) values assuming a rotational formula is ineffective. These calculations are only provided so that readers may obtain a firsthand comparison-based idea regarding the degrees of freedom of the shapes of these nuclei. -
As well as nuclear deformations, the rms charge radius is also a significant quantity associated with the shape of finite nuclei. Furthermore, the rms radii of protons and neutrons can be used to impose constraints on not only the saturation properties of infinite nuclear matter but also the study of stellar collapse and type-II supernova explosions [122]. Moreover, the charge radius provides structural effects corresponding to nuclear shape transitions and nuclear spectroscopy, which provide useful information about the shell of the nucleus [123]. The expression for rms radius is given as [3, 96, 124, 125]
$ \begin{equation} <r^{2}_{m}>=\frac{1}{A}\int \rho(r_{\perp},z)r^{2}{\rm d}\tau. \end{equation} $

(13) Here, A is the mass number,
$ \rho(r_{\perp}, z) $ is the axially deformed density, and τ is the volume. From the rms proton radius, it is relatively easy to calculate the rms charge radius using the simple relation$ <r^{2}_{ch}>=<r^{2}_{p}>+0.64 $ [126]. The macroscopic-microscopic models and effective interactions within microscopic mean-field formulations are widely used in the calculation of the rms charge radius. [28, 118, 119, 126–128]. We estimate the variation in charge radius over the isotopic chains of odd-A Scandium and even-even Titanium nuclei, as shown in the top panel of Fig. 3. The calculated charge radius ($ r_{\rm ch} $ ) for the NL3 and DD-ME2 parameter sets are compared with the HF-BCS predictions [97] and latest experimental data [119]. From the figure, a uniform variation can be observed for both the NL3 and DD-ME2 parameter sets. For example, a sharp decrease is observed in the charge radius from the proton-rich side of the isotopic chain for both the Sc- and Ti- nuclei followed by a dip at the neutron magic number N = 28; it then uniformly increases with mass number. A detailed inspection shows poor abnormality at approximately N = 40 for both isotopic chains. Overall, the calculated values for NL3 and DD-ME2 are in good agreement with the HF-BCS predictions [97] and experimental data [119].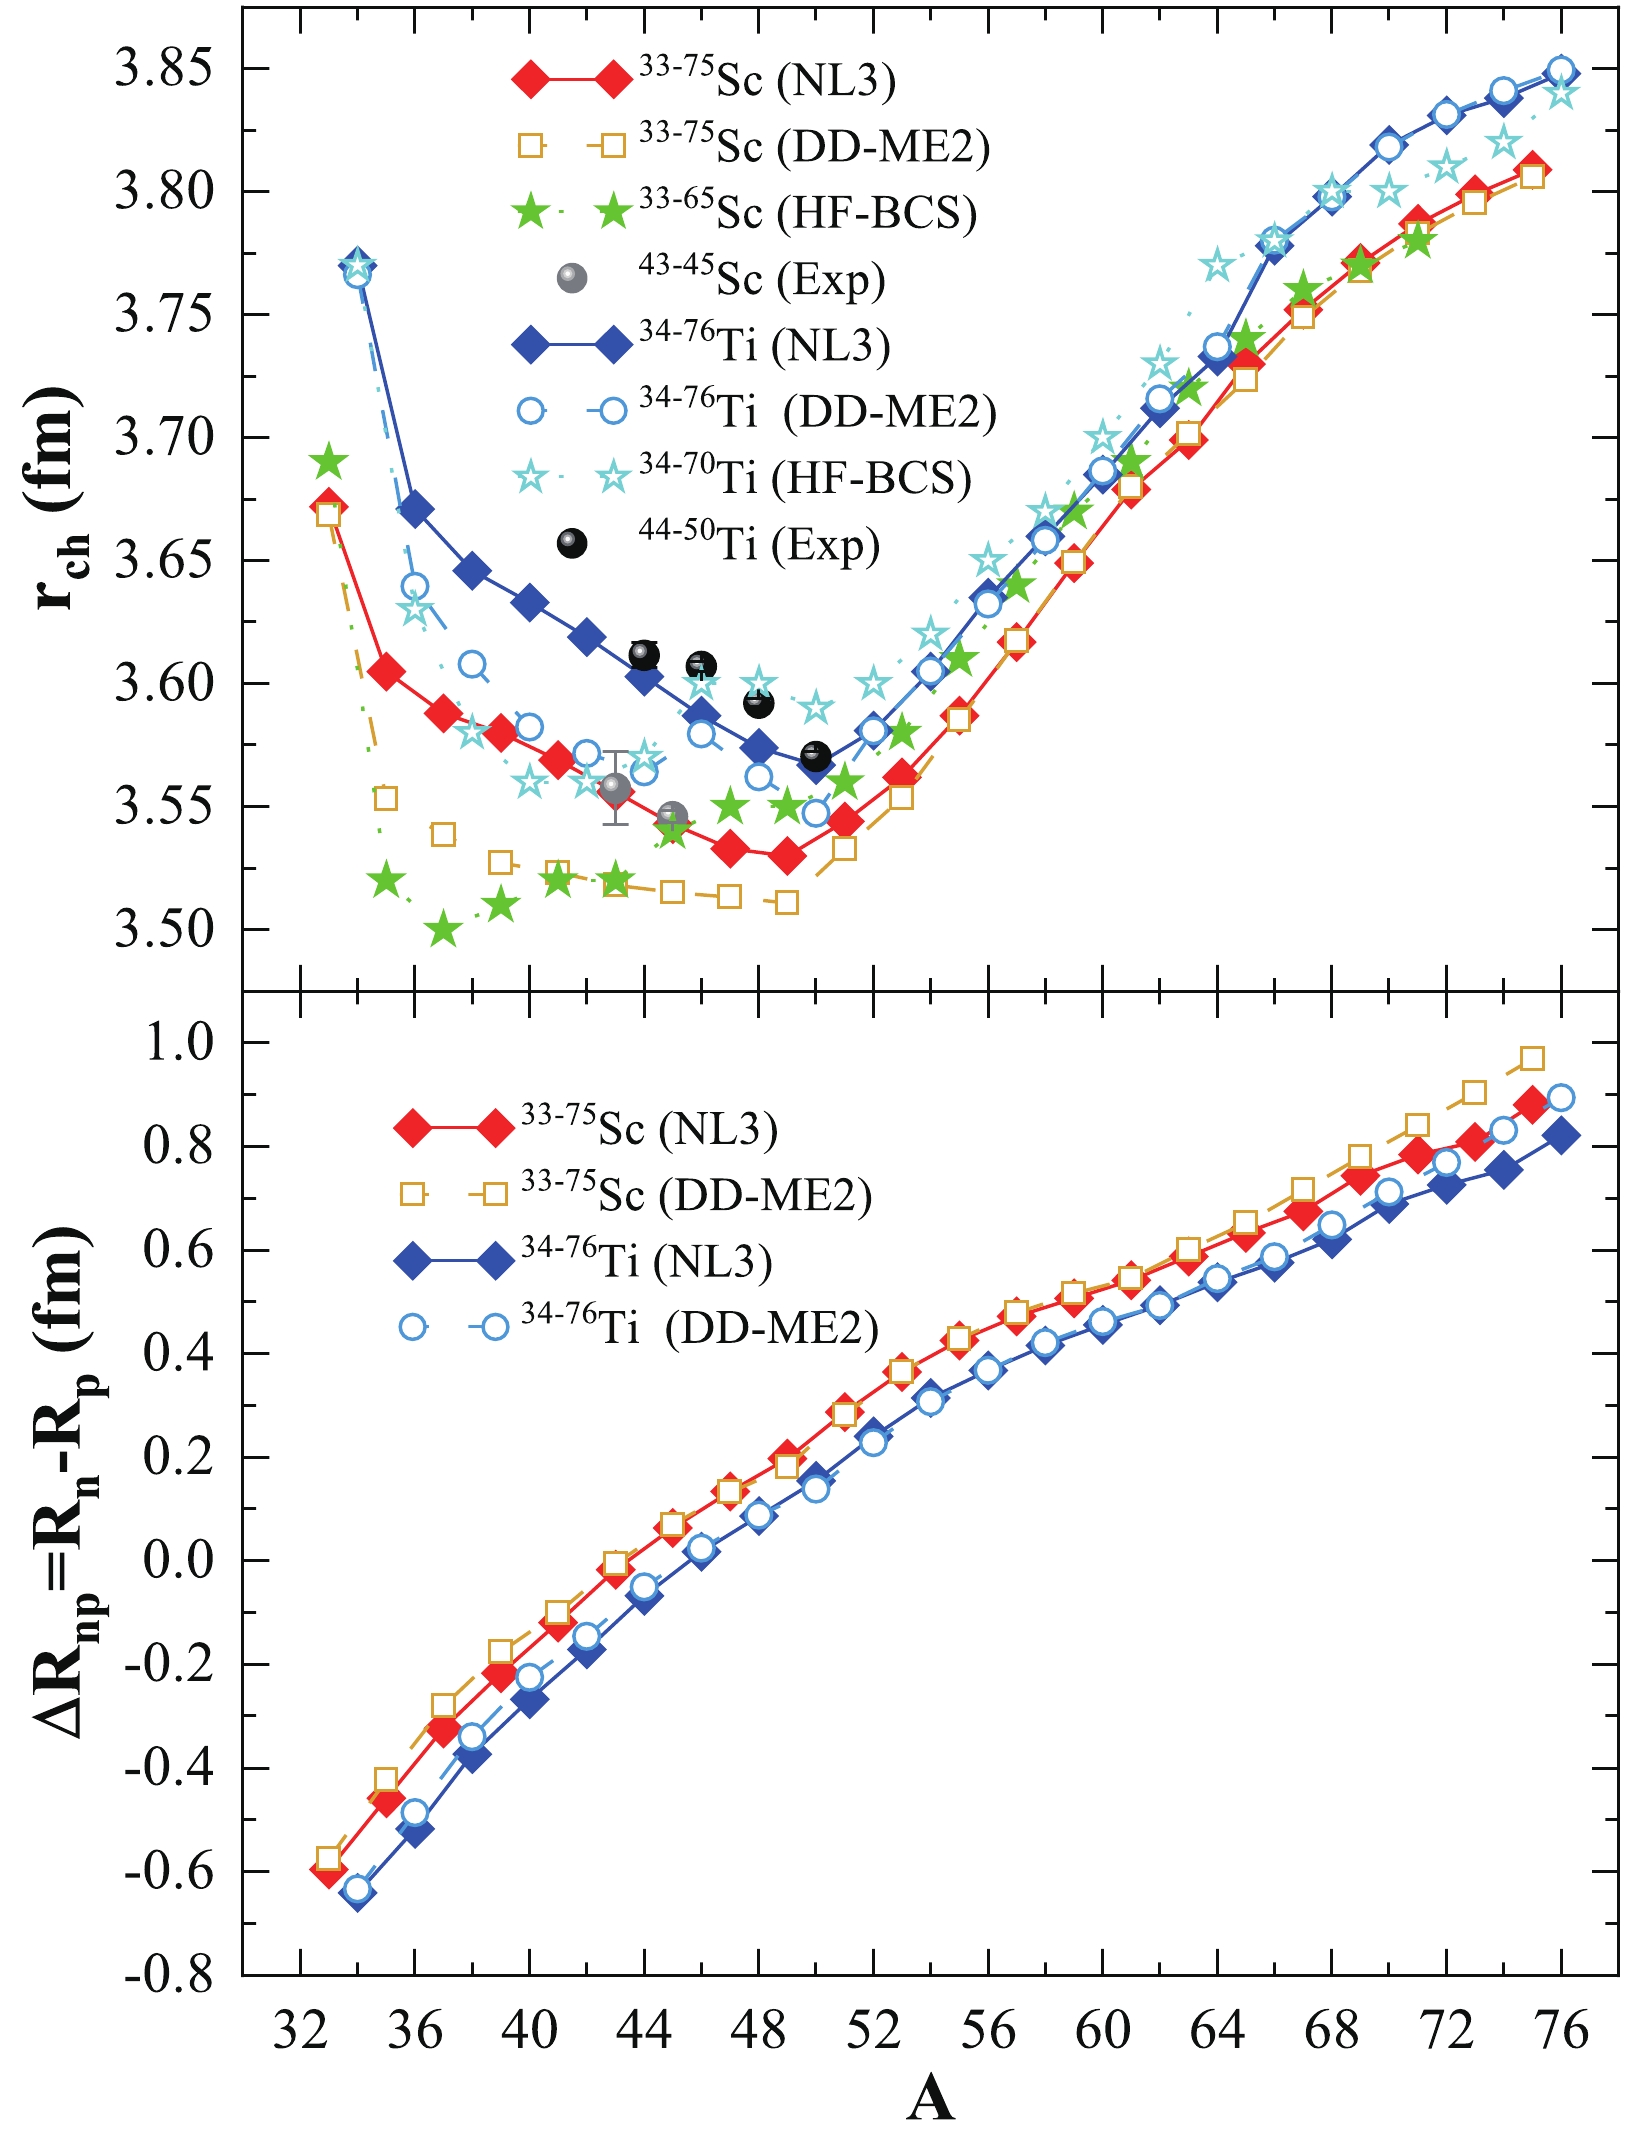
Figure 3. (color online) Charge radius
$ r_{\rm ch} $ and neutron-skin thickness$ \Delta R_{np} $ from the NL3 and DD-ME2 interactions as a function of mass number (A) for the Sc and Ti isotopic chains. The Hartree–Fock+Bardeen–Cooper–Schrieffer (HF-BCS) predictions [97] and available experimental data [119] are given for comparison.The neutron-skin thickness of a nucleus is defined as the difference between the rms radius of the neutrons and protons inside the nucleus and is expressed as
$ \Delta R_{np}= <r^{2}_{n}>-<r^{2}_{p}> $ . Experimentally, the value of the proton rms radius is obtained from the charge radius. The neutron skin-thickness is one of the key parameters from finite nuclei directly connected with the isospin-dependent quantities of infinite nuclear matter discussed in Sec. III. For example, mean-field models predict a linear correlation between the$ \Delta R_{np} $ of 208Pb and the slope of the symmetry energy of infinite nuclear matter at saturation density [66, 68, 70, 71, 76–81, 83, 129]. Furthermore, in finite nuclei,$ \Delta R_{np} $ is connected with the surface and volume symmetry energy, which can serve as an observable for determining the shell/sub-shell closure in nuclei near and beyond the drip-line [66, 72, 76–80, 83, 130]. The variation in neutron-skin thickness over the isotopic chains of odd-A Scandium and even-even Titanium isotopes as a function of mass number is shown in the bottom panel of Fig. 3. From the figure, it can be observed that both the NL3 and DD-ME2 parameter sets show smooth increments with increasing mass number. Minor peaks are observed at the neutron magic numbers N = 20 and 28, whereas no appreciable change is observed at the neutron magic number N = 50. Moreover, small dips are observed at N = 34 and 40, suggesting the existence of shell/sub-shell closure. -
The two-neutron separation energy
$ S_{ {2n}} $ is defined as the energy required to remove two neutrons from the nucleus. It is estimated from the ground state nuclear binding energies,$ B.E. (Z, N) $ and$ B.E. (Z, N-2) $ , using the formula$ S_{ {2n}} (Z, N) = - B.E. (Z, N) + B.E. (Z, N-2) $ . The two-neutron separation energy provides comprehensive information about the Q-value corresponding to a hypothetical simultaneous transfer of two neutrons into the N−2 ground state, resulting from the ground state of the nucleus having an N number of neutrons. The two-neutron separation energy of a nucleus explicitly depends on the variations in the ground-state properties of both nuclei, namely configuration, deformation (shape), pairing, and neutron-to-proton asymmetry. Furthermore, the Q-value is a critical parameter for determining the possibility of spontaneous and simultaneous neutron emissions.The
$ B.E. (N, Z) $ and$ B.E. (N-2, Z) $ nuclei are calculated using the non-linear NL3 and density-dependent DD-ME2 interaction parameters. To correctly estimate the nucleon separation energy$ S_{ {2n}} $ , it is necessary to predict precise mass measurements. In the top panel of Fig. 4, we compare the$ S_{ {2n}} $ as a function of neutron number of the odd-A isotopes of Scandium (Z = 21) and even-even isotopes of Titanium (Z = 22) nuclei for both parameters. The FRDM predictions [116] and latest experimental data [117] are also given for comparison. In Fig. 4, it can be observed that in an isotopic chain,$ S_{ {2n}} $ decreases with increasing neutron number. A few significant kinks appear at the neutron magic numbers N = 20, 28, and 40, as well as an inconsequential observation at N = 50, for both isotopic chains within the NL3 and DD-ME2 parameter sets. These kinks in the$ S_{ {2n}} $ values justify the stability of the nucleus, that is, the energy required for the removal of two neutrons from a nucleus with the neutron number$ N_{\rm magic} \pm 2 $ is smaller in magnitude than the energy required for the removal of two neutrons from a nucleus associated with$ N_{\rm magic} $ . Here,$ N_{\rm magic} $ refers to a magic number configuration of neutrons.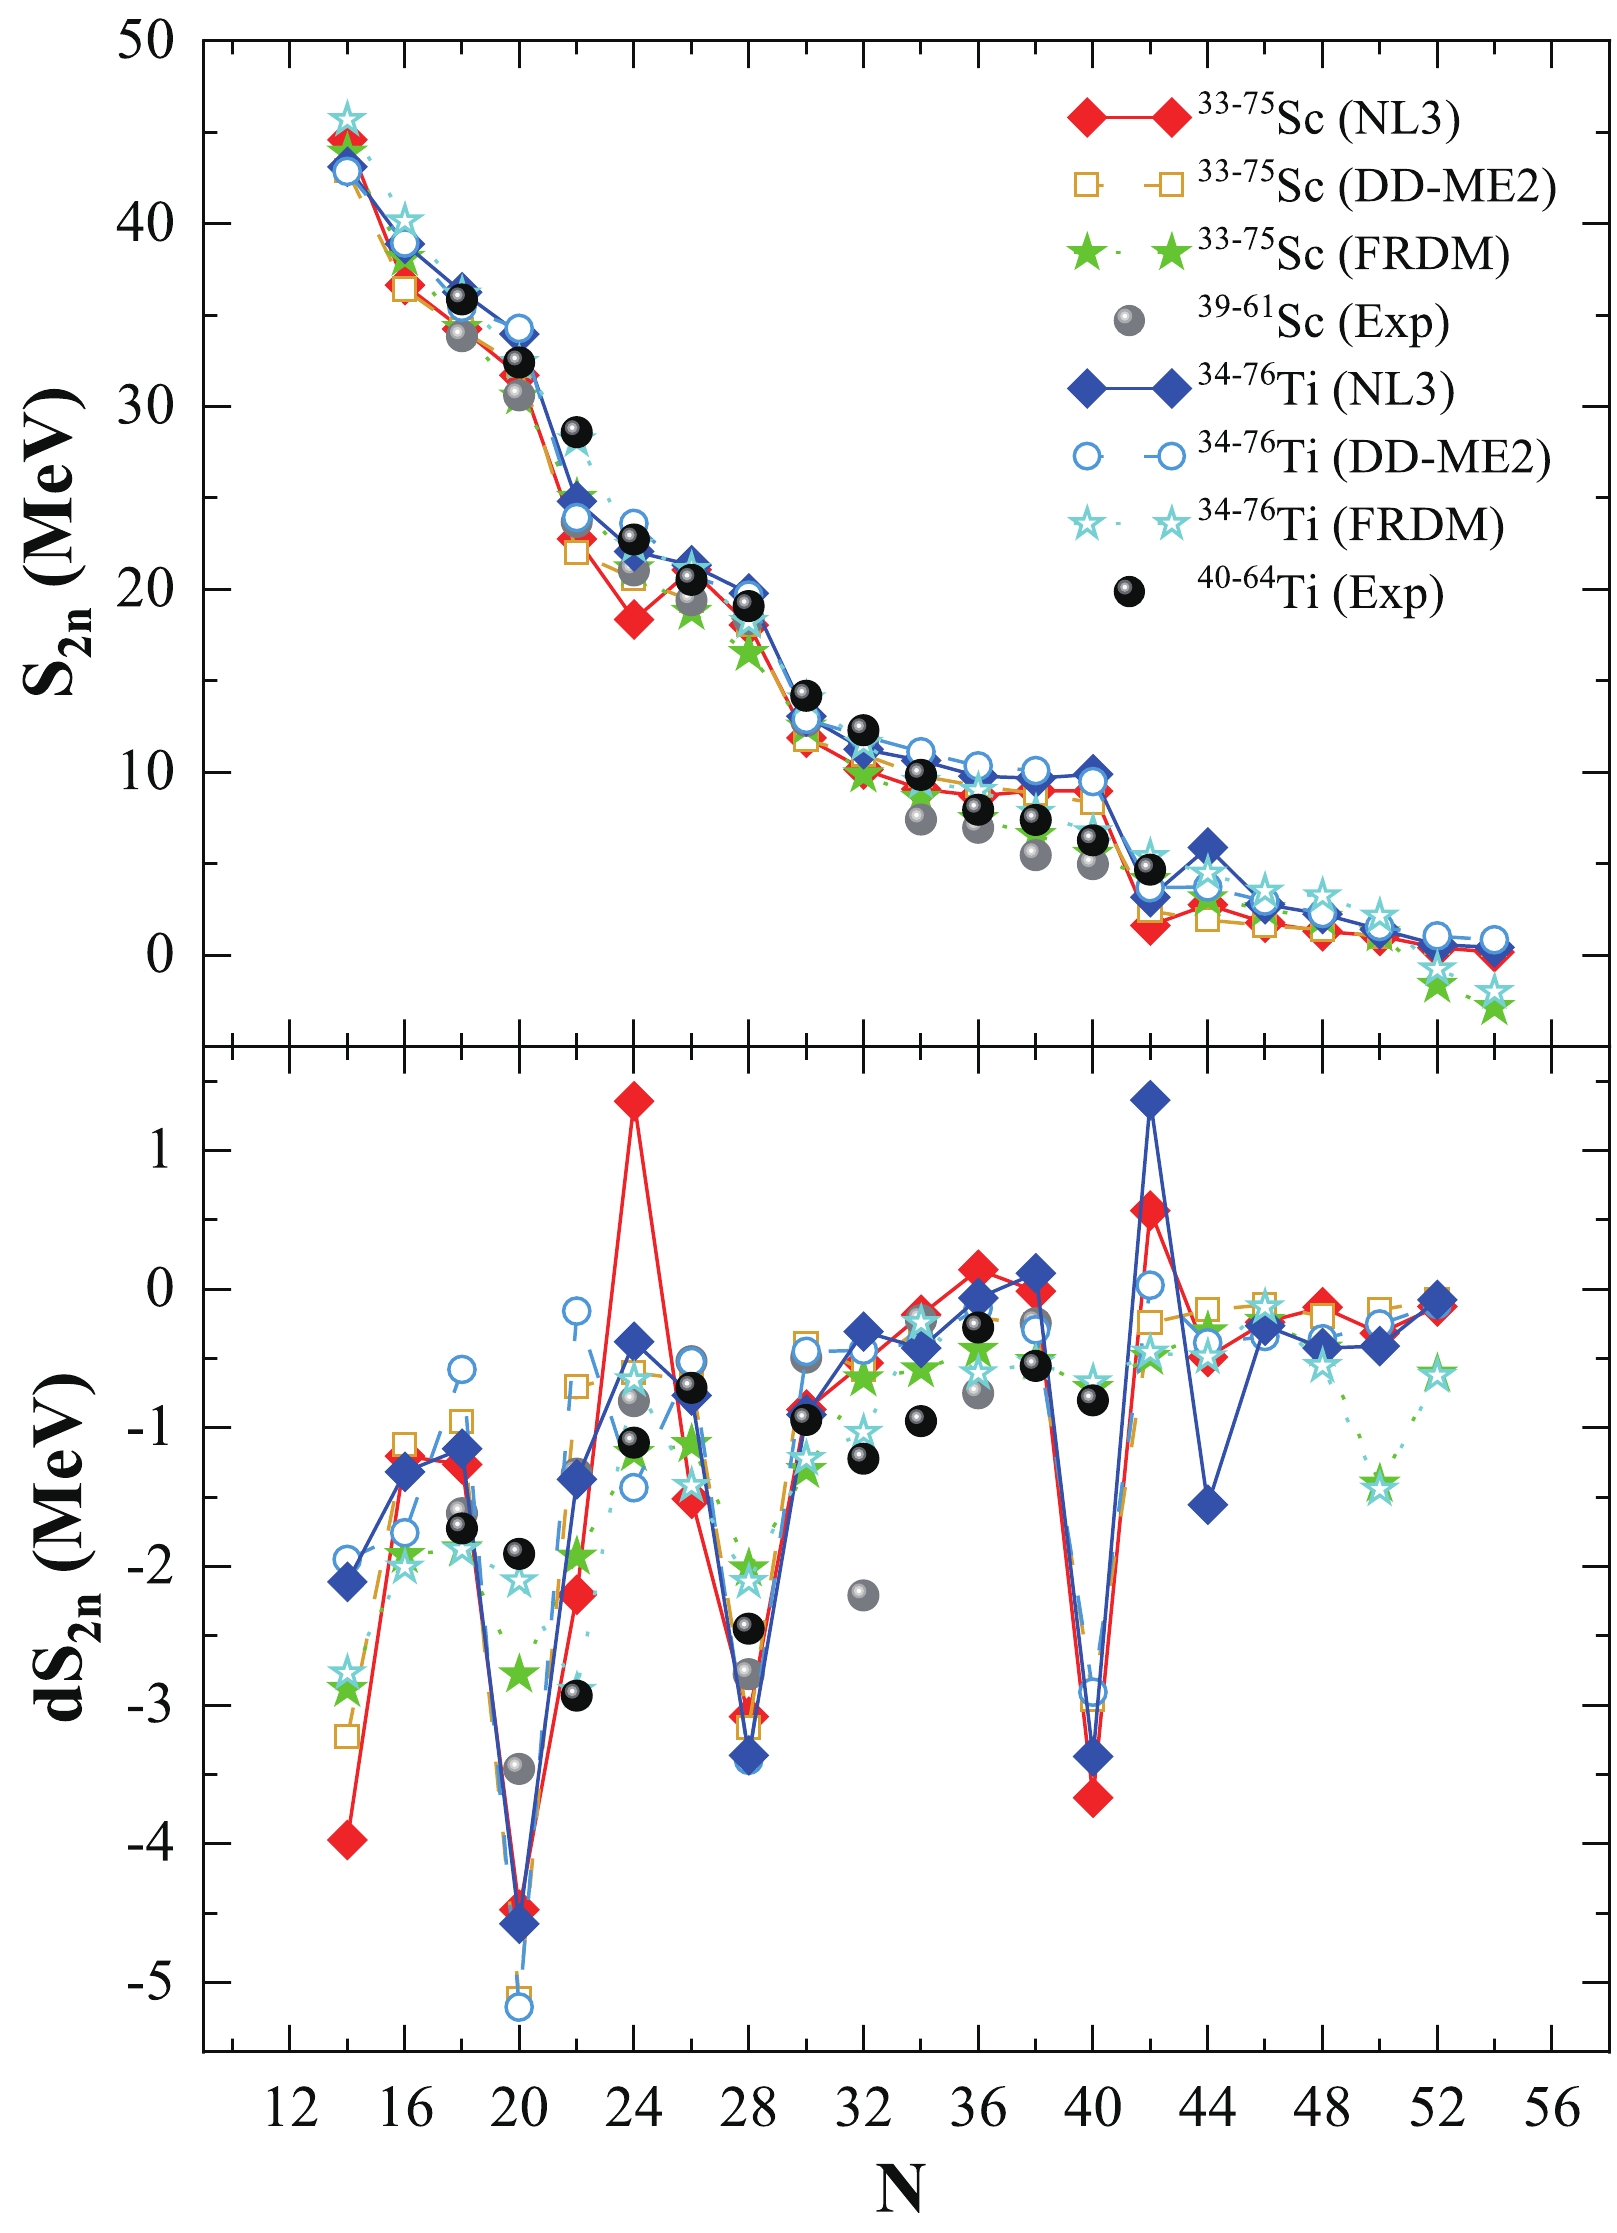
Figure 4. (color online) Two neutron separation energies
$ S_{ {2n}} $ (upper panel) and the differential variation in the separation energy$ {\rm d}S_{ {2n}} $ (lower panel) from the NL3 and DD-ME2 interactions as a function of neutron number (N) for the Sc and Ti isotopic chains. The FRDM interactions [116] and available experimental data [117] are provided for comparison.The differential variation in two-neutron separation energy (
$ {\rm d}S_{ {2n}} $ ) as a function of neutron number (N) is given as${\rm d}S_{ {2n}}(Z,N)=({S_{ {2n}}(Z,N+2)-S_{ {2n}}(Z,N))}/{2}$ .$ {\rm d}S_{ {2n}} $ is a parameter used to explore the rate of change of separation energy with respect to the change in neutron number along an isotopic chain. In the bottom panel of Fig. 4, we compare the calculated$ {\rm d}S_{ {2n}} $ for the NL3 and DD-ME2 parameters with the FRDM predictions [116] and latest available experimental data [117]. Generally, a large, deep, and sharp decrease in$ {\rm d}S_{ {2n}} $ predicts the existence of shell closure in an isotopic chain, providing much-needed additional information about the nuclear structure. These sharp discontinuities are observed at the neutron magic numbers N = 20 and N = 28, with a marginal kink at N = 50. At the same time, large kinks are also observed at N = 24 and 40. The peak trends observed in the$ {\rm d}S_{ {2n}} $ values are similar to those of the$ S_{ {2n}} $ values for the respective Scandium and Titanium isotopic chains of nuclei. It is observed that the calculated$ S_{ {2n}} $ and$ {\rm d}S_{ {2n}} $ are in agreement with the theoretical FRDM predictions [116] and experimentally available data [117]. -
Isospin properties, namely symmetry energy and its components, are connected with the surface characteristics of nuclear density distributions [73, 104, 105, 109, 111]. To obtain the symmetry energy of finite nuclei, we must follow two steps: First, using the density distribution obtained from the RMF formalism with the non-linear NL3 and relativistic-Hartree-Fock with density-dependent DD-ME2 parameter sets, we generate the weight function
$ \vert {\cal{F}} (x) \vert^{2} $ using Eq. (8) for each nucleus [73, 104, 105, 109, 111]. Second, we use the weight function and corresponding saturation properties of nuclear matter to calculate the effective symmetry energy in the realm of finite nuclear matter [73, 104, 105, 109, 111].In Fig. 5 (upper panel), we present the total density distribution (ρ), that is, the sum of the neutron density (
$ \rho_{n} $ ) and proton density ($ \rho_{p} $ ), as a function of nuclear distance for odd-A Sc- and even-even Ti- isotopes using the NL3 and DD-ME2 parameter sets. A thorough investigation of the graphs shows that with increasing proton number (Z), a minute enhancement in the surface region is observed. Thus, the total density distribution has a profound role in effective nuclear matter quantities. The weight function$ \vert {\cal{F}} (x) \vert^{2} $ , which is calculated from the corresponding total densities of the nuclei, is displayed in the lower panel of Fig. 5. By comparing the upper and lower panels, it can be inferred that the surface density profile is reflected in the weight function. In other words, a lower central density value provides a shorter weight function height for given nuclei and maxima at the surface.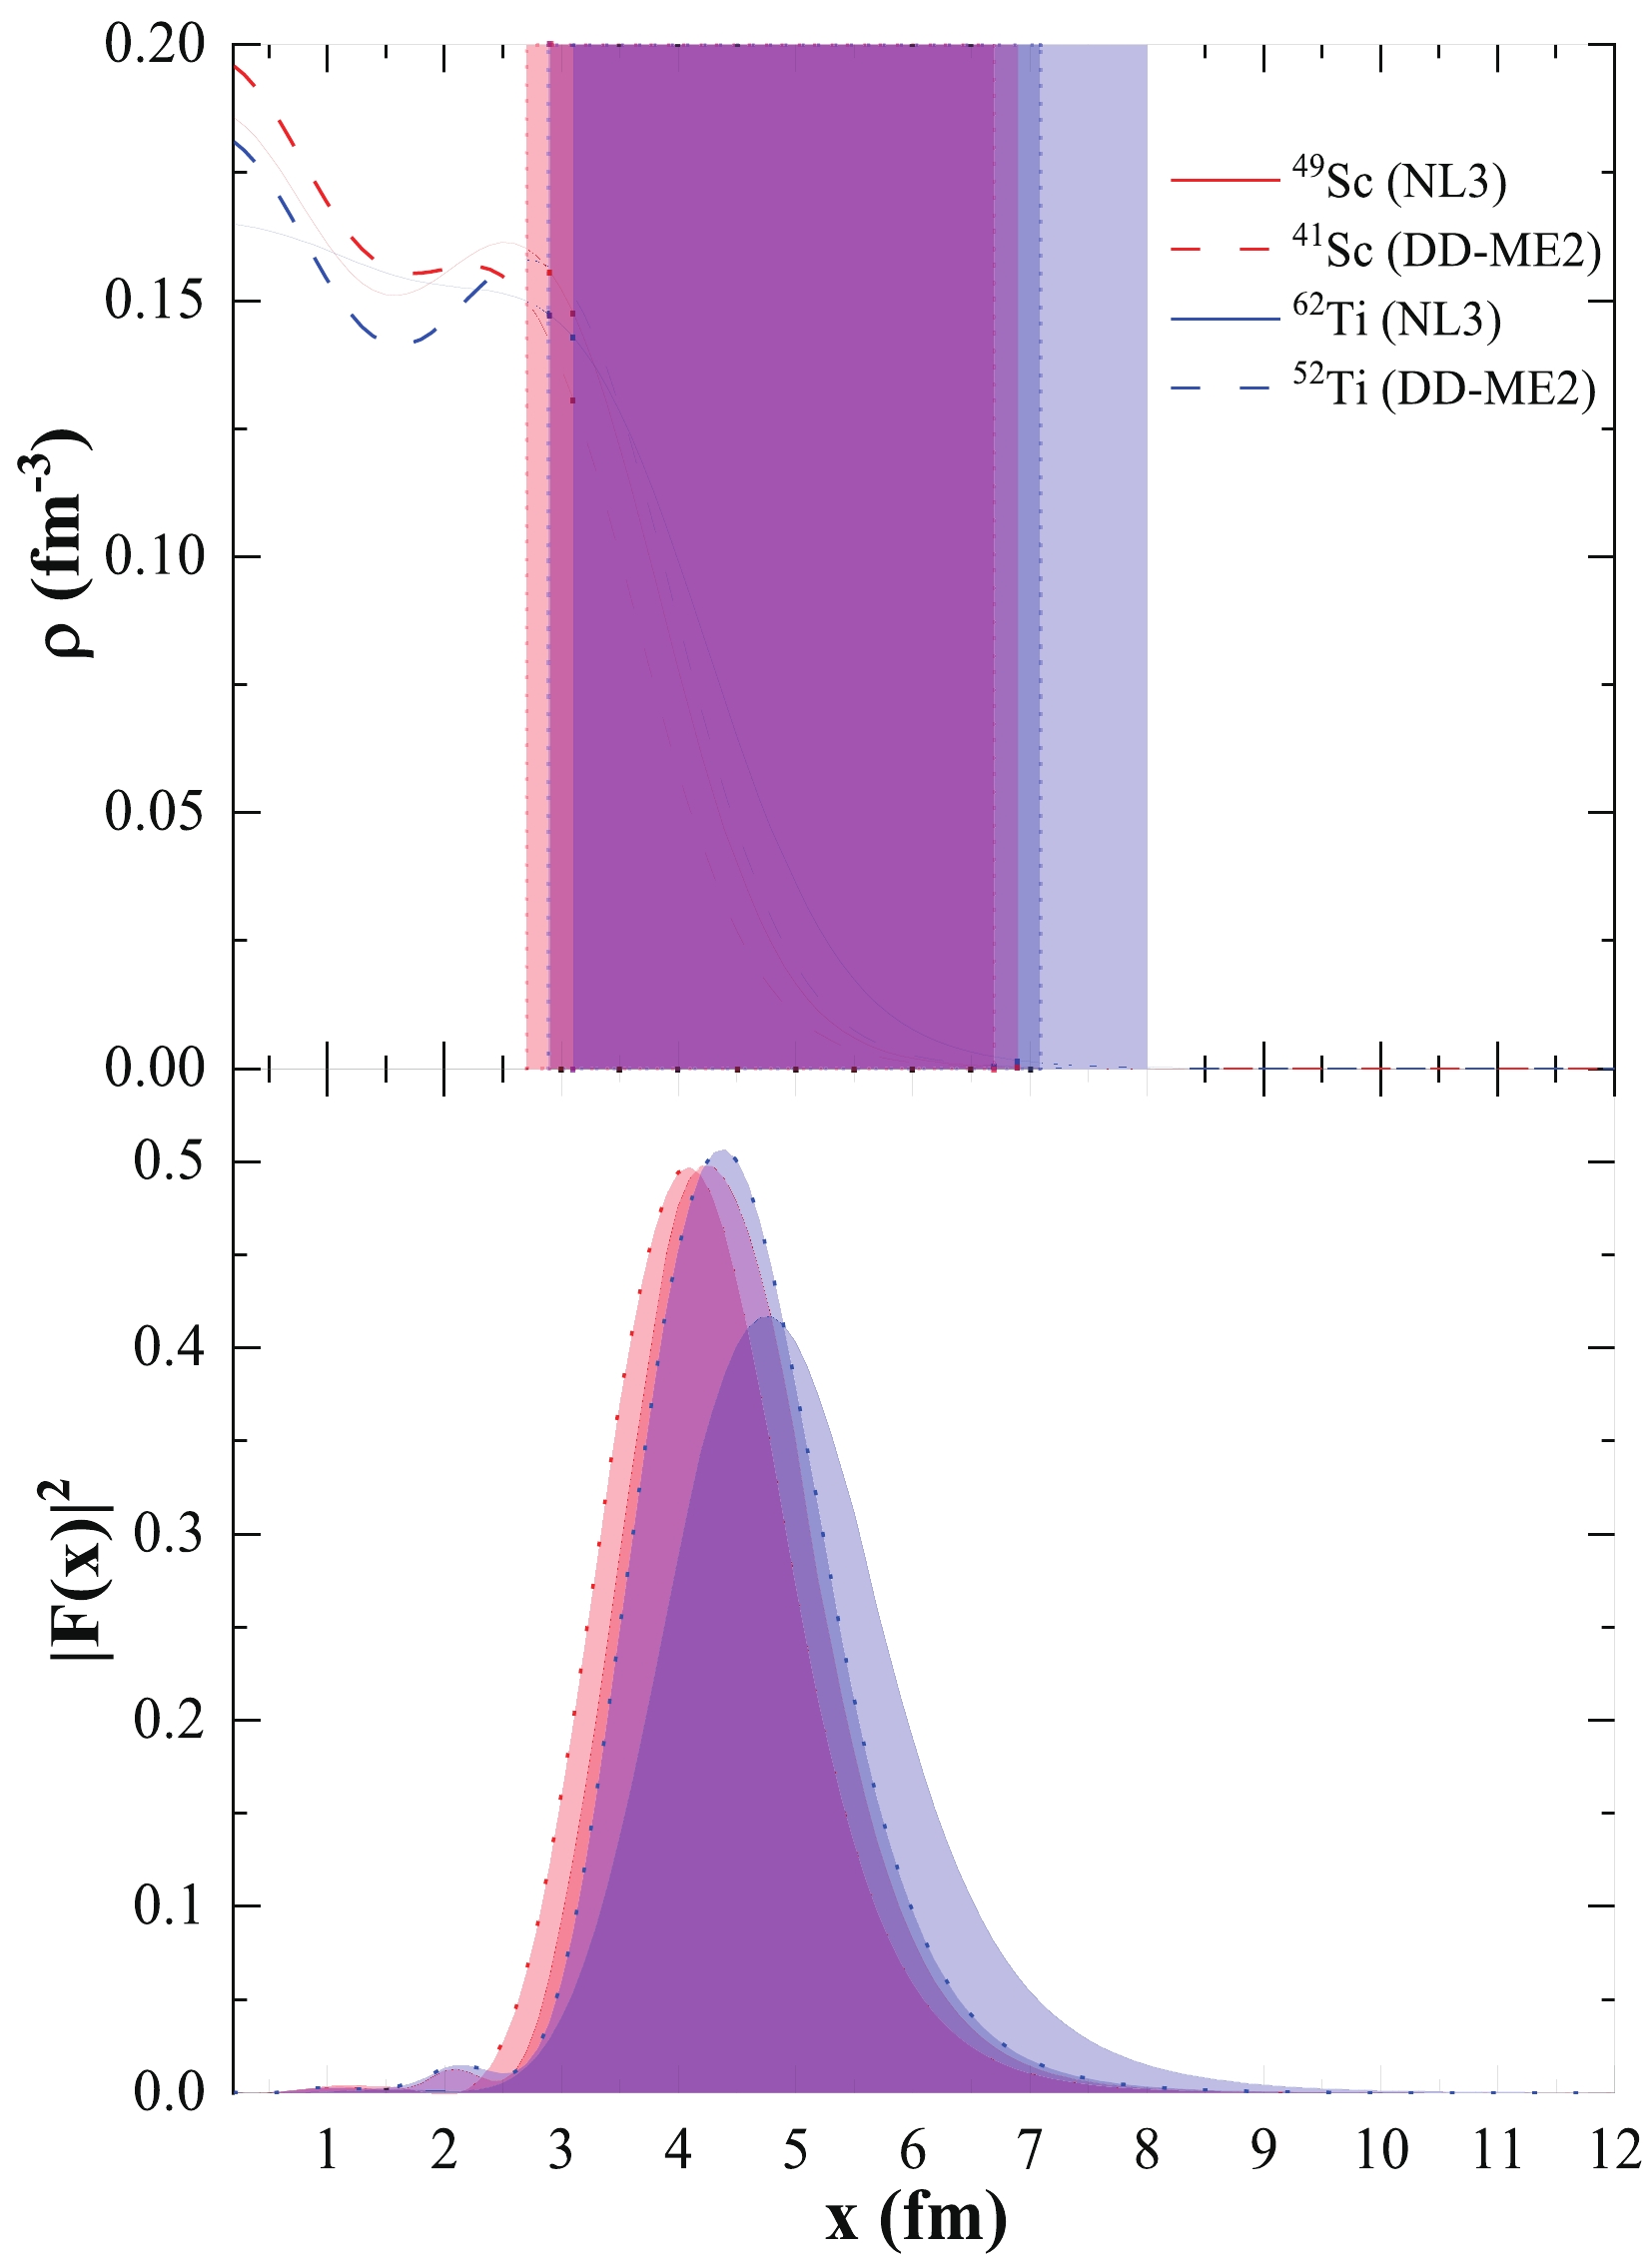
Figure 5. (color online) Total density distribution (upper panel) and corresponding weight function (lower panel) for 49Sc (NL3), 62Ti (NL3), 41Sc (DD-ME2), and 52Ti (DD-ME2) isotopes. See the text for details.
$ \vert {\cal{F}}(x) \vert^{2} $ in Eq. (8) has a bell-shaped form with a maximum value near$ x=R_{1/2} $ , where the density$ \rho (R_{1/2}) $ is approximately half the value of the central density$ \rho_{0} $ . In other words, the region surrounding$ \rho(R_{1/2}) = 0.5 \times \rho_{0} $ is nothing but the surface region of the nuclear matter density distribution. In principle, following Eq. (7), the integration limits are set from 0 to$ \infty $ . However, using the Brueckner energy density functional method, it is observed that symmetry energy has non-physical values in some regions. Hence, it is crucial to set proper limits on the integration, that is,$ x_{\rm min} $ and$ x_{\rm max} $ , where the symmetry energy at local density$ S^{NM}(x) $ changes from a negative to positive value and vice-versa, respectively. It must be noted that no point of$ S^{NM}(x) $ corresponding to a large x has been shown to change sign from positive to negative. Instead,$ S^{NM} (x) $ for large x tends to zero. Thus,$ x_{\rm max} $ is introduced in the right part of the weight function$ \vert {\cal{F}} (x) \vert^{2} $ , beyond which the contribution to symmetry energy (from$ x_{\rm max} $ to$ \infty $ ) is negligible. The estimated values of$ x_{\rm min} $ and$ x_{\rm max} $ for the specified isotopes of Sc- and Ti- for the NL3 (solid line) and DD-ME2 (dotted line) parameter sets are indicated by light red and light blue, respectively. It is worth mentioning that a considerable part of the weight functions attains a peak in the range corresponding to the surface region of the density distributions. This suggests the importance of the density surface contribution while calculating the symmetry energy; hence, these quantities are also known as surface properties. -
As we move across the nuclear landscape from the stability line toward the drip line, traditional observables fail to provide the relevant signature of shell and/or sub-shell closure. Symmetry energy, being a quantity dependent on isospin asymmetry, is one of the most critical properties capable of determining the magicity of nuclei near and beyond the drip-line region (Ref. [66] and references therein). Moreover, the symmetry energy coefficient of a nucleus can be described in terms of the coefficients of surface and volume symmetry energy [107]. In Ref. [75], it is observed that the volume-symmetry energy is a nearly shape-independent quantity, which infers that the surface effects do not affect the volume-symmetry energy. The surface effects become negligible for heavy mass nuclei because their surface symmetry energy coefficients are proportional to
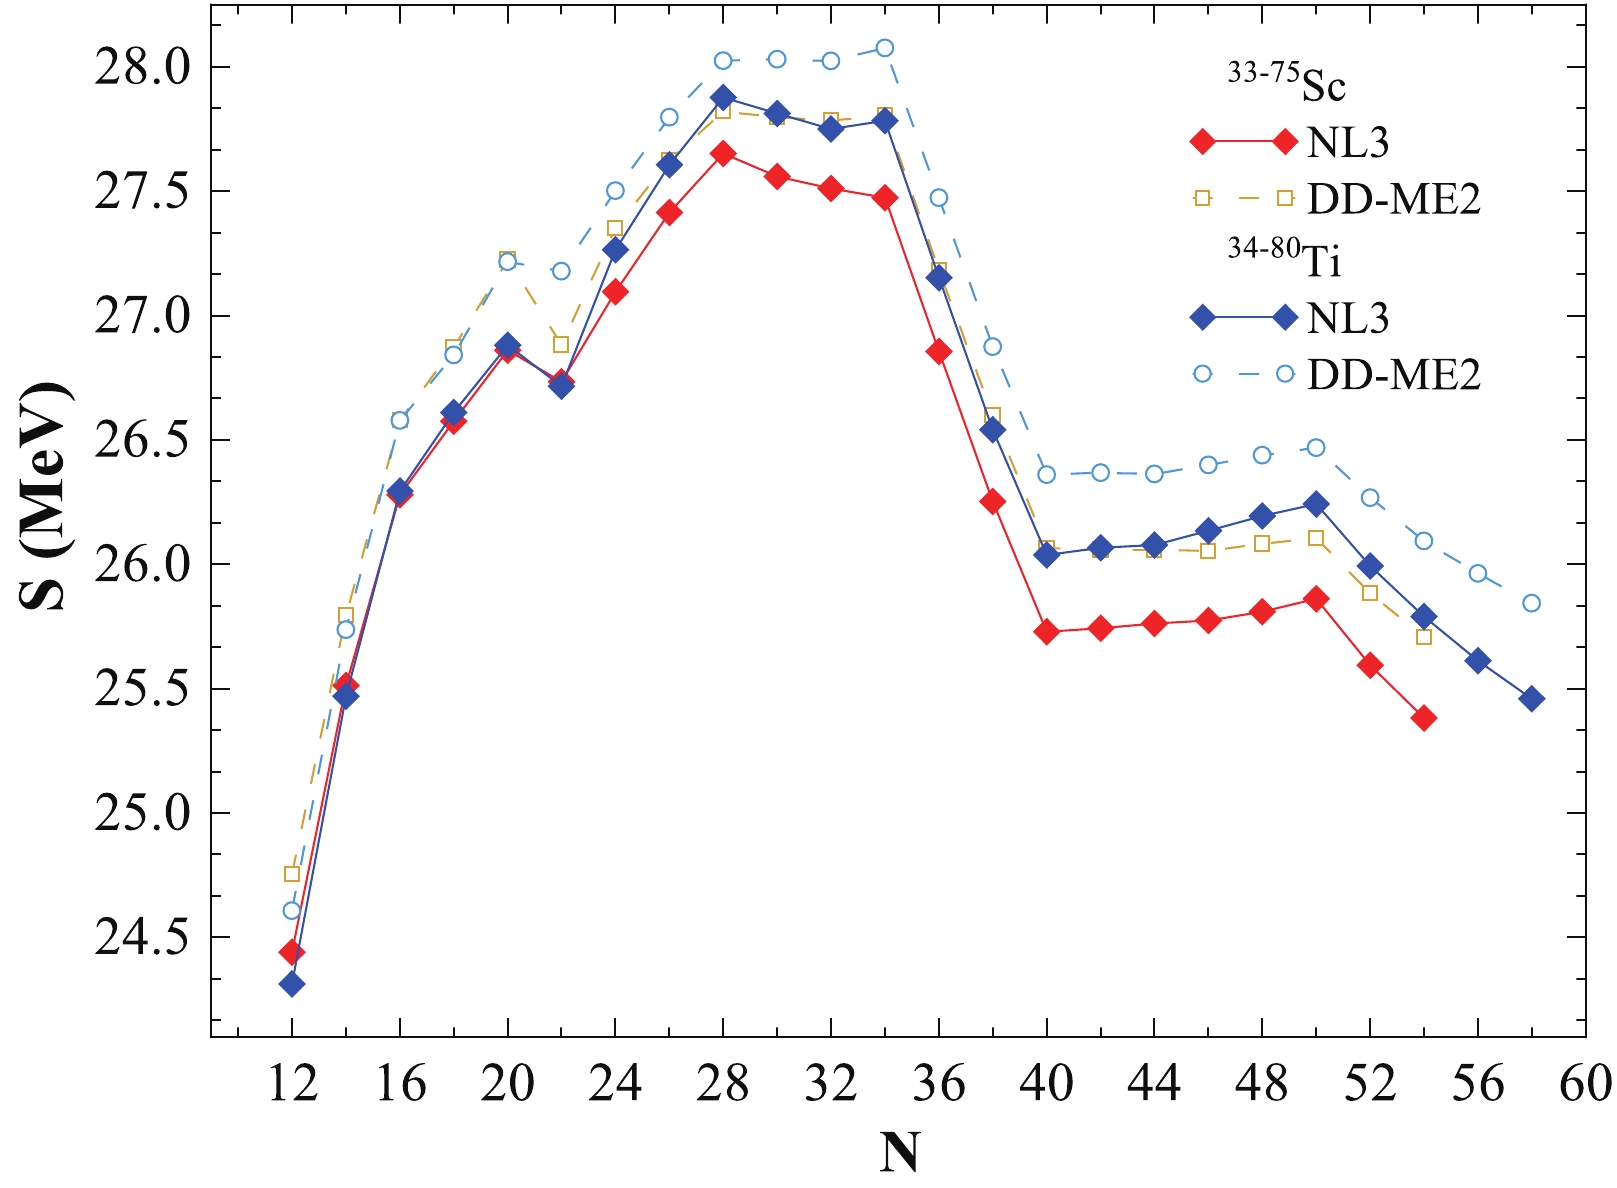
$ A^{-1/3} $ [74, 75]. Thus, the surface effects are significant for lighter nuclei and have little implication for larger mass nuclei. Taking deformations into account may provide better results. Recently, the effect of the deformation of finite nuclei on symmetry energy was reported using the theoretical Thomas–Fermi approximation over the Skyrme energy density functional [131], which highlights the effect of deformation on symmetry energy at local density decreasing with increasing mass number. Here, we also find that the relative change in symmetry energy is approximately 0.4 MeV for a relatively large value of$ \beta_{2} \approx 0.6 $ . Thus, we only consider the spherical densities of the isotopic chains of nuclei for computational ease in our calculations.The symmetry energy is calculated using Eq. (7) for the Sc- and Ti- isotopic chains with the non-linear NL3 and density-dependent DD-ME2 parameter sets. The results are shown in Fig. 6. As shown in the figure, numerous sharp discontinuities or kinks are observed at the neutron magic numbers corresponding to N = 20, 28, and 50, signifying shell/sub-shell closures for each isotopic chain. No signature of magicity are found for N = 40 on the isotopic chain of either nuclei. Relatively minor discontinuities are also observed at N = 34. These kinks indicate that these nuclei have higher stability at the magic neutron number than their surrounding isotopes in the corresponding isotopic chain of the nuclei. In other words, abnormalities observed in the symmetry energy curve suggest that additional energy would be needed to convert one neutron to a proton or vice versa. The symmetry energy S observed for the DD-ME2 parameter has a more consistently significant value than that of the NL3 parameter for both isotopic chains. Note that the nuclear matter symmetry energy for DD-ME2 typically has a higher magnitude than that for the NL3 parameter set. Hence, it shows that the surface contribution from DD-ME2 dominates the nuclear matter symmetry energy value in finite nuclei. As a result, we obtain a slightly more significant value of symmetry energy for DD-ME2 than NL3 for both isotopic chains at local density.
-
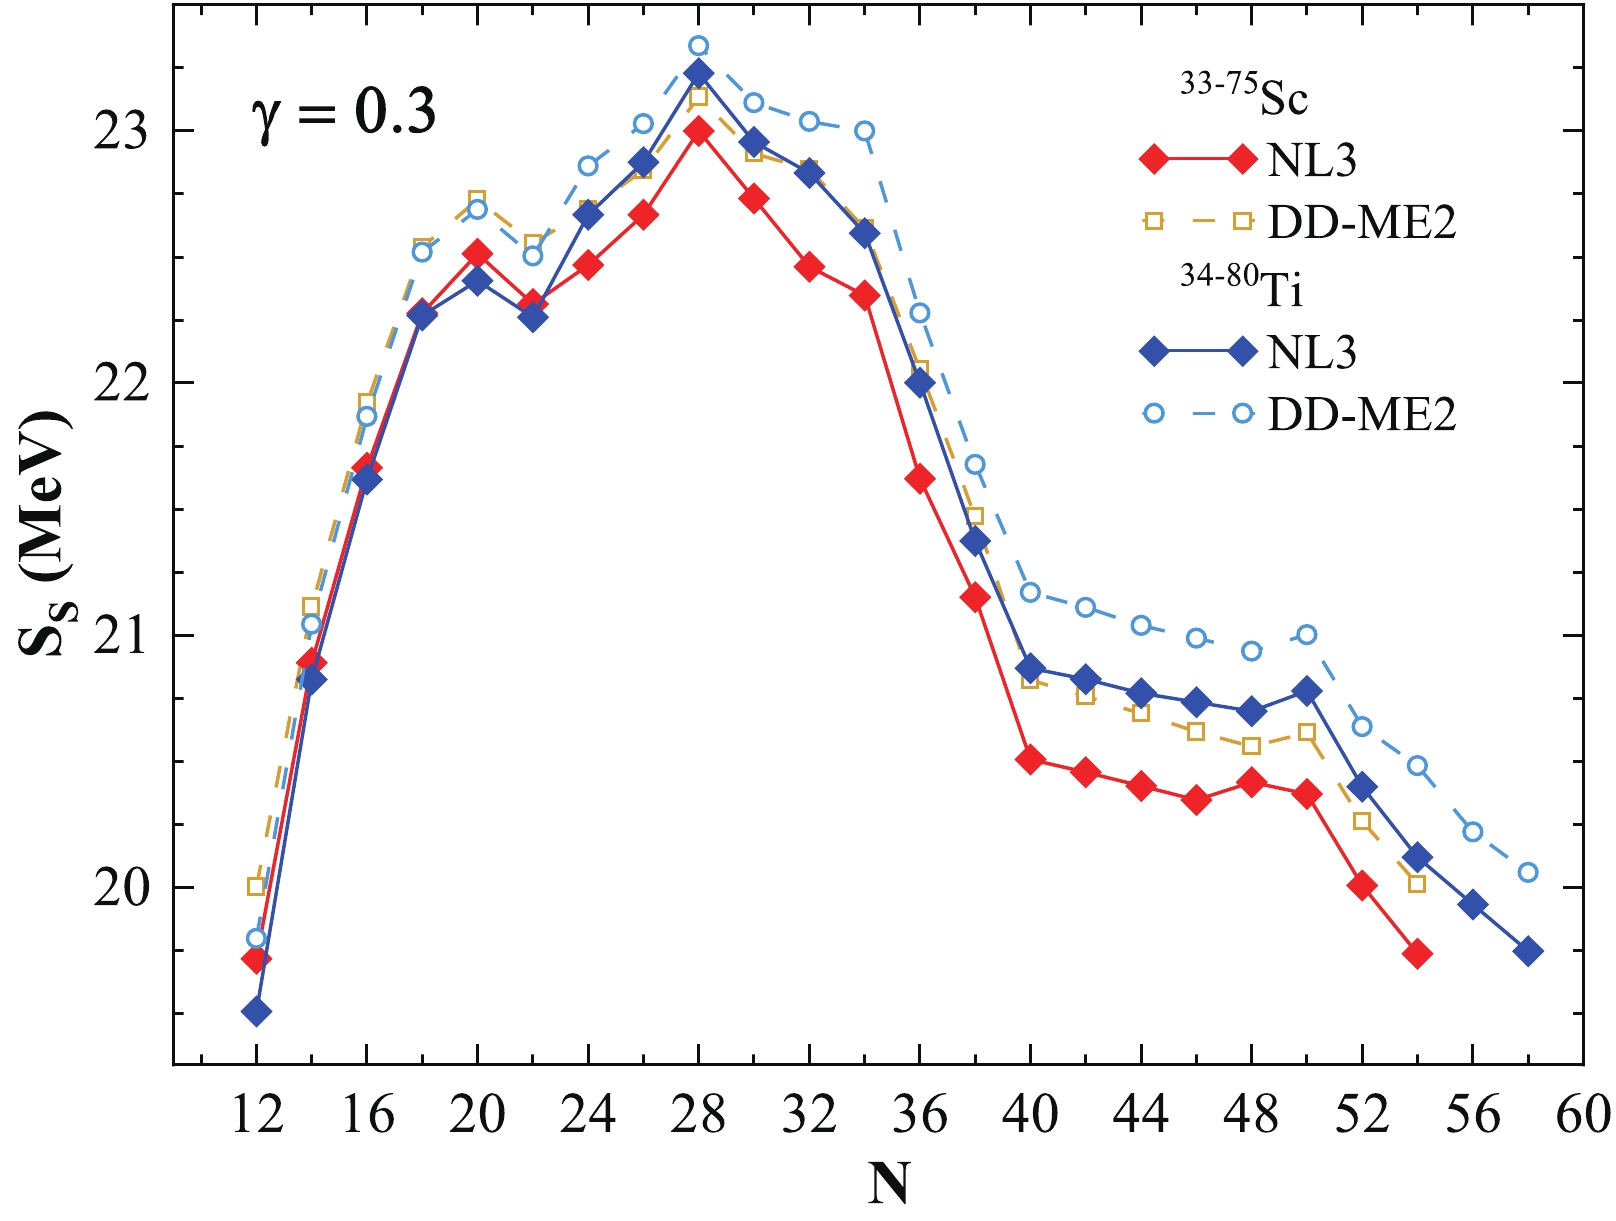
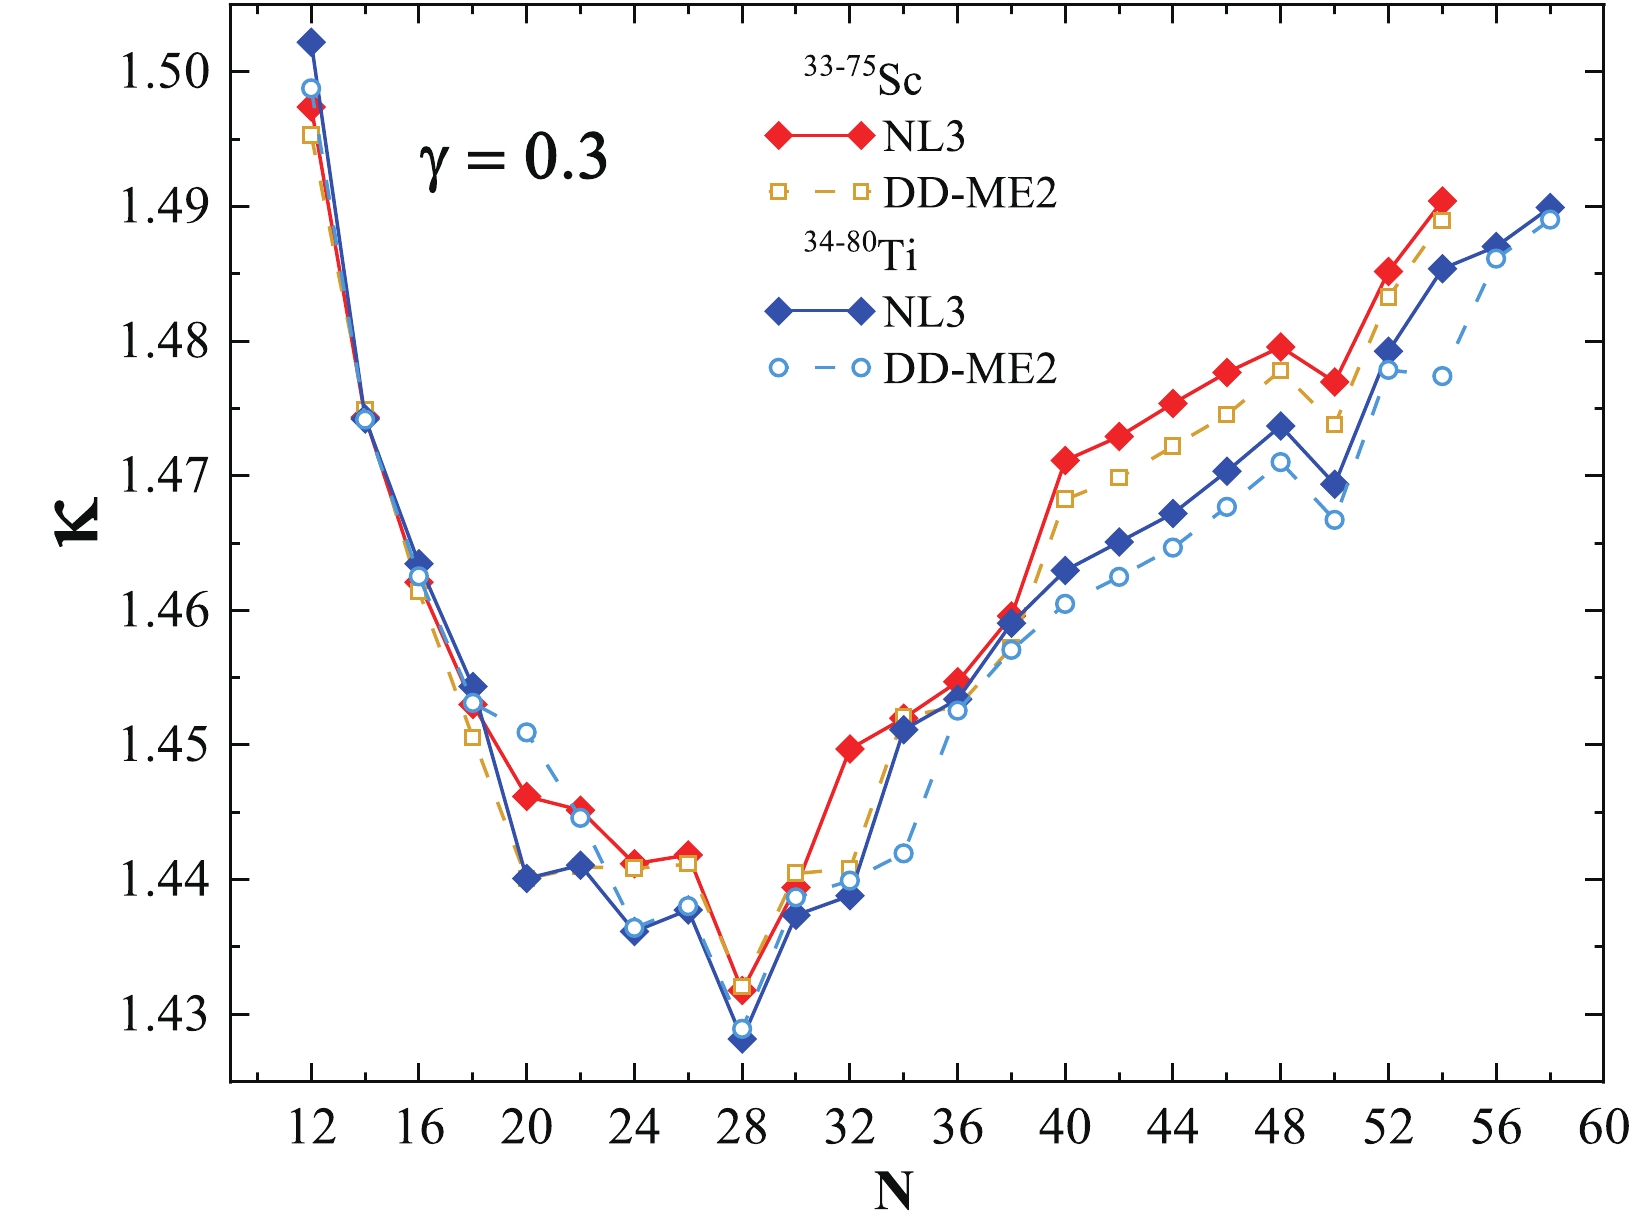
As discussed previously, the components of the symmetry energy of a nucleus can be represented in terms of the coefficients of surface and volume symmetry energy [107]. Here, we investigate the volume and surface symmetry energy and their ratio κ with respect to neutron number. We choose the value
$ \gamma=0.3 $ (see Eq. (11)) because the conditions enforced on the analyzed quantities at T=0 MeV are consistent with the available empirical predictions [83, 112, 113]. For$ \gamma = 0.3 $ , the calculated values corresponding to (i) the NL3 parameter set yields a symmetry energy value of 24.4$ \le S \le 27.9 $ MeV, a volume symmetry energy value of 29.5$ \le S_{ {\rm V}} \le 33.2 $ MeV, and a surface symmetry energy value of 19.7$ \le S_{ {\rm S}} \le 23.2 $ MeV and (ii) the DD-ME2 parameter set provides a symmetry energy value of 24.3$ \le S \le 28.1 $ MeV, a volume symmetry energy value of 29.3$ \le S_{ {\rm V}} \le 33.4 $ MeV, and a surface symmetry energy value of 19.5$ \le S_{ {\rm S}} \le 23.4 $ MeV. The values obtained using$ \gamma = 0.3 $ for S,$ S_{ {\rm V}} $ , and$ S_{ {\rm S}} $ are consistent with the predictions in Ref. [83].Plots of the different components of symmetry energy, namely the volume symmetry energy, surface symmetry energy, and their ratio (κ), for Scandium and Titanium isotopes within the non-linear NL3 and density-dependent DD-ME2 parameter sets are given in Figs. 7, 8, and 9, respectively. In all three figures, we can infer that a few sharp discontinuities/kinks are observed at neutron numbers corresponding to the traditional magic numbers N = 20, 28, and 50. Limited evidence for the neutron magic number at N = 40 is observed for both isotopic chains within both parameter sets. A minor kink is also noticed at neutron number N = 34, which is relatively small in magnitude compared with the relative change at N = 20, 28, and 50. It is worth mentioning that N = 34 is an experimentally identified neutron shell/sub-shell closure for this region [25]. In addition, we calculate the ratio of volume symmetry energy and surface symmetry energy, denoted as κ, which follow nearly the same pattern exhibiting considerable depth at N = 20, 28, and 50. These dips in the ratio of volume symmetry energy to the surface component of symmetry energy are consistent with the observed kinks in the symmetry energy.

Figure 7. (color online) Volume symmetry energy
$ S_{ {\rm V}} $ as a function of neutron number N for the NL3 and DD-ME2 interactions are given for the Sc and Ti isotopic chains. See the text for details. -
The density-dependence of symmetry energy is an effective source of uncertainty in the equation of state for asymmetric nuclear matter and is only reasonably constrained around the saturation density by the bulk properties of finite nuclei. At saturation, the density appears to be well correlated with the neutron-skin thickness
$ \Delta R_{np} $ in the finite nuclear system. Furthermore, recent studies (Ref. [66] and the reference therein) have shown the correlation of neutron-skin thickness with the surface properties of nuclei and the emergence of kinks at shell/sub-shell closure over an isotopic chain. We show the symmetry energy and its components, namely the volume and surface symmetry energy, along with their ratio κ as a function of neutron skin thickness ($ \Delta R_{np} $ ) for the Sc- and Ti- isotopic chains using the NL3 and DD-ME2 parameter sets in Fig. 10 (a), (b), (c), and (d). Note that the value of symmetry energy decreases with neutron number in either direction of the magic or semi-magic number on the isotopic chain. For example, we find a kink (depth) at N = 20, 28, 34, and 50 for the symmetry energy and its components over the isotopic chains of the Sc- and Ti- nuclei for both parameter sets, which further strengthens the above predictions. The appearance of a kink over an isotopic chain shows that the energy required to convert one proton-to-neutron is significantly greater for the shell or sub-shell closure isotope than its neighboring nuclei.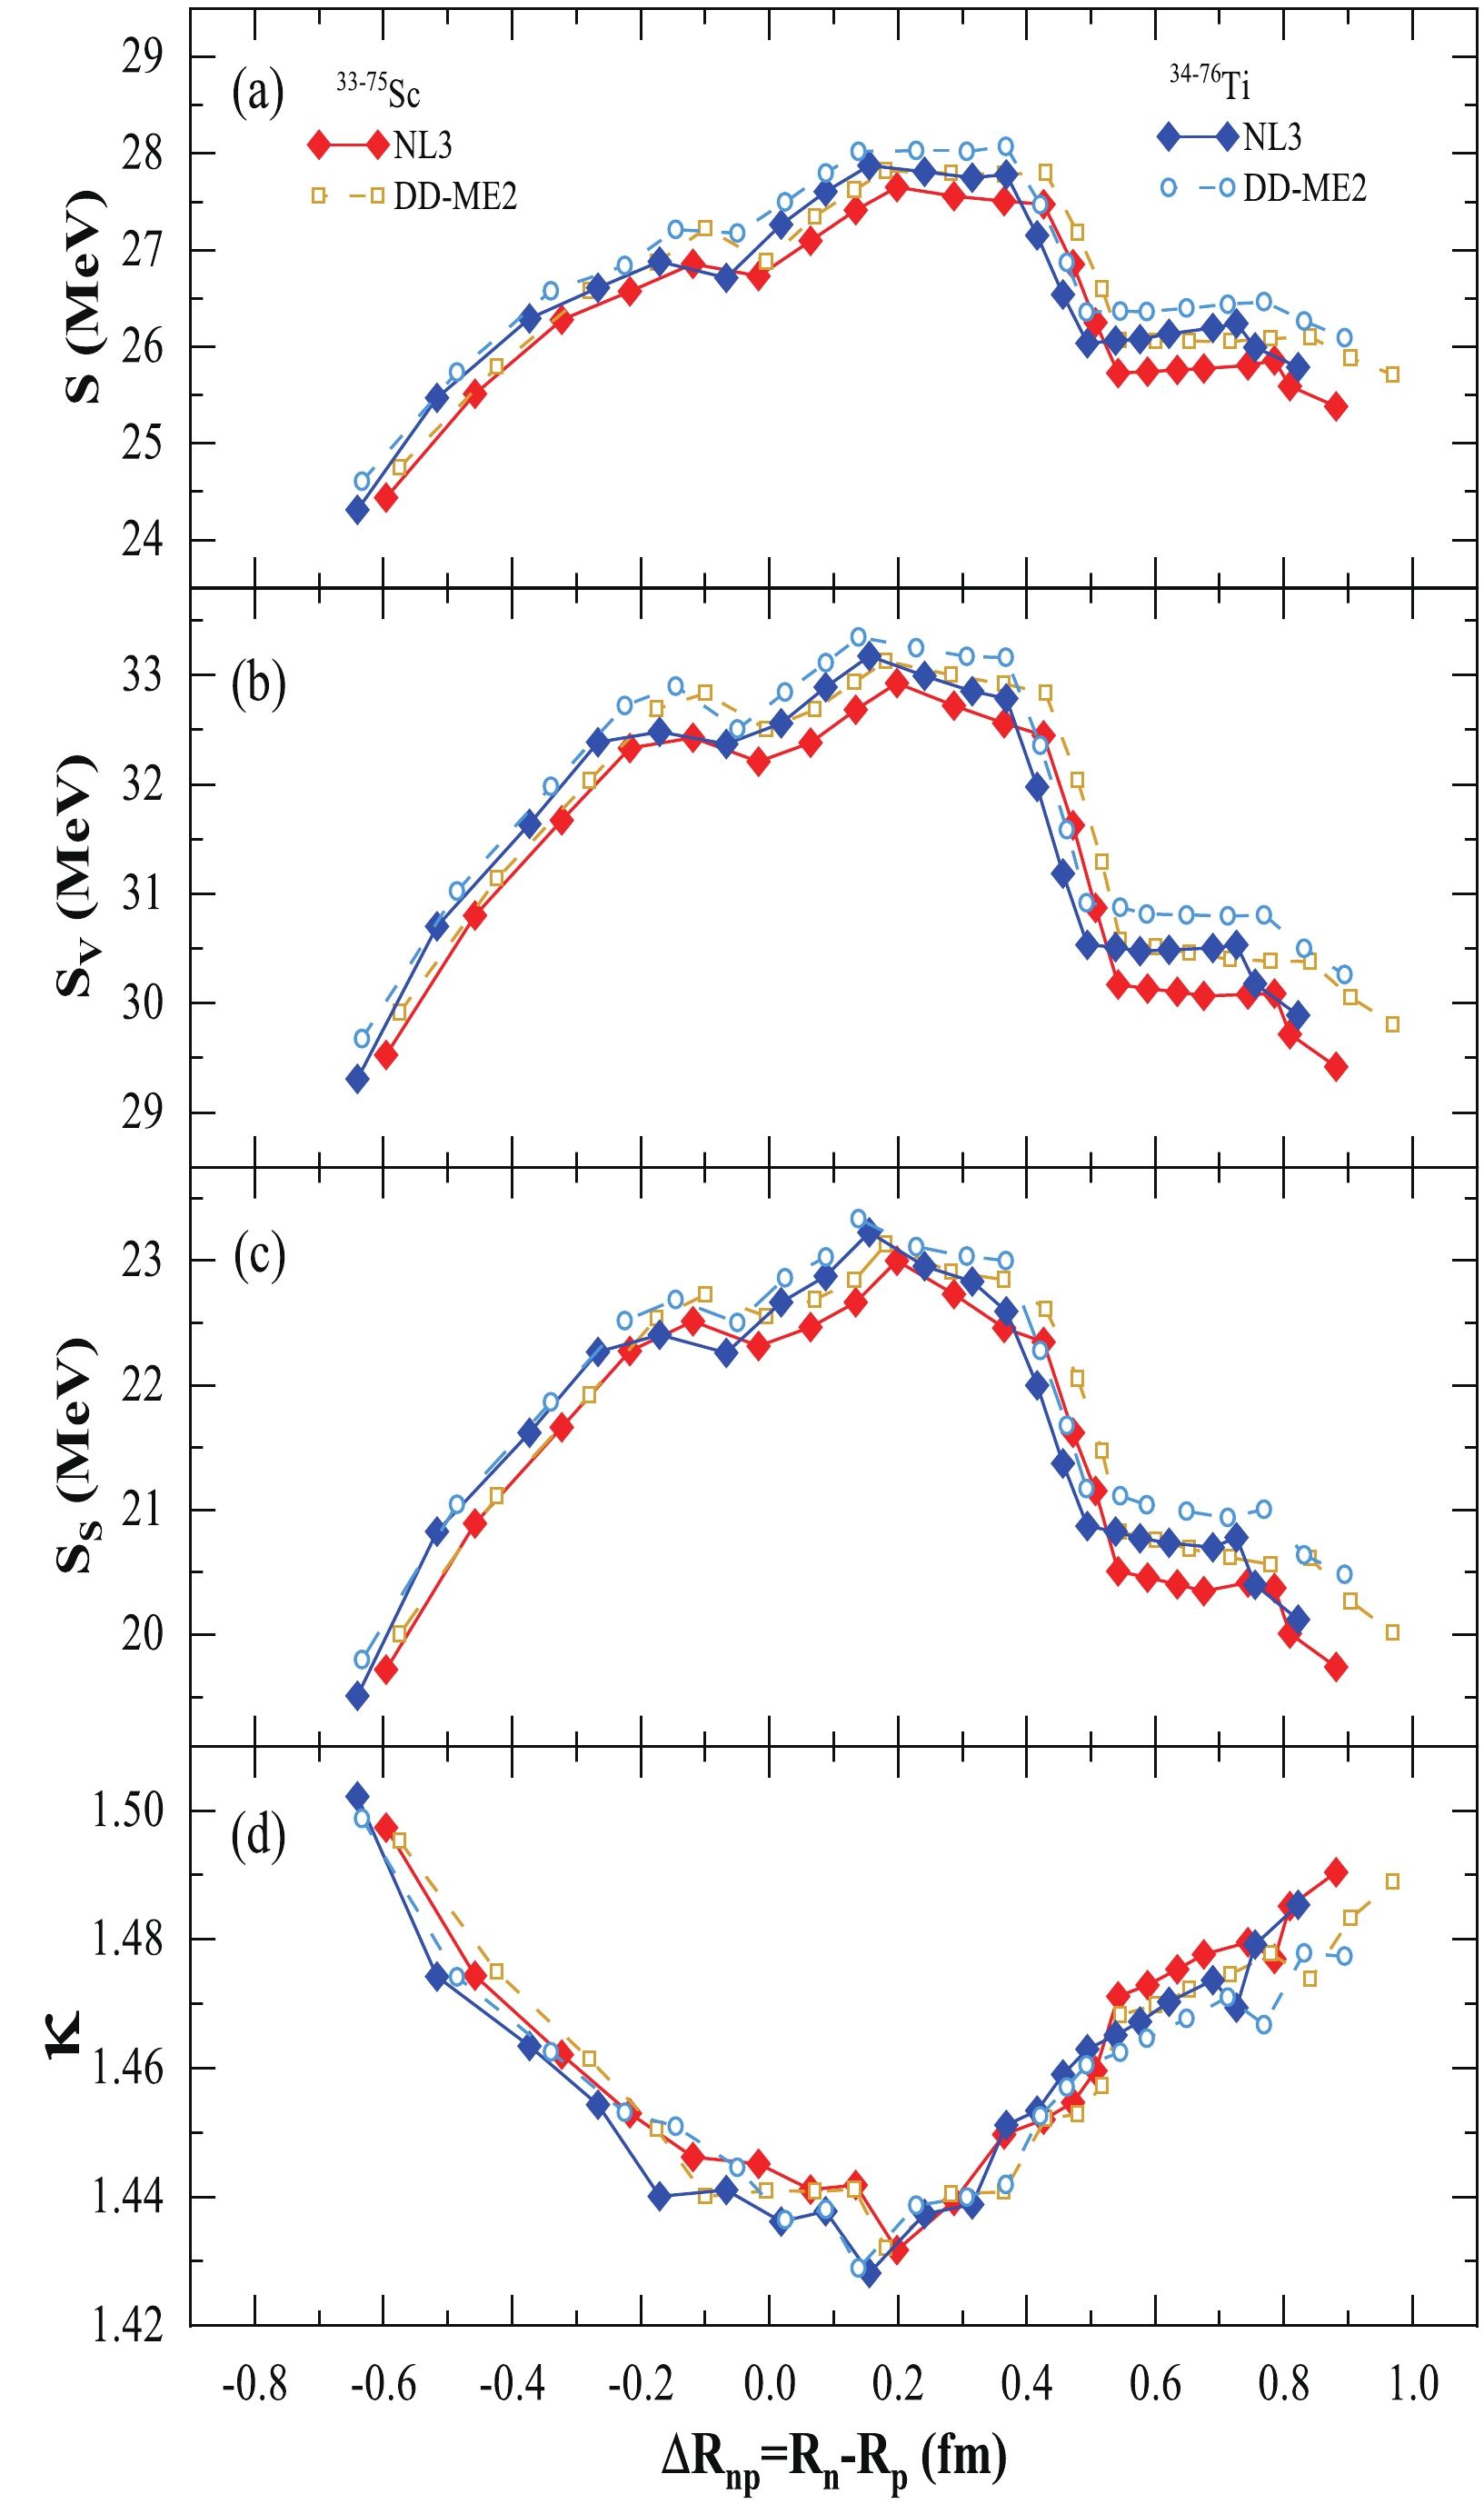
Figure 10. (color online) (a) Symmetry energy S, (b) volume symmetry energy
$ S_{ {\rm V}} $ , (c) surface symmetry energy$ S_{ {\rm S}} $ , and (d) their ratio κ for the isotopic chains of Sc- and Ti- nuclei as a function of neutron-skin thickness$ \Delta R_{np} $ for the NL3 and DD-ME2 parameter sets. See the text for details. -
In this study, we investigate symmetry energy along with its components for odd-A Scandium and even-even Titanium isotopic chains. The relativistic mean-field with non-linear NL3 and relativistic-Hartree-Bogoliubov approach with density-dependent DD-ME2 interaction parameter sets are employed. The coherent density fluctuation model is adopted to correlate the infinite nuclear matter quantities existing in momentum space to their corresponding finite nuclear quantities present in the coordinate space. We also probe ground state bulk properties, such as the binding energy (
$ B.E. $ ), rms charge radius ($ r_{\rm ch} $ ), quadrupole deformation ($ \beta_{2} $ ), two-neutron separation energy ($ S_{ {2n}} $ ), and differential variation in the two-neutron separation energy ($ {\rm d}S_{ {2n}} $ ), for a traditional structural analysis. Furthermore, we observe a shape transition from spherical to prolate for$ N \geq $ 44 and$ N \geq $ 40 for the Sc- and Ti- isotopic chains, respectively.Effective surface and isospin-dependent nuclear matter quantities, such as symmetry energy, volume, and surface components, are determined for finite nuclei at local densities. We find sharp discontinuities or kinks in the symmetry energy along with the volume and surface symmetry energy corresponding to the neutron numbers N = 20, 28, 34, and 50. It is worth mentioning that the signature/evidence of shell/sub-shell closure for the isotope corresponding to both N = 34 and 50 appears only in the isospin-dependent quantities, namely symmetry energy and its components, contrary to traditional observables. Again, this analysis strengthens the predictions of previous studies on various even-even nuclei based on different theoretical models in Refs. [12, 66, 79]. We find a narrow window of magicity at N = 40 for both isotopic chains. Furthermore, a minute signature of magicity/ shell closure appears at N = 34 for both the isotopic chain, which is consistent with experimental evidence in this region [25]. A quantitative comparison of the two parameters used shows that the magnitude of symmetry energy and its components for DD-ME2 is slightly greater than that of the NL3 parameter set for both isotopic chains, which is precisely the opposite of the saturation value of symmetry energy in infinite nuclear matter. Hence, in contrast with traditional observables, the isospin-dependent surface properties of nuclei, in terms of weight function, play a crucial role in the theoretical confirmation and prediction of new shell/sub-shell closures over the isotopic chains of finite nuclei at local density.
Isospin dependent properties of the isotopic chains of Scandium and Titanium nuclei within the relativistic mean-field formalism
- Received Date: 2022-01-07
- Available Online: 2022-08-15
Abstract: Density-dependent nuclear symmetry energy is directly related to isospin asymmetry for finite and infinite nuclear systems. It is critical to determine the coefficients of symmetry energy and their related observables because they hold great importance in different areas of nuclear physics, such as the analysis of the structure of ground state exotic nuclei and neutron star studies. The ground state bulk properties of Scandium (Z = 21) and Titanium (Z = 22) nuclei are calculated, such as their nuclear binding energy (


 Abstract
 HTML
HTML Reference
 Related
 PDF
PDF






 DownLoad: