-
Over the past several years, the study of relativistic compact objects has been gaining considerable interest in astrophysics and high-energy physics. Recent observations on some astrophysical compact objects such as 4U 1608-52, Her X-1, 4U 1538-52, and PSR J1614-2230 have shown that modeling such compact objects requires new approaches to explain their observed properties. The densities of interior matter of such compact objects are generally greater than the density of matter constituted by nucleons. Currently, at such high densities, the equaton of state (EoS) is unpredictable. Theoretically, the maximum mass and radius of these compact objects fall below those of neutron stars, whereas their compactness is greater than that of neutron stars. The estimation of the maximum mass of such ultra-compact objects is heavily dependent on the EoS. In relativistic astrophysics, one of the most important characteristic of compact objects is the maximum allowed mass. The maximum mass is crucial to determining the difference between neutron stars/quark stars and black holes in binaries. It is also very important in determining the outcome of different astrophysical phenomena, including the collapse of cores in supernova explosions and the merger of neutron stars in binaries. According to Rhoades and Ruffini [1], the maximum mass of a non-rotating neutron star can be as high as
$ 3.2\; M_{\odot} $ . Gondek-Rosińska et al. [2] considered an EoS with the linear form$ p=a(\rho-\rho_{0}) $ . Later, this was used by many investigators [3, 4] to obtain the maximum mass, and their result indicate a maximum mass of$ \approx 1.83\; M_{\odot} $ for a characteristic density of$ \rho_{0}=4B $ $(B=56\; {\rm MeV/fm}^{3})$ . Owing to a high density at the core region, such stars are believed to contain a significant amount of de-confined strange quark matter [5, 6]. Consequently, these stars are grouped in the new family known as strange stars ($ henceforth $ $ SS $ ). A quark-gluon plasma state may be formed from hadronic matter in a region in which temperature is very high or in the presence of a baryon chemical potential. Heavy-ion collisions [7] in the ultra-relativistic regime may create an environment to produce quark-gluon plasma. The formation of SSs is currently an open debate. An SS may form through several mechanisms. Zhang et al. [8] predicted that an SS may be formed when the spin of a neutron star ($ henceforth $ $ NS $ ) is reduced a few days after a super nova ($ henceforth $ $ SN $ ) explosion. Chatterjee et al. [9] suggested that because of a lower spin, NS rotational energy diminishes and the leftover ejecta from the SN overlap back onto the NS. This phenomenon eventually increases the density of the NS as it collapses, further fragmenting the NS into a soup of quarks consisting of u, d, and s quarks. Strange quark matter may also be formed [10–12] by the quark-hadron phase transition, which may occur during the time of the early universe or formation of an SS from an NS at ultra high densities. In terms of the stability [7] of quark matter, the three-flavored system (u, d, and s quarks) is more stable than the two-flavored system (u and d quarks) as the energy per baryon of the three-flavored system is less than that of the latter. Hence, a large amount of s quarks is necessary for the stability of quark matter. After Bodmer [11] and Witten's [12] hypothesis, considerable research has been conducted in this field assuming the MIT bag model for the strange matter with an EoS that is given by [13]:$ p_{r}=\frac{1}{3}(\rho-4B), $

(1) where B is the vacuum energy or, as is most commonly called, the bag constant. Bulk strange quark matter may be stable if the value of B lies within the specific range of
$ 145\; {\rm MeV} < B^{1/4}<162.8\; {\rm MeV} $ or equivalent to$ 57.5- 91.5 $ $\rm MeV/fm^3$ relative to iron [7], where the strong fine structure constant$ \alpha_{s} $ is assumed to be zero. If we consider a non-zero value of$ \alpha_{s} $ , this limit of B decreases [14].It is believed that at nuclear matter density
$ \rho\approx10^{15} gm/cc $ , the nature of matter in a star is anisotropic, as predicted first by Ruderman [15]. The distribution of anisotropic matter in the high-density regime can be explained by the presence of a type$ 3 $ A superfluid, which may exist in the solid core of compact objects [16]. Using quantum mechanics, type$ 3 $ A superfluidity can be described macroscopically, which is a prominent characteristic of$ 3 $ A superfluids. Nucleons are Fermi particles and they attempt to avoid themselves owing to the Pauli exclusion principle. At a very short range, strong nucleon-nucleon interaction exists, which is also repulsive. These repulsive forces at a very short range are responsible for the required pressure to overcome the inward pull of strong gravity in a massive neutron star, hence stopping it from gravitational collapse. However, at very low temperatures, cooper pairs [17] may be formed by these nucleons. These pairs are bosons by nature and exhibt a collective behaviour on a very large scale. Such a condensate form of nucleons may flow without viscous drag, which is analogous to the superfluid He-3. As the pressure in a neutron star is significantly high, nuclear superfluidity may exist in the presence of a high temperature of the order of a billion degrees. At least three different types of superfluids are considered to exist in a neutron star [18]. In a neutron/strange star, anisotropy may also occur owing to different types of phase transitions [19], pion condensation [20], etc. A slow rotation [21] may also produce anisotropic distribution of matter inside a compact object. In this context, Bowers and Liang [22] showed that anisotropy has significant effects on mass and surface redshift. Some recent theoretical studies have also predicted that pressure is not ideally isotropic in a compact object, [23–29]. Pressure may be decomposed into two different parts at all internal points except at the center ($ r=0 $ ): (i) radial pressure$ (p_{r}) $ and (ii) transverse pressure$ (p_{t}) $ . The difference between them ($ \Delta=p_{t}-p_{r} $ ) is assumed to be a measure of the pressure anisotropy. The anisotropic force is defined by the term ($ \dfrac{2\Delta}{r} $ ). It is repulsive when$ \Delta > 0 $ and attractive when$ \Delta < 0 $ . However, for anisotropic compact objects, research has shown that [30] the repulsive nature of force aids in the formation of the structure of such objects.In recent years, considerable research has been conducted on the extension of general relativity to higher dimensions. Historically, Kaluza and Klein [31, 32] independently introduced the concept of higher dimensions to unify gravity with electromagnetic interaction. The consistent formalism of many important theories related to the interaction of particles in high energy physics required more than conventional four dimensions. Subsequently, various cosmological models have been built in the context of higher dimensions [33], which may undergo spontaneous compactification that results in a combined space
$ {M^4}\times{M^d} $ , where$ M^d $ is the compact inner space. The structure of the present day universe has been satisfactorily described by such cosmological models. Randall and Sundrum [34] predicted a new approach in higher dimensions for the gravity in the low-energy regime. They showed that Newtonian gravity in four dimensional space-time may be considered a special case of the more general five dimensional anti-de sitter space-time$ (AdS_{5}) $ approach. Thus, the four dimensional models in higher dimensional theories are generalized to describe some of the physical phenomena. In this context, different theories of black holes [35–42] have been generalized. A higher dimensional form of the Schwarzschild geometry was obtained by Shen and Tan [43]. Many investigators have also generalized theories in higher dimensions for relativistic compact objects [44–49]. In the modeling of neutron stars/quark stars, the inclusion of extra dimensions in the theories plays an important role in predicting the mass and radius as the stars are observed to be more compact in higher dimensions than in the conventional four dimensions. Therefore, in higher dimensions, more mass can be accommodated within the same radius, or the same mass can be accommodated within a lower radius.In relativistic astrophysics, the coupled Einstein-Maxwell system of equations has gained considerable interest in the study of charged stars. A star may comprise a non-vanishing amount of net charge. This was first predicted by Rosseland [50]. According to Rosseland, a star may be considered a collection of electrons and positive ions. He concluded that electrons may have greater tendency to escape from the star than ions because electrons have a greater amount of kinetic energy. Thus, we may consider that a star contains a significant amount of positive charge. This phenomenon will continue until an electric field in set up in the star to stop the further escaping of electrons. Zakharov et al. [51] predicted that the charge (Q) contained within a black hole by may be predicted by observing its shadow size. Ivanov [52] first showed that to avoid singularity, a perfect fluid should be charged. According to Bonnor [53], a compact object can maintain the equilibrium condition through a Coulomb repulsive force owing to the charge against the gravitational collapse, and the stellar structure becomes more stable in presence of a charge. Stettner [54] established that a uniform density star is more stable in the presence of a charge than a star without a charge. Krasinski [55] predicted that a net charge is required to stop the collapse of spherical distribution of matter under inward gravitational pull towards a point singularity. Ivanov [52] and Sharma et al. [56] extensively demonstrated that the values of luminosity, maximum mass, radius, and surface redshift of a compact object are adversely affected by the presence of a charge. Vaidya and Tikekar [57] and Tikekar [58] suggested a metric function for the
$ g_{rr} $ component, which is a functional form of the radial coordinate r and also depends on two parameters. These parameters are known as (i) spheroidal (λ) and (ii) curvature (R) parameters. Such a type of metric ansatz implies that the physical 3-space of the interior matter of a star has the geometry of a 3-spheroid embedded in a conventional Euclidean space of four dimensions. Using this ansatz, Maharaj and Leach [59], Mukherjee et al. [60], Gupta and Jassim [61], and Paul [44, 62] studied the physical features of compact objects in spheroidal geometry. The properties of charged spheroidal stars have been thoroughly discussed by Sharma et al. [56] and Gupta and Kumar [63]. Thomas et al. [64] discussed the modeling of core-envelope structures in the presence of a charge. Later, Tikekar and Thomas [65] suggested a new ansatz that is also represented by the parameters λ and R but they considered that the interior physical 3-space of a star has the geometry of a 3-pseudo spheroid embedded in four-dimensional Euclidean space. Using this ansatz, Tikekar and Thomas [66] and Paul and Tikekar [67] studied the core-envelope models of compact objects. Tikekar and Jotania [68] observed a new class of solutions of relativistic compact objects in four dimensions considering pseudo-spheroidal geometry. Later, Chattopadhyay and Paul [69] extended the work into higher dimensions and determined new solutions for an isotropic compact object. Charged stars in the Vaidya-Tikekar model have been rigorously studied by many authors [70–72].In this paper, we investigate the relativistic solution of higher dimensional charged compact objects in the presence of pressure anisotropy considering the pseudo-spheroidal geometry of the
$ g_{rr} $ metric component. Our main objective is to study physical properties such as maximum mass, prediction of radius, and surface redshift of strange quark stars in the presence of charges and anisotropy in higher dimensions considering the EoS of interior matter as prescribed by the MIT bag-model EoS, in which the bag constant varies between 57.5–91.5$ {\rm MeV/fm}^3$ required for stable quark matter at zero external pressure relative to iron [7].We have organized our paper as follows: In Sec. II, we use the Tikekar-Thomas ansatz to determine the required solutions of the Einstein Maxwell field equations for an anisotropic charged fluid sphere in higher dimensions. In Sec. III, we determine the physical parameters of a charged compact star. In Sec. IV, we examine the mass-radius relation of a compact object. We also study the maximum mass and surface redshift of a stellar configuration. The physical features of some compact objects are analyzed and the fulfilment of all energy conditions are studied in Sec. V. In Sec. VI, we study the stability of compact objects in this model. Lagrange’s perturbation in radial pressure is also considered in Sec. VII. The tidal Love number and tidal de-formability are discussed in Sec. VIII. We conclude the paper by discussing the major outcomes in Sec. IX.
-
The line element for a spherically symmetric object and static space-time in higher dimensions is given by
$ \begin{array}{*{20}{l}} {\rm d}s^2=-{\rm e}^{2\nu(r)}{\rm d}t^2+{\rm e}^{2\mu(r)}{\rm d}r^2+r^2{\rm d}{\Omega^2_{n}}, \end{array} $

(2) where
$ n=D-2 $ . Here, D represents the total number of space-time dimensions, and${\rm d}{\Omega^2_{n}}={\rm d}{\theta_{1}}^2+\sin^2\theta_{1}{\rm d}{\theta_{2}}^2+ \sin^2\theta_{1}\sin^2\theta_{2}{\rm d}{\theta_{3}}^2+...+(\sin^2\theta_{1}\sin^2\theta_{2}... \sin^2\theta_{n-1}){\rm d}{\theta^2_{n}}$ represents the angular part of the line element in n spheres. Unknown metric functions$ \mu(r) $ and$ \nu(r) $ given in Eq. (2) must be evaluated from the boundary conditions. In higher dimensional theory, the Einstein's field equations can be expressed as follows:$ {\boldsymbol R}_{ij}-\frac{1}{2}g_{ij}{\boldsymbol R}=8\pi G_{D}{\boldsymbol T}_{ij}, $

(3) where
${\boldsymbol R}_{ij}$ and${\boldsymbol R}$ are the Ricci tensor and scalar, respectively.${\boldsymbol T}_{ij}$ is the energy-momentum tensor of the interior matter. The indices i and j have the values of$0,1,2,...,n+1$ .$ G_{D}=GV_{n-2} $ is the gravitational constant in higher dimensions. The term G signifies the Newtonian gravitational constant in four dimensions, and$ V_{n-2} $ denotes the volume of extra space. For an anisotropic charged fluid sphere, the interior energy-momentum tensor may be expressed as$ \begin{array}{*{20}{l}} {\boldsymbol T}_{ij}=diag(-(\rho+E^{2}), p_{r}-E^{2}, p_{t}+E^{2},........., p_{t}+E^{2}), \end{array} $

(4) where ρ,
$ p_r $ ,$ p_t $ , and$ E^2 $ represent the energy density, radial pressure, tangential pressure, and electric field, respectively.$ p_t-p_r = \Delta $ can be accounted as pressure anisotropy.$ \Delta=0 $ at the center ($ r=0 $ ) of the star, and it reaches maximum value at the surface ($ r=b $ ). At any intermediate point interior to the star, Δ will be a function of$ \mu(r) $ and$ \nu(r) $ . Now, using Eqs. (2) and (4) in Eq. (3), Einstein's field equation provides the following equations:$ \frac{n{\rm e}^{-2\mu}\mu^{\prime}}{r}+\frac{n(n-1)}{2r^2}(1-{\rm e}^{-2\mu})=8\pi G_{D}\rho+E^{2}, $

(5) $ \frac{n{\rm e}^{-2\mu}\nu^{\prime}}{r}-\frac{n(n-1)}{2r^2}(1-{\rm e}^{-2\mu})=8\pi G_{D}p_{r}-E^{2}, $

(6) $ \begin{aligned}[b] &{\rm e}^{-2\mu}\left[\nu^{\prime\prime}+{\nu^{\prime}}^2-\mu^{\prime}\nu^{\prime}-\frac{(n-1)(\mu^{\prime}-\nu^{\prime})}{r}\right] \\ &\quad-\frac{(n-1)(n-2)}{2r^2}(1-{\rm e}^{-2\mu})=8\pi G_{D}p_{t}+E^{2}. \end{aligned} $

(7) From Eqs. (6) and (7), we obtain the values of radial pressure (
$ p_r $ ) and tangential pressure ($ p_t $ ), respectively, for known values of$ \mu(r) $ and$ \nu(r) $ . Now, using the relation$ p_t-p_r = \Delta $ and Eqs. (6) and (7), we obtain the following equation:$ \begin{aligned}[b] &{\rm e}^{-2\mu}\left[\nu^{\prime\prime}+\nu^{\prime2}-\mu^{\prime}\nu^{\prime}-\frac{(n-1)(\mu^{\prime}-\nu^{\prime})}{r}\right]\\&\quad-\frac{(n-1)(n-2)}{2r^{2}}(1-{\rm e}^{-2\mu}) \\ &\quad-\frac{n{\rm e}^{-2\mu}\nu^{\prime}}{r}+\frac{n(n-1)}{2r^2}(1-{\rm e}^{-2\mu})-2E^{2}=8\pi G_{D}\Delta. \end{aligned} $

(8) Using Eq. (8), we can obtain the value of
$ \nu(r) $ if$ \mu(r) $ is known. From the values of$ \mu(r) $ and$ \nu(r) $ , we can evaluate the internal structure of a compact object. In this paper, we follow the Vaidya-Tikekar [57] approach to simplify Eq. (8). Here, we have assumed the functional form of$ \mu(r) $ depending on the radial coordinate prescribed by Tikekar [58], which is$ {\rm e}^{2\mu}=\frac{1+\lambda\dfrac{r^2}{R^2}}{1+\dfrac{r^2}{R^2}}, $

(9) where λ is a free parameter also known as the spheroidal parameter, and R is the curvature parameter that can be determined from the known values of stellar mass
$ (M) $ and radius$ (b) $ . The choice of this type of metric function for μ is physically realistic as it satisfies all the necessary physical criteria as extensively studied by Delgaty and Lake [73]. Substituting Eq. (9) in Eq. (8) and using the transformations$\psi={\rm e}^{\nu(r)}$ and$ x=\sqrt{1+\dfrac{r^2}{R^2}} $ , we can establish the differential equation in terms of x as follows:$ \begin{aligned}[b] &\left[1+\lambda(x^2-1)\right]\psi_{xx}-\lambda x\psi_{x}+(n-1)\lambda(\lambda-1)\psi\\&\quad-2E^{2}R^{2}\frac{[1+\lambda(x^2-1)]^2}{(x^2-1)}\psi \\ &\quad-8\pi G_{D}\Delta R^2\frac{[1+\lambda(x^2-1)]^2}{(x^2-1)}\psi=0. \end{aligned} $

(10) In this paper, we have selected the anisotropy parameter Δ and
$ E^{2} $ as follows:$ \Delta=\frac{\beta\lambda^{2}(x^2-1)(n-1)}{8\pi G_{D}R^2[1+\lambda(x^2-1)]^2}, $

(11) $ E^{2} = \frac{{\alpha^{2}}(x^{2}-1)}{R^{2}[1+{\lambda}(x^{2}-1)]^2}, $

(12) where α and β are two constants to parametrize
$ E^2 $ and Δ, respectively. Such a choice of Δ and$ E^2 $ is performed to maintain the regularity at the center of the star and to make Eq. (10) tractable. Using the transformation$ z=\sqrt{\dfrac{\lambda}{\lambda-1}}x $ and substituting the values of Δ and$ E^2 $ from Eqs. (11) and (12), respectively, in Eq. (10), we can simplify Eq. (10) as$ \begin{array}{*{20}{l}} (1-z^2)\psi_{zz}+z\psi_{z}+(\Omega^{2}-1)\psi=0, \end{array} $

(13) where
$ \Omega^{2}=n+\dfrac{2\alpha^{2}}{\lambda}-\lambda(n-1)(1-\beta) $ . Equation (13) can be differentiated further with respect to z, and we can obtain the following relation:$ (1-z^2)\frac{{\rm d}^{3}\psi}{{\rm d}z^{3}}-z\frac{{\rm d}^2\psi}{{\rm d}z^2}+\Omega^{2}\frac{{\rm d}\psi}{{\rm d}z}=0. $

(14) Now, using
$y=\dfrac{{\rm d}\psi}{{\rm d}z}$ , Eq. (14) can be expressed as$ (1-z^2)\frac{{\rm d}^{2}y}{{\rm d}z^{2}}-z\frac{{\rm d}y}{{\rm d}z}+\Omega^{2}y=0. $

(15) Using the transformation
$z={\rm cosh}\; \xi$ in Eq. (15), we obtain$ \frac{{\rm d}^{2}y}{{\rm d}\xi^{2}}-\Omega^{2}y=0. $

(16) Depending on the sign of
$ \Omega^{2} $ , the general solution of Eq. (16) can be obtained for two different cases as follows:● Case i:
$ \lambda(n-1)(1-\beta) > n+\dfrac{2\alpha^{2}}{\lambda} $ In this case,
$ \Omega'=\sqrt{\lambda(n-1)(1-\beta)-(n+\dfrac{2\alpha^{2}}{\lambda})} $ is positive, and we obtain$ \frac{{\rm d}^{2}y}{{\rm d}\xi^{2}}-\Omega^{\prime2}y=0. $

(17) The solution of this is given by
$y=\dfrac{{\rm d}\psi}{{\rm d}z}= a_{1}{\rm cos}(\Omega^{\prime}\xi)+ a_{2}{\rm sin}(\Omega^{\prime}\xi)$ . Therefore, the solution of Eq. (15) for this particular case is obtained as$ \begin{aligned}[b] \psi =&A[\Omega^{\prime}\sqrt{z^2-1}\; {\rm cos}(\Omega^{\prime}\xi)-z\; {\rm sin}(\Omega^{\prime}\xi)] \\ &+B[\Omega^{\prime}\sqrt{z^2-1}\; {\rm sin}(\Omega^{\prime}\xi)+ z\; {\rm cos}(\Omega^{\prime}\xi)]. \end{aligned} $

(18) ● Case ii:
$ \lambda(n-1)(1-\beta) < n+\dfrac{2\alpha^{2}}{\lambda} $ In this case, value of
$ \Omega=\sqrt{(n+\dfrac{2\alpha^{2}}{\lambda})-\lambda(n-1)(1-\beta)} $ is positive, and we obtain the equation$ \frac{{\rm d}^{2}y}{{\rm d}\xi^{2}}-\Omega^{2}y=0. $

(19) The solution of Eq. (19) is given by
$y=\dfrac{{\rm d}\psi}{{\rm d}z}= a_{1}{\rm cosh}(\Omega\xi)+ a_{2}{\rm sinh}(\Omega\xi)$ . Hence, the solution of Eq. (15) in this case is given by$ \begin{aligned}[b] \psi =& A[\Omega\sqrt{z^2-1}\; {\rm sinh}(\Omega\xi)-z\; {\rm cosh}(\Omega\xi)] \\ & +B[\Omega\sqrt{z^2-1}\; {\rm cosh}(\Omega\xi)- z\; {\rm sinh}(\Omega\xi)]. \end{aligned} $

(20) The constants A and B in Eqs. (18) and (20) can be determined with the aid of known boundary conditions. The solution obtained in the present model i.e., Eqs. (18) and (20), is similar to that obtained by Tikekar and Jotania [68] for four-dimensional isotropic stars.
-
For a charged compact object with pressure anisotropy, different physical parameters are obtained as functions of z using Eqs. (5), (6), (11), and (12) and are given as follows:
$ \begin{aligned}[b] \rho =&\frac{n}{16\pi G_{D}R^2(z^2-1)}\left[(n-1)+\frac{2}{(\lambda-1)(z^2-1)} \right. \\ & \left. -\frac{2\alpha^{2}[(\lambda-1)z^{2}-\lambda]}{n\lambda{(\lambda-1)}^{2}(z^{2}-1)}\right], \end{aligned} $

(21) $ \begin{aligned}[b] p_{r} =&-\frac{n}{16\pi G_{D}R^2(z^2-1)}\left[(n-1)-\frac{2z}{(\lambda-1)}\frac{\psi_{z}}{\psi} \right. \\ & \left. -\frac{2\alpha^{2}[(\lambda-1)z^{2}-\lambda]}{n\lambda{(\lambda-1)}^{2}(z^{2}-1)}\right], \end{aligned} $

(22) $ \begin{array}{*{20}{l}} p_{t}=p_{r}+\Delta, \end{array} $

(23) $ \Delta=\frac{\beta\lambda(n-1)}{8\pi G_{D}R^2}\frac{[(\lambda-1)z^{2}-\lambda]}{(\lambda-1)^{2}(z^{2}-1)^{2}}, $

(24) $ E^{2} = \frac{{\alpha^{2}}[(\lambda-1)z^{2}-\lambda]}{R^{2}\lambda{[1+(\lambda-1)z^{2}-\lambda]}^{2}}. $

(25) The charge contained within radius r of a compact object in higher dimensions is given by
$ q(r)=\frac{2\pi^{\frac{n+1}{2}}}{\Gamma\left(\dfrac{n+1}{2}\right)}\int^{r}_{0}r^{\prime n}\sigma(r^{\prime}){\rm e}^{\mu(r^{\prime})}{\rm d} r^{\prime}=r^{n}E(r), $

(26) The charge density is obtained using Eqs. (12) and (26) and is given as follows:
$ \begin{aligned}[b] \sigma(r)=&\frac{\Gamma(\dfrac{n+1}{2})}{2\pi^{\frac{n+1}{2}}}\frac{{\alpha}z\sqrt{\dfrac{\lambda-1}{\lambda}}}{R^{2}{[1+(\lambda-1)z^{2}-\lambda]}^{\frac{5}{2}}}\\&\times\left[(n+1)+(n-1)[(\lambda-1)z^{2}-\lambda]\right], \end{aligned} $

(27) where z is a function of r. In this model, we can obtain the central density (
$ \rho_{0} $ ) of a star from Eq. (21), and it is expressed as$ \rho_{0}=\frac{n(n+1)(\lambda-1)}{16\pi G_{D}R^2}. $

(28) Here, we note that the central density (
$ \rho_{0} $ ) is independent of the charge, which was also obtained by Chattopadhyay et al. [74] for isotropic stars. Moreover, we observe that$ \lambda > 1 $ for a non-negative central density. For a charged compact object, the following boundary conditions should be followed:1. To satisfy the continuity of interior metric with the exterior one at the surface (
$ r=b $ ) of a charged star, the exterior metric in higher dimensions for a charged star given by Reissner-Nordstr$ \ddot{o} $ m [75, 76]$ \begin{aligned}[b] {\rm d}s^2=&-\left(1-{\frac{C_n}{r^{n-1}}}+{\frac{q^{2}}{r^{2(n-1)}}}\right) {\rm d}t^{2} \\ & +{\left(1-{\frac{C_n}{r^{n-1}}}+{\frac{q^{2}}{r^{2(n-1)}}}\right)}^{-1}{\rm d}r^{2} +r^{2}{\rm d}{\Omega_{n}}^{2}, \end{aligned} $

(29) should be equal to the interior one. Therefore, at the surface of the star
$ (r=b) $ , the metric potentials should be equated as follows:$ {\rm e}^{2{\nu}(r=b)}={\rm e}^{-2{\mu}(r=b)}=\frac{1+\dfrac{b^2}{R^2}}{1+\lambda\dfrac{b^2}{R^2}}=\left(1-{\frac{C_n}{b^{n-1}}}+{\frac{q^{2}}{b^{2(n-1)}}}\right), $

(30) where q represents the total charge contained in the compact object as measured by an observer situated at infinity, and C is related to the mass of the object by the relation
$ M=\dfrac{nA_{n}C_n}{16{\pi}G_{D}} $ and$ G_{D}=GV_{D-4} $ , with$ V_{D-4}=\dfrac{\pi^{\frac{D-4}{2}}b^{D-4}}{\Gamma{\left(\dfrac{D}{2}-1\right)}} $ and$A_n=\dfrac{2\pi^{\frac{n+1}{2}}}{\Gamma{\left(\dfrac{n+1}{2}\right)}}$ .2. As the radial pressure (
$ p_r $ ) vanishes$ (p_{b}=0) $ at the boundary$ (r=b) $ of a star, we must impose the following condition:$ {\left(\frac{{\psi}_z}{\psi}\right)}_{z_{b}}=\frac{(n-1)(\lambda-1)}{2{z}_{b}}-\frac{{\alpha}^{2}[{{z}_{b}}^{2}(\lambda-1)-\lambda]}{n\lambda{z_{b}}{(\lambda-1)}({{z}_{b}}^{2}-1)}. $

(31) In addition, radial pressure in a compact star should be positive, i.e.,
$ p_{r}>0 $ , which results in$ \left(\frac{{\psi}_z}{\psi}\right)>\frac{(n-1)(\lambda-1)}{2{z}_{b}}-\frac{{\alpha}^{2}[{{z}_{b}}^{2}(\lambda-1)-\lambda]}{n\lambda{z_{b}}{(\lambda-1)}({{z}_{b}}^{2}-1)}. $

(32) Using Eqs. (21) and (22), we obtain the expressions for radial and tangential sound velocities as follows:
$ \begin{aligned}[b] {v_{r}}^{2}=&\frac{{\rm d}p_{r}}{{\rm d}\rho}\\=&\frac{z(z^{2}-1)^{2}(\frac{\psi_{z}}{\psi})^{2}+(z^{2}-1)(\frac{\psi_{z}}{\psi})-\beta{\lambda}z(z^{2}-1)(n-1)-f_1}{4z+z(n-1)(z^{2}-1)(\lambda-1)-f_2},\end{aligned} $

(33) where
$ f_1=\dfrac{2\alpha^{2}z}{n\lambda(\lambda-1)}[2+(n-1)(\lambda-1)(z^{2}-1)] $ ,$ f_2=\dfrac{2\alpha^{2}z}{n\lambda(\lambda-1)}[(\lambda-1)(z^{2}-1)-2] $ , and$ {v_{t}}^{2}={v_{r}}^{2}-\frac{2\beta\lambda^{2}(n-1)[z^{2}(\lambda-1)-(\lambda+1)]}{4n\lambda(\lambda-1)+nz(n-1)(\lambda-1)^{2}(z^{2}-1)-f_3}, $

(34) where
$ f_3=2\alpha^{2}[(\lambda-1)(z^{2}-1)-2] $ . From Eqs. (33) and (34), we conclude that$ v_{t}^2<v_{r}^2 $ always. Therefore, to maintain causality condition, it is sufficient to consider$ v_{r}^2 \leq 1 $ . Subsequently, from Eq. (33), we note the following restriction on$ \left(\dfrac{\psi_{z}}{\psi}\right) $ to be fulfilled to satisfy the causality condition of sound velocity:$ -\frac{1}{2z(z^2-1)}(1+\eta)\le\frac{\psi_{z}}{\psi}\le-\frac{1}{2z(z^2-1)}(1-\eta), $

(35) where
$ \eta=\sqrt{1+4z\left[(n-1)z(z^{2}-1)[\lambda(\beta+1)-1]+4z+f_4\right]} $ and$ f_4=\dfrac{2\alpha^{2}z}{n\lambda(\lambda-1)}[4+(\lambda-1)(z^{2}-1)(n-2)] $ . Using Eqs. (32) and (35), we obtain the upper limit of the ratio$ \left(\dfrac{b^2}{R^2}\right) $ for different values of space-time dimensions D, spheroidal parameter λ, charge anisotropy α, and pressure anisotropy β, and the results are shown in Table 1. Note that the upper limit of the square of reduced radius$ \left(\dfrac{b^2}{R^2}\right) $ is almost independent of α. In four-dimensional space, the minimum allowed value of λ in the isotropic case is$ \lambda>5 $ , and this limit decreases when$ D\geq5 $ [74]. However, in presence of anisotropy, the corresponding limit in different dimensions increases [77]. Gaps in the table indicate that such combinations are not allowed for a physically viable model.D $ \dfrac{b^2}{R^2} $ 

$ \lambda=3 $ 

$ \lambda=5 $ 

$ \lambda=11 $ 

$\begin{aligned} \alpha=0, \\ \beta=0\end{aligned} $ 

$\begin{aligned} \alpha=0, \\ \beta=0.3 \end{aligned}$ 

$ \begin{aligned}\alpha=0.3,\\ \beta=0 \end{aligned}$ 

$ \begin{aligned}\alpha=0.3,\\ \beta=0.3\end{aligned} $ 

$ \begin{aligned}\alpha=0, \\ \beta=0 \end{aligned}$ 

$\begin{aligned} \alpha=0, \\ \beta=0.3 \end{aligned}$ 

$ \begin{aligned}\alpha=0.3,\\ \beta=0 \end{aligned}$ 

$\begin{aligned} \alpha=0.3, \\ \beta=0.3 \end{aligned}$ 

$\begin{aligned} \alpha=0, \\ \beta=0 \end{aligned}$ 

$ \begin{aligned}\alpha=0, \\ \beta=0.3 \end{aligned}$ 

$\begin{aligned} \alpha=0.3,\\ \beta=0 \end{aligned}$ 

$\begin{aligned} \alpha=0.3, \\ \beta=0.3 \end{aligned}$ 

4 $ - $ 

$ - $ 

$ - $ 

$ - $ 

$ - $ 

$ - $ 

$ - $ 

$ - $ 

$ 0.725 $ 

$ - $ 

$ 0.727 $ 

$ - $ 

5 $ - $ 

$ - $ 

$ - $ 

$ - $ 

$ 0.893 $ 

$ - $ 

$ 0.901 $ 

$ - $ 

$ 0.207 $ 

$ 0.284 $ 

$ 0.207 $ 

$ 0.284 $ 

6 $ - $ 

$ - $ 

$ - $ 

$ - $ 

$ 0.333 $ 

$ 0.566 $ 

$ 0.335 $ 

$ 0.569 $ 

$ 0.091 $ 

$ 0.131 $ 

$ 0.091 $ 

$ 0.131 $ 

7 $ 0.577 $ 

$ - $ 

$ 0.589 $ 

$ - $ 

$ 0.152 $ 

$ 0.272 $ 

$ 0.152 $ 

$ 0.273 $ 

$ 0.04 $ 

$ 0.067 $ 

$ 0.04 $ 

$ 0.067 $ 

8 $ 0.265 $ 

$ 0.689 $ 

$ 0.269 $ 

$ 0.67 $ 

$ 0.062 $ 

$ 0.141 $ 

$ 0.062 $ 

$ 0.141 $ 

$ 0.011 $ 

$ 0.031 $ 

$ 0.011 $ 

$ 0.031 $ 

9 $ 0.111 $ 

$ 0.357 $ 

$ 0.114 $ 

$ 0.361 $ 

$ 0.009 $ 

$ 0.067 $ 

$ 0.009 $ 

$ 0.067 $ 

$ - $ 

$ 0.009 $ 

$ - $ 

$ 0.009 $ 

10 $ 0.02 $ 

$ 0.187 $ 

$ 0.021 $ 

$ 0.190 $ 

$ - $ 

$ 0.019 $ 

$ - $ 

$ 0.019 $ 

$ - $ 

$ - $ 

$ - $ 

$ - $ 

11 $ - $ 

$ 0.084 $ 

$ - $ 

$ 0.086 $ 

$ - $ 

$ - $ 

$ - $ 

$ - $ 

$ - $ 

$ - $ 

$ - $ 

$ - $ 

Table 1. Variation in
$ \left(\dfrac{b^2}{R^2}\right) $ with λ for a given dimension (D), charge anisotropy$ (\alpha) $ , and pressure anisotropy$ (\beta) $ . -
The mass contained in radius b of a higher dimensional charged star is given by
$ M(b)=\frac{n\sqrt{\pi}}{8}\frac{\Gamma\left(\dfrac{n}{2}\right)}{\Gamma\left(\dfrac{n+1}{2}\right)}\left[\frac{{\dfrac{b^{3}}{R^{2}}}(\lambda-1)\left(1+\lambda\dfrac{b^{2}}{R^{2}}\right)+\alpha^{2}\dfrac{b^{5}}{R^{4}}}{\left(1+\lambda\dfrac{b^{2}}{R^{2}}\right)^{2}}\right], $

(36) At the surface of a star (
$ p_{r}=0 $ ), we have the relation$ \rho_s=4B $ . If we select the value of B from the range of$ 57.5-91.5 $ ${\rm MeV/fm}^3$ , necessary for stable strange matter relative to$^{56}{\rm Fe}$ , then for a given radius of star, we can solve Eq. (21) to obtain the value of R. We must multiply Eq. (21) by a factor of$ \left(\dfrac{3\times10^{4}}{R^{2}}\right) $ [78] if B is expressed in units of${\rm MeV/fm}^{3}$ . Here, we consider$ G=1 $ and define ρ in units of$ V_{D-4} $ .Mass-radius plots for dimensions
$ D=4,5,6 $ and for the bag constant$B=57.5\; {\rm MeV/fm}^3$ and$91.5\; {\rm MeV/fm}^3$ are shown in Fig. 1. Here, we have set the charge anisotropy as$ \alpha=0.3 $ and the spheroidal parameter as$ \lambda=10 $ . From Fig. 1, we can predict that the mass of a star has a higher value at any radius when B increases and the other parameters remain fixed.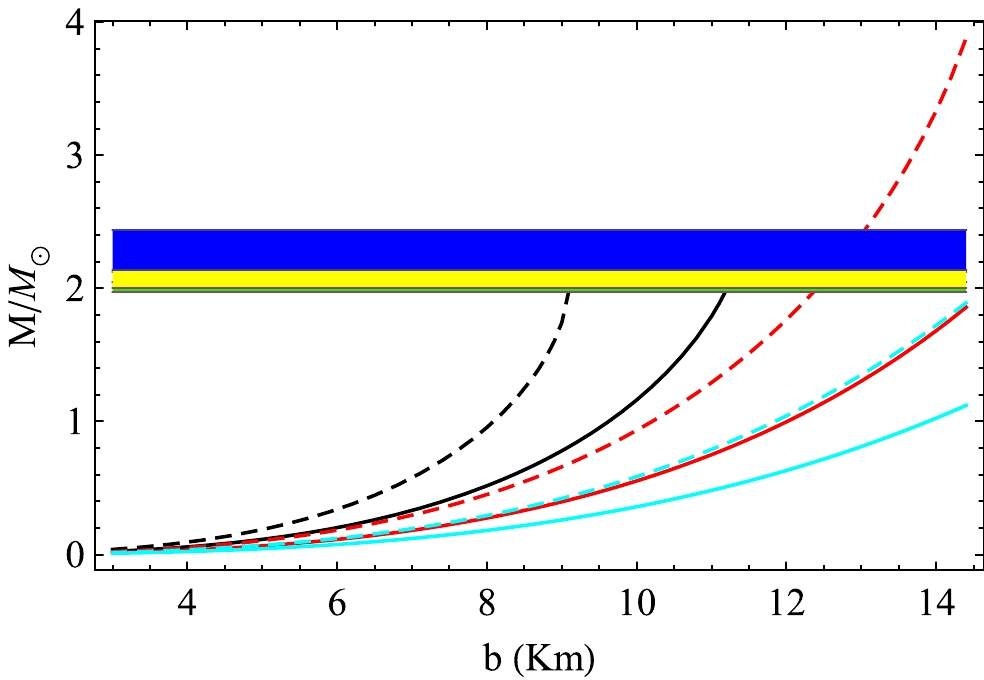
Figure 1. (color online) Mass-radius relation for
$ \alpha=0.3 $ ,$ \lambda=10 $ . The black, red, and cyan lines correspond to$D=4,~5,~6$ , respectively. The solid lines are for$ B=57.5 $ and dashed lines are for 91.5$ \rm MeV/fm^3 $ . The observed range of masses of PSR J 2215+5135 ($ M=2.27^{+0.17}_{-0.15}\; M_{\odot} $ ) [79], PSR J 0740+6620 ($ M=2.072^{+0.067}_{-0.066}\; M_{\odot} $ ) [80], and PSR J 0348+0432 ($M=2.01^{+0.04}_{-0.04}\; M_{\odot}$ ) [81] are marked in blue, yellow, and green, respectively. -
The dependence of the mass function on the central energy density (
$ \rho_0 $ ) of a star is obtained in the present model and is given by$\begin{aligned}[b] M=&\frac{n\sqrt{\pi}}{8}\frac{\Gamma\left(\dfrac{n}{2}\right)}{\Gamma\left(\dfrac{n+1}{2}\right)}\sqrt{\frac{(\lambda-1)y}{\rho_{0}}}\\&\times\sqrt{\frac{n(n+1)}{2}}\frac{[y(\lambda-1)(1+\lambda{y})+\alpha^{2}y^{2}]}{(1+\lambda{y})^{2}}, \end{aligned}$

(37) where
$ y=\dfrac{b^{2}}{R^{2}} $ . Eq. (37) is independent of pressure anisotropy when the radius of the star is given. In Fig. 2, we have plotted the mass of a compact object for different central densities$ \rho_{0} $ for a particular choice of the radius$(b=7\; \rm km)$ and charge anisotropy$ \alpha= 0.3 $ . We note that$ \left(\dfrac{\partial{M}}{\partial{\rho_{0}}}\right)>0 $ . Therefore, our model is stable against gravitational collapse [82]. -
To obtain the maximum mass of a compact object, we note that the causality condition should be maintained throughout the interior of a compact object, i.e,,
$\left(\dfrac{{\rm d}p_{r}}{{\rm d}\rho}\right)\leq1$ . In Table 2, we have tabulated the values of$\left(\dfrac{{\rm d}p_{r}}{{\rm d}\rho}\right)$ at different internal points of a star in different dimensions to determine where$\left(\dfrac{{\rm d}p_{r}}{{\rm d}\rho}\right)=1$ . From Table 2, we note that$\left(\dfrac{{\rm d}p_{r}}{{\rm d}\rho}\right)$ is maximum at the center of the star in$ D\geq5 $ . However, in four dimensions,$\left(\dfrac{{\rm d}p_{r}}{{\rm d}\rho}\right)$ is maximum at$ \left(\dfrac{r}{b}\right)=0.433 $ . Thus, we have selected the value of$\left(\dfrac{{\rm d}p_{r}}{{\rm d}\rho}\right)=0.81$ in four dimensions and$\left(\dfrac{{\rm d}p_{r}}{{\rm d}\rho}\right)=1$ in$ D\geq5 $ to evaluate the maximum mass such that the causality condition is not violated anywhere in the stars. From Eqs. (33) and (35), we obtain the following inequality at the center of the star.$ r/b $ 

$\left(\dfrac{{\rm d}p_r}{{\rm d}\rho}\right)$ 

$B=57.5~{\rm MeV}/{\rm fm^3}$ 

$B=91.5 ~ {\rm MeV}/{\rm fm^3}$ 

$ D=4 $ 

$ D=5 $ 

$ D=8 $ 

$ D=4 $ 

$ D=5 $ 

$ D=8 $ 

$ 0 $ 

$ 0.810 $ 

$ 1.0 $ 

$ 1.0 $ 

$ 0.810 $ 

$ 1.0 $ 

$ 1.0 $ 

$ 0.1 $ 

$ 0.834 $ 

$ 0.998 $ 

$ 0.998 $ 

$ 0.834 $ 

$ 0.998 $ 

$ 0.998 $ 

$ 0.2 $ 

$ 0.895 $ 

$ 0.992 $ 

$ 0.991 $ 

$ 0.895 $ 

$ 0.992 $ 

$ 0.991 $ 

$ 0.3 $ 

$ 0.959 $ 

$ 0.978 $ 

$ 0.981 $ 

$ 0.959 $ 

$ 0.978 $ 

$ 0.981 $ 

$ 0.4 $ 

$ 0.995 $ 

$ 0.955 $ 

$ 0.966 $ 

$ 0.995 $ 

$ 0.955 $ 

$ 0.966 $ 

$ 0.433 $ 

$ 1.0 $ 

$ 0.944 $ 

$ 0.960 $ 

$ 1.0 $ 

$ 0.944 $ 

$ 0.960 $ 

$ 0.5 $ 

$ 0.987 $ 

$ 0.919 $ 

$ 0.947 $ 

$ 0.987 $ 

$ 0.919 $ 

$ 0.947 $ 

$ 0.6 $ 

$ 0.937 $ 

$ 0.869 $ 

$ 0.925 $ 

$ 0.937 $ 

$ 0.869 $ 

$ 0.925 $ 

$ 0.7 $ 

$ 0.855 $ 

$ 0.808 $ 

$ 0.899 $ 

$ 0.855 $ 

$ 0.808 $ 

$ 0.899 $ 

$ 0.8 $ 

$ 0.753 $ 

$ 0.736 $ 

$ 0.871 $ 

$ 0.753 $ 

$ 0.736 $ 

$ 0.871 $ 

$ 0.9 $ 

$ 0.642 $ 

$ 0.657 $ 

$ 0.839 $ 

$ 0.642 $ 

$ 0.657 $ 

$ 0.839 $ 

$ 1.0 $ 

$ 0.530 $ 

$ 0.573 $ 

$ 0.806 $ 

$ 0.530 $ 

$ 0.573 $ 

$ 0.806 $ 

Table 2. Radial variation in
$\left(\dfrac{{\rm d}p_r}{{\rm d}\rho}\right)$ with$ (r/b) $ for the spheroidal parameter$ \lambda=10 $ , charge anisotropy$ \alpha=0.3 $ , and pressure anisotropy$ \beta=0.3 $ .$ {\left(\frac{\psi_{z}}{\psi}\right)}_{z=z_{0}}\leq\frac{\lambda-1}{2\sqrt{\lambda}} \left[-\sqrt{\lambda-1} +X\right], $

(38) where
$X= \sqrt{[17+4(n-1)]\lambda-1+\frac{4(n-1)\lambda^{2}\beta}{\lambda-1}+\frac{8\alpha^{2}\lambda(n+2)}{n\lambda(\lambda-1)}}$ . Again, from Eq. (18) and Eq. (20), we obtain$ \left(\frac{\psi_{z}}{\psi}\right)=\frac{-A({\Omega^{\prime}}^{2}+1)\; {\rm sin}(\Omega^{\prime}\xi)+B({\Omega^{\prime}}^{2}+1)\; {\rm cos}(\Omega^{\prime}\xi)}{\psi}, $

(39) and
$ \left(\frac{\psi_{z}}{\psi}\right)=\frac{A({\Omega}^{2}-1)\; {\rm cosh}(\Omega\xi)+B({\Omega}^{2}-1)\; {\rm sinh}(\Omega\xi)}{\psi}. $

(40) Depending on the sign of
$ {\Omega}^{2} $ , if either Eq. (39) or Eq. (40) is matched with Eq. (31) at the boundary of a star$ (r=b) $ , we obtain a functional relationship between the constants A and B that depends on the ratio$ \left(\dfrac{b^{2}}{R^{2}}\right) $ . Now, combining this with Eq. (38) at the center$ (r=0) $ , we obtain the maximum possible value of the ratio$ \left(\dfrac{b^{2}}{R^{2}}\right) $ . Again, we can rewrite Eq. (36) in the following form:$ \frac{M}{b}=\frac{n\sqrt{\pi}}{8}\frac{\Gamma\left(\dfrac{n}{2}\right)}{\Gamma\left(\dfrac{n+1}{2}\right)}\left[\frac{\lambda-1}{\left(\lambda+\dfrac{1}{y}\right)}+\frac{\alpha^{2}}{{\left(\lambda+\dfrac{1}{y}\right)}^{2}}\right]. $

(41) Because we have already obtained the maximum value of
$ y =\left(\dfrac{b^{2}}{R^{2}}\right) $ , from Eq. (41), it is evident that at this maximum value of y, the value of ratio$ \left(\dfrac{M}{b}\right) $ is also maximum. Now, for a given bag constant B, we can evaluate the maximum value of the radius$(b_{\rm max})$ corresponding to$y_{\rm max}$ from Eq. (21). Subsequently, multiplying the maximum compactness$u_{\rm max}=\left(\dfrac{M}{b}\right)_{\rm max}$ by$b_{\rm max}$ , the maximum mass is obtained.In Fig. 3, the maximum mass is plotted against dimensions for different bag constants (B). From Fig. 3, we observe that for
$ D=5 $ , the maximum mass has the largest value and decreases in other dimensions. We also note from Fig. 3 that the effect of B on the value of maximum mass is negligible for higher dimensions$ D\geq9 $ . In Fig. 4, we show the dependence of maximum mass on the spheroidal parameter λ for two different values of B in dimensions$ D=4,\; 5,\; 6 $ . We note that when the value of λ is sufficiently large, the maximum mass merges towards a constant value when other parameters such as α, β, and D are fixed. For$ D=4,5 $ , and$ 6 $ the asymptotic value of maximum masses are 2.98$ M_{\odot} $ , 3.14$ M_{\odot} $ , and 2.14$ M_{\odot} $ , respectively, when λ is very large ($ \lambda\geq100 $ ) and$ B= $ $57.5\, {\rm MeV/fm}^3$ . However when$ B= $ $91.5\, {\rm MeV/fm}^3$ and ($ \lambda\geq100 $ ), the corresponding maximum masses are 2.36$ M_{\odot} $ , 2.49$ M_{\odot} $ , and 1.69$ M_{\odot} $ for$ D=4,5 $ , and$ 6 $ , respectively. The dependence of maximum mass on the electromagnetic field ($ E^2 $ ) is shown in Fig. 5 in three different dimensions ($D=4,~5,~6$ ) and for two different values of B. The compactness of a star in D dimensional space-time is given by$ \left(\dfrac{M}{b^{D-3}}\right) $ . The generalised Buchdahl's limit in D dimensional space was obtained by Ponce De leon and Cruz [83] and is given by
Figure 3. (color online) Variation in the maximum mass (
$ M_{max} $ ) with dimensions (D) for$ \alpha=0.3 $ ,$ \beta=0.3 $ , and$ \lambda=10 $ .
Figure 4. (color online) Variation in the maximum mass (
$M_{\rm max}$ ) with λ for$ \alpha=0.3 $ ,$ \beta=0.1 $ . The blue, red, and green lines correspond to D = 4, 5, and 6, respectively. The solid and dashed lines represent$ B=57.5 $ and$91.5\; {\rm MeV/fm}^{3}$ , respectively.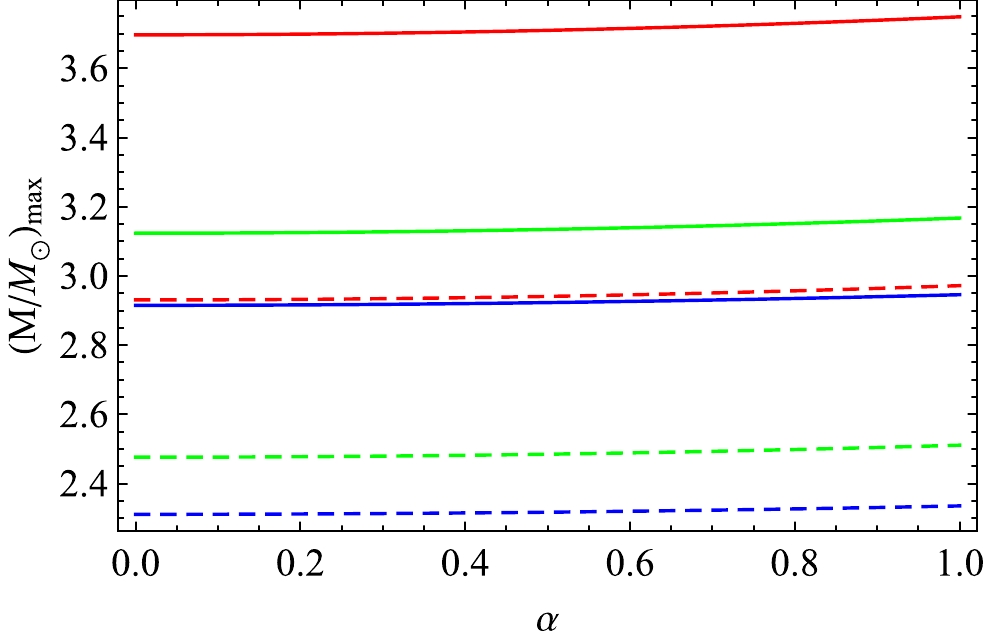
Figure 5. (color online) Variation in the maximum mass (
$M_{\rm max}$ ) with α for$B=57.5\; {\rm MeV/fm}^{3}$ (solid lines) and$B=91.5\; {\rm MeV/fm}^{3}$ (dashed lines). Here, we consider$ \beta=0.3 $ and$ \lambda=10 $ . The blue, red, and green lines correspond to$D=4,~ 5,~ 6$ , respectively.$ \frac{M}{b^{D-3}}\leq\frac{2(D-2)}{(D-1)^{2}}. $

(42) From Eq. (42), we evaluate the theoretical value of
$u_{\rm max}=0.444$ ,$ 0.375 $ , and$ 0.320 $ when$ D=4 $ ,$ 5 $ , and$ 6 $ , respectively. In our model, we have determined the maximum possible allowed values of α and β in$ D=4 $ ,$ 5 $ , and$ 6 $ and list them in Table 3.D α β $\left(\dfrac{M}{b}\right)_{\rm max}$ 

$E^2 \times 10^{-5} /$ 

$(1/{\rm km}^2)$ 

Δ/ $(\rm MeV/fm^3)$ 

4 $\alpha_{\rm max}=3.87$ 

$\beta_{\rm min}=0$ 

0.444 97.4 0 $\alpha_{\rm min}=0$ 

$\beta_{\rm max}=0.799$ 

0.406 0 153.928 5 $\alpha_{\rm max}=4.87$ 

$\beta_{\rm min}=0$ 

0.375 30.68 0 $\alpha_{\rm min}=0$ 

$\beta_{\rm max}=0.748$ 

0 69.748 6 $\alpha_{\rm max}=6.98$ 

$\beta_{\rm min}=0$ 

0.320 22.34 0 $\alpha_{\rm min}=0$ 

$\beta_{\rm max}=0.779$ 

0 40.503 Table 3. Tabulation of the maximum allowed value of
$\alpha_{\rm max}$ and$\beta_{\rm max}$ for$ \lambda=10 $ in different dimensions (D) to satisfy the generalized Buchdahl limit.In Tables 4 and 5, we have tabulated the values of the maximum mass (
$M_{\rm max}$ ), radius ($b_{\rm max}$ ), compactness ($u_{\rm max}$ ), and maximum surface redshift ($(Z_s)_{\rm max}$ ) for different dimensions (D) and bag constants (B). For each dimension, the variation is studied for different charges and pressure anisotropies. We note from Tables 4 and 5 that the maximum compactness ($u_{\rm max}$ ) is almost independent of B. However,$u_{\rm max}$ decreases with the increase in space-time dimension D when other parameters are fixed, and$u_{\rm max}$ increases with the increase in α and β, but$u_{\rm max}$ always lies below the generalised Buchdahl limit [83] for certain allowed values of α and β, which are discussed in the subsequent section. In our model,$u_{\rm max}=$ 0.356,$ 0.274 $ , and$ 0.180 $ when$ D=4 $ ,$ \alpha=0 $ , and$ \beta=0 $ , as tabulated in Tables 4 and 5. From Tables 4 and 5, we observe that when α or$ E^2 $ increases, the maximum mass and radius both increase when D, β, and B are constant. Physically, this means that owing to the Coulomb repulsion, the structure of the star for the same B and pressure anisotropy should maintain a higher radius in the presence of a charge. In contrast, the maximum mass and radius decrease with the increase in B when D, β, and$ E^2 $ are fixed. From the above analysis, an interesting conclusion that may be drawn is that a co-relation may exist between$ E^2 $ and B for a higher-dimensional charged strange quark star. We have evaluated the maximum value of α and β numerically such that the maximum compactness ($u_{\rm max}$ ) does not exceed the generalised Buchdahl limit as proposed by Ponce De Leon and Cruz [83]. The maximum allowable combination of the charge (α) and pressure (β) anisotropy parameters are tabulated in Table 3 for$ \lambda=10 $ .Dimensions (D) α β $y_{\rm max}$ 

$b_{\rm max}$ /

$\rm km$ 

${\left(\dfrac{M}{b}\right)}_{\rm max}$ 

$M_{\rm max}$ /

$ M_{\odot} $ 

$(Z_{s})_{\rm max}$ 

$ 4 $ 

$ 0.0 $ 

$ 0.0 $ 

0.380 11.464 0.356 2.772 0.866 $ 0.3 $ 

0.514 11.402 0.377 2.915 1.014 $ 0.5 $ 

$ 0.0 $ 

0.384 11.474 0.358 2.780 0.875 $ 0.3 $ 

0.519 11.414 0.378 2.923 1.026 3.87 0 0.629 10.702 0.444 3.221 1.988 0 0.799 0.919 11.254 0.406 3.096 1.304 $ 5 $ 

$ 0.0 $ 

$ 0.0 $ 

0.107 16.429 0.274 3.051 0.487 $ 0.3 $ 

0.149 17.187 0.317 3.697 0.654 $ 0.5 $ 

$ 0.0 $ 

0.107 16.437 0.275 3.063 0.490 $ 0.3 $ 

0.150 17.192 0.318 3.710 0.659 4.87 0 0.156 16.937 0.375 4.303 0.999 0 0.748 0.242 17.946 0.375 4.564 1.001 $ 6 $ 

$ 0.0 $ 

$ 0.0 $ 

0.043 17.609 0.180 2.150 0.250 $ 0.3 $ 

0.064 19.667 0.234 3.124 0.372 $ 0.5 $ 

$ 0.0 $ 

0.043 17.625 0.181 2.159 0.251 $ 0.3 $ 

0.064 19.680 0.235 3.135 0.373 6.98 0 0.076 20.193 0.320 4.380 0.668 0 0.779 0.114 22.191 0.320 4.813 0.664 Table 4. Tabulation of
$y_{\rm max}$ ,$b_{\rm max}$ , maximum compactness${\left(\dfrac{M}{b}\right)}_{\rm max}$ , and maximum mass$M_{\rm max}$ for bag constant$B=57.5\; \rm MeV/fm^{3}$ and$ \lambda=10 $ in different dimensions (D) and for different values of the charge anisotropy$ (\alpha) $ and pressure anisotropy$ (\beta) $ .Dimensions (D) α β $y_{\rm max}$ 

$b_{\rm max}$ /

$\rm km$ 

${\left(\dfrac{M}{b}\right)}_{\rm max}$ 

$M_{\rm max}$ /

$ M_{\odot} $ 

$(Z_{s})_{\rm max}$ 

$ 4 $ 

$ 0.0 $ 

$ 0.0 $ 

0.380 9.088 0.356 2.197 0.866 $ 0.3 $ 

0.514 9.039 0.377 2.311 1.014 $ 0.5 $ 

$ 0.0 $ 

0.384 9.096 0.358 2.204 0.875 $ 0.3 $ 

0.519 9.048 0.378 2.317 1.026 3.87 0 0.629 8.484 0.444 2.554 1.988 0 0.799 0.919 8.921 0.406 2.450 1.304 $ 5 $ 

$ 0.0 $ 

$ 0.0 $ 

0.107 13.024 0.274 2.419 0.487 $ 0.3 $ 

0.149 13.625 0.317 2.931 0.654 $ 0.5 $ 

$ 0.0 $ 

0.107 13.030 0.275 2.428 0.490 $ 0.3 $ 

0.150 13.628 0.318 2.941 0.659 4.87 0 0.156 13.427 0.375 3.411 1.000 0 0.748 0.242 14.226 0.375 3.618 1.001 $ 6 $ 

$ 0.0 $ 

$ 0.0 $ 

0.043 13.959 0.180 1.705 0.250 $ 0.3 $ 

0.064 15.590 0.234 2.217 0.372 $ 0.5 $ 

$ 0.0 $ 

0.043 13.972 0.181 1.711 0.251 $ 0.3 $ 

0.064 15.600 0.235 2.485 0.373 6.98 0 0.076 16.008 0.320 3.473 0.668 0 0.779 0.114 17.592 0.320 3.816 0.664 Table 5. Tabulation of
$y_{\rm max}$ ,$b_{\rm max}$ , maximum compactness${\left(\dfrac{M}{b}\right)}_{\rm max}$ , and maximum mass$M_{\rm max}$ for bag constant$B=91.5\; \rm MeV/fm^{3}$ and$ \lambda=10 $ in different dimensions (D) and for different values of the charge anisotropy$ (\alpha) $ and pressure anisotropy$ (\beta) $ . -
The maximum surface redshift is given by
$ (Z_{s})_{\rm max}=\left[1-2\left(\frac{M}{b}\right)_{\rm max}\right]^{-\frac{1}{2}}-1. $

(43) In terms of the compactness of a star, the above equation can be expressed as
$ \begin{array}{*{20}{l}} (Z_{s})_{\rm max}=\left[1-2u_{\rm max}\right]^{-\frac{1}{2}}-1. \end{array} $

(44) From Tables 4 and 5, we note that the maximum surface redshift is independent of the value of B when all other parameters are fixed. However, the maximum value of the surface redshift decreases with the increase in space-time dimensions D when other parameters such as α and β are fixed, but
$(Z_s)_{\rm max}$ increases with the increase in the charge anisotropy α and pressure anisotropy β when D is fixed. The maximum surface redshift should be as high as$(Z_{s})_{\rm max}\leq5.2$ , as predicted by Ivanov [52]. Tables 4 and 5 indicate that the maximum surface redshift predicted in our model satisfies the result of Ivanov. We also observe that the maximum surface redshift is maximum for$ D=4 $ and decreases as the dimensions increase. -
We analysed the physically viable features of some compact astrophysical objects, which are supposed to be strange stars. Here, we consider the observed mass as the input parameter and, using this value, we predict the radius of few strange quark stars in this model. Additionally, the mass can be predicted if we select the observed radius as the input parameter.
Case-1 : First, we consider VELA X1 [84], which has an observed mass and radius of
$ M=1.77 M_{\odot} $ and$b=9.56 ~\rm km$ , respectively. Using Eq. (36), the mass of a star can be predicted for a parametric choice of D, B, and α by fixing its radius. Hence, we equate Eq. (21) first to the value of the surface energy density through the relation$ \rho_{s}=4B $ to evaluate the curvature parameter R for given B, λ, and α values. In this model, we attempt to predict the mass$ M=1.77 M_{\odot} $ for VELA X1 for different combinations of D, B, and α, and they are tabulated in Table 6. Note that the mass of VELA X1 ($ M=1.77 M_{\odot} $ ) may be predicted for a parametric value of$ B=80.063 $ $\rm MeV/fm^3$ when its radius b is fixed at 9.56$\rm km$ and$ D=4 $ ,$ \alpha=0 $ . When the charge anisotropy increases, the observed mass can be predicted with a lower value of B when D and b are fixed. However, when the dimensions increase ($ D>4 $ ), the observed mass can be achieved for a higher value of B than required in four dimensions when α and b are fixed, as observed in Table 6. However, as the radius of the star is model dependent, we also attempt to predict the observed radius of VELA X1 based on the observed mass, and the values are tabulated in Table 7. The values of physical parameters are studied using the corresponding values of B and α, which are tabulated in Tables 6 and 7, for which we have predicted the mass and radius of VELA X1. Graphical representations of radial variation in physical parameters of a star such as energy density$ (\rho) $ , radial pressure ($ p_r $ ), tangential pressure ($ p_t $ ), and anisotropy in pressure (Δ) are depicted in Figs. 6–9, respectively. We note from Fig. 6 that the energy density has a higher value in higher dimensions (D); therefore, higher dimensions enable a more compact stellar configuration than the conventional four dimensions. Figure 7 shows that the radial pressure ($ p_{r} $ ) decreases monotonically from the center to the surface and decreases to zero at the surface of the star. Figure 9 shows that at the center of the star$ \Delta=0 $ , and Δ has the maximum value at the surface. The effect of dimensions increases the values of different pressures from their four dimensional counterparts. The central density ($ \rho_{0} $ ), central pressure ($ p_0 $ ), and surface density ($ \rho_{s} $ ) are also determined in this model and are tabulated in Table 8. We note that with the increase in dimensions, all these parameters increase; however, with the increase in α, all these parameters decrease. The radial variation of$ E^{2} $ is shown in Fig. 10, which indicates that$ E^{2} $ increases monotonically with the radial co-ordinate r from the center to the surface. Such a result is also shown in the work of Maharaj et al. [85] and Sunzu and Danford [86]. From Tables 6 and 7, we note that this model contains a co-relation between B and α (or$ E^2 $ ) to predict the radius using the observed mass, or vice versa. In Fig. 11, we show the co-relation between$ E^2 $ and B for which the observed mass of VELA X1 may be predicted. In Figs. 12 and 13, we show the dependence of$ E^2 $ and Δ on the value of spheroidal parameter λ and D for parametric values of$ \alpha=0.3 $ and$ \beta=0.3 $ . Figure 12 shows that anisotropy in the pressure (Δ) increases with the increase in D. However, Δ approaches a constant value when λ is sufficiently large ($ \lambda>100 $ ). Therefore, we may conclude that anisotropy is independent of geometry in four and higher dimensions when the spheroidal parameter is large. Figure 13 show that the square of the electric field ($ E^2 $ ) assumes a maximum value when λ is small and decreases towards a constant value as λ gradually increases. Additionally,$ E^2 $ has a higher value in four dimensions.Dimension B/ ( $\rm MeV/fm^3$ )

α $R/\rm km$ 

$M/ M_{\odot}$ 

$ E_B $ 

$\rm /MeV$ 

4 80.06 0.0 $ 24.331 $ 

$ 1.770 $ 

899.767 80.020 0.3 $ 24.350 $ 

$ 1.770 $ 

899.655 79.944 0.5 $ 24.384 $ 

$ 1.770 $ 

899.441 5 169.478 0.0 $ 29.330 $ 

$ 1.770 $ 

1085.31 169.401 0.3 $ 29.346 $ 

$ 1.770 $ 

1085.19 169.266 0.5 $ 29.373 $ 

$ 1.770 $ 

1084.97 6 274.958 0.0 $ 33.076 $ 

$ 1.770 $ 

1224.88 274.845 0.3 $ 33.090 $ 

$ 1.770 $ 

1224.75 274.645 0.5 $ 33.115 $ 

$ 1.770 $ 

1224.53 Table 6. Prediction of mass of the compact object VELA X1 with an observed radius of
$ b=9.56 $ km for different bag constant$ (B) $ and charge anisotropy$(\alpha)$ values. The energy per baryon ($ E_B $ ) is also shown in the final column. Here, we consider$ \lambda=10 $ .Dimension $B /\rm (MeV/fm^3)$ 

α $b /\rm km$ 

$E_B \rm /MeV$ 

$ 4 $ 

57.5 0.0 10.979 828.310 0.3 10.977 80.02 0.0 9.562 899.767 0.3 9.560 80.06 0.0 9.560 899.655 0.3 9.558 91.5 0.0 9.000 930.318 0.3 8.998 $ 5 $ 

91.5 0.0 11.956 930.318 0.3 11.954 169.478 0.0 9.560 1085.31 0.3 9.558 $ 6 $ 

91.5 0.0 14.046 930.318 0.3 14.045 274.845 0.0 9.561 1224.75 0.3 9.560 Table 7. Prediction of radius of the compact object VELA X1 with an observed mass of 1.77
$ M_{\odot} $ for different bag constant$ (B) $ and charge anisotropy$ (\alpha) $ values. The energy per baryon ($ E_B $ ) is also shown in the final column. Here, we consider$ \lambda=10 $ .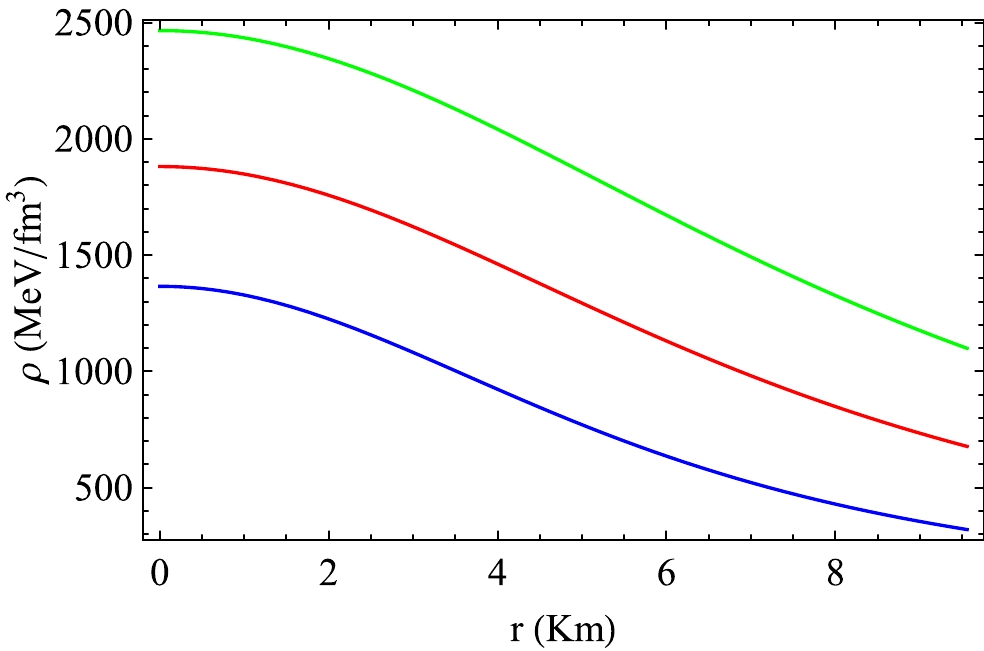
Figure 6. (color online) Variation in the energy density
$ (\rho) $ with radial distance$ (r) $ in VELA X1 for$ \alpha=0.3 $ and$ \lambda=10 $ . Here, the blue, red, and green lines correspond to$D=4,~5,~6$ and$ B=80.02 $ ,$ 169.40 $ ,$274.84\; \rm MeV/fm^{3}$ , respectively.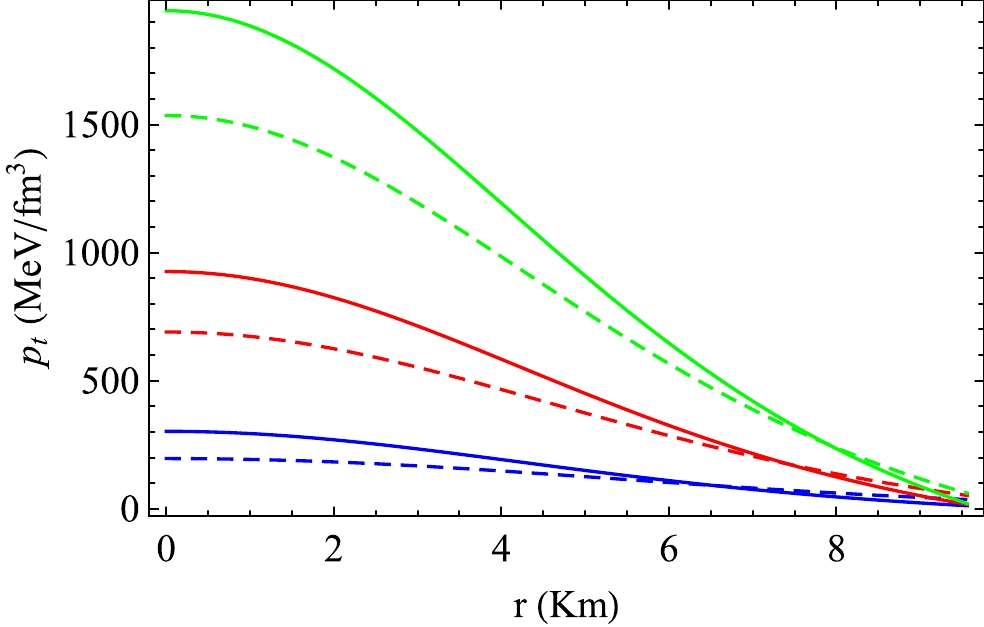
Figure 8. (color online) Variation in
$ (p_{t}) $ with$ (r) $ of VELA X1 for$ \alpha=0.3 $ and$ \lambda=10 $ . Here, the blue, red, and green lines correspond to$D=4,~5,~6$ and$ B=80.02 $ ,$ 169.40 $ ,$274.84\; \rm MeV/fm^{3}$ , respectively. The solid and dashed lines are for$ \beta=0.1 $ and$ 0.3 $ , respectively.
Figure 9. (color online) Variation in Δ with radial distance
$ (r) $ in VELA X1 for$ \alpha=0.3 $ and$ \lambda=10 $ . Here, the blue, red, and green lines correspond to$D=4,~5,~6$ and$ B=80.020 $ ,$ 169.401 $ ,$274.845\; \rm MeV/fm^{3}$ , respectively. The solid and dashed lines are for$ \beta=0.1 $ and$ 0.3 $ , respectively.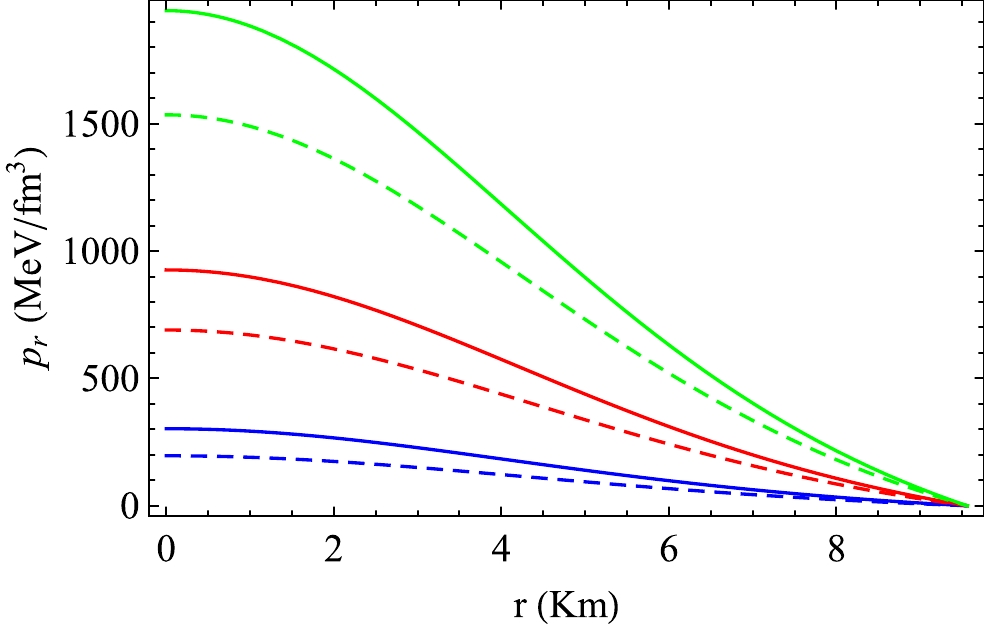
Figure 7. (color online) Variation in the radial pressure
$ (p_{r}) $ with radial distance$ (r) $ in VELA X1 for$ \alpha=0.3 $ and$ \lambda=10 $ . Here, the blue, red, and green lines correspond to$D=4,~5,~6$ and$ B=80.02 $ ,$ 169.40 $ ,$274.84\; \rm MeV/fm^{3}$ , respectively. The solid and dashed lines are for$ \beta=0.1 $ and$ 0.3 $ , respectively.Dimension B/ ( $\rm MeV/fm^3$ )

α Central density ( $ \rho_{0} $ )/(

$\rm gm/cm^{3}$ )

Surface density ( $ \rho_{s} $ )/(

$\rm gm/cm^{3}$ )

Central pressure ( $ p_{0} $ )/(

${\rm dyne/cm}^2$ )

$ \beta=0 $ 

$ \beta=0.1 $ 

$ \beta=0.3 $ 

4 80.063 0.0 $ 24.324\times10^{14} $ 

$ 5.693\times10^{14} $ 

$ 5.766\times10^{35} $ 

$ 4.883\times10^{35} $ 

$ 3.173\times10^{35} $ 

80.020 0.3 $ 24.286\times10^{14} $ 

$ 5.690\times10^{14} $ 

$ 5.726\times10^{35} $ 

$ 4.847\times10^{35} $ 

$ 3.143\times10^{35} $ 

79.944 0.5 $ 24.219\times10^{14} $ 

$ 5.685\times10^{14} $ 

$ 5.656\times10^{35} $ 

$ 4.783\times10^{35} $ 

$ 3.089\times10^{35} $ 

5 169.478 0.0 $ 33.478\times10^{14} $ 

$ 12.052\times10^{14} $ 

$ 16.893\times10^{35} $ 

$ 14.903\times10^{35} $ 

$ 11.110\times10^{35} $ 

169.401 0.3 $ 33.443\times10^{14} $ 

$ 12.046\times10^{14} $ 

$ 16.824\times10^{35} $ 

$ 14.841\times10^{35} $ 

$ 11.059\times10^{35} $ 

169.266 0.5 $ 33.380\times10^{14} $ 

$ 12.037\times10^{14} $ 

$ 16.705\times10^{35} $ 

$ 14.732\times10^{35} $ 

$ 10.970\times10^{35} $ 

6 274.958 0.0 $ 43.874\times10^{14} $ 

$ 19.553\times10^{14} $ 

$ 34.755\times10^{35} $ 

$ 31.260\times10^{35} $ 

$ 24.682\times10^{35} $ 

274.845 0.3 $ 43.837\times10^{14} $ 

$ 19.544\times10^{14} $ 

$ 34.644\times10^{35} $ 

$ 31.159\times10^{35} $ 

$ 24.601\times10^{35} $ 

274.645 0.5 $ 43.772\times10^{14} $ 

$ 19.530\times10^{14} $ 

$ 34.446\times10^{35} $ 

$ 30.981\times10^{35} $ 

$ 24.456\times10^{35} $ 

Table 8. Central density (
$\rho_{0}$ ), surface density ($\rho_{s}$ ), and central pressure ($p_{0}$ ) calculated for VELA X1.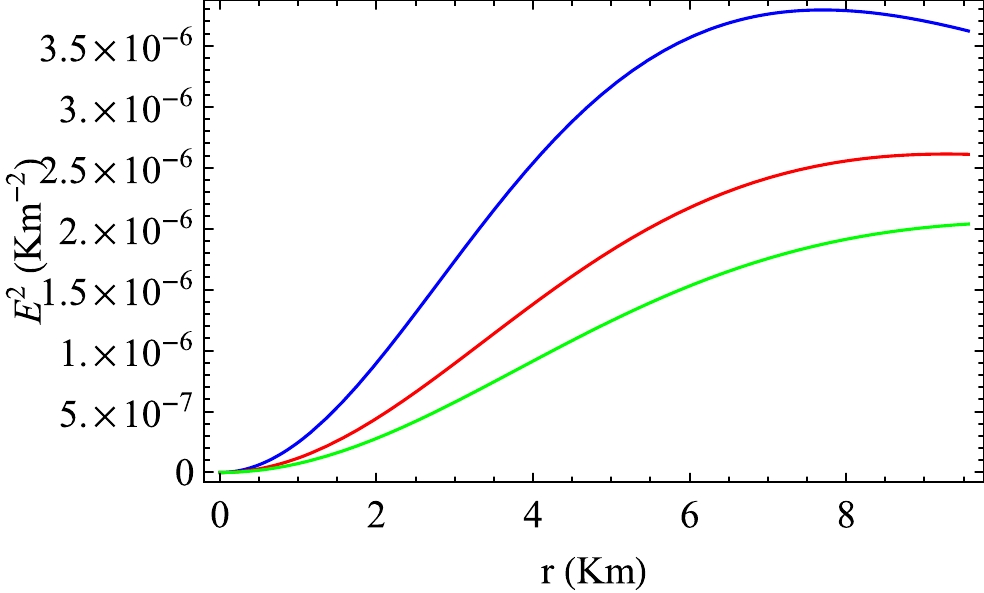
Figure 10. (color online) Variation in
$ E^{2} $ with radial coordinate r in VELA X1 for$ \alpha=0.3 $ and$ \lambda=10 $ . Here, the blue, red, and green lines correspond to$D=4,~5,~6$ and$ B=80.020 $ ,$ 169.401 $ ,$274.845\; \rm MeV/fm^{3}$ , respectively.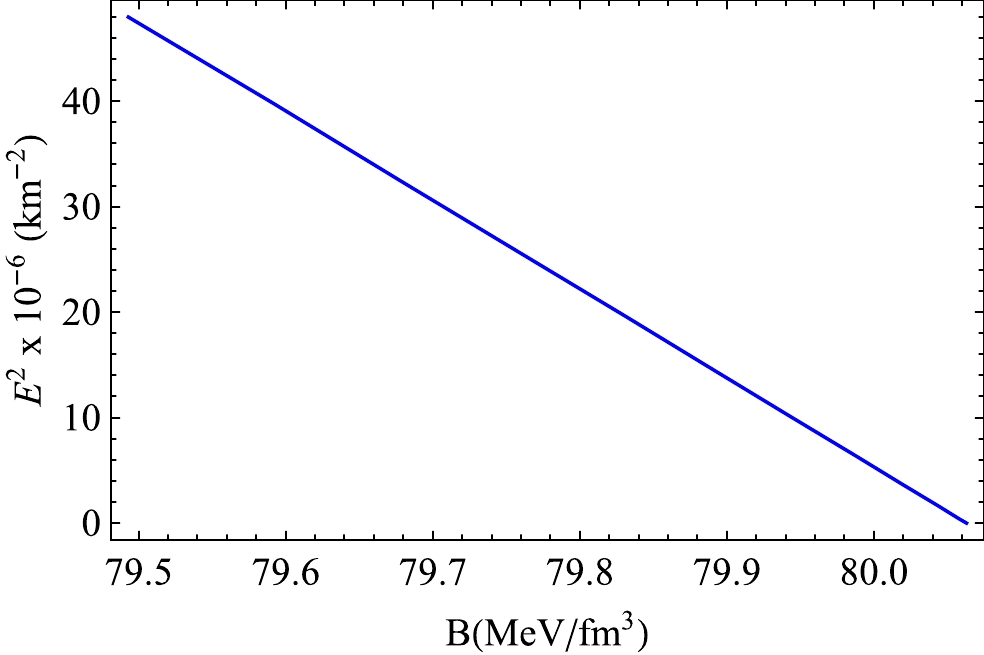
Figure 11. (color online) Variation in
$ E^2 $ at the surface ($ r=b $ ) with the bag constant (B) in VELA X-1 in 4D.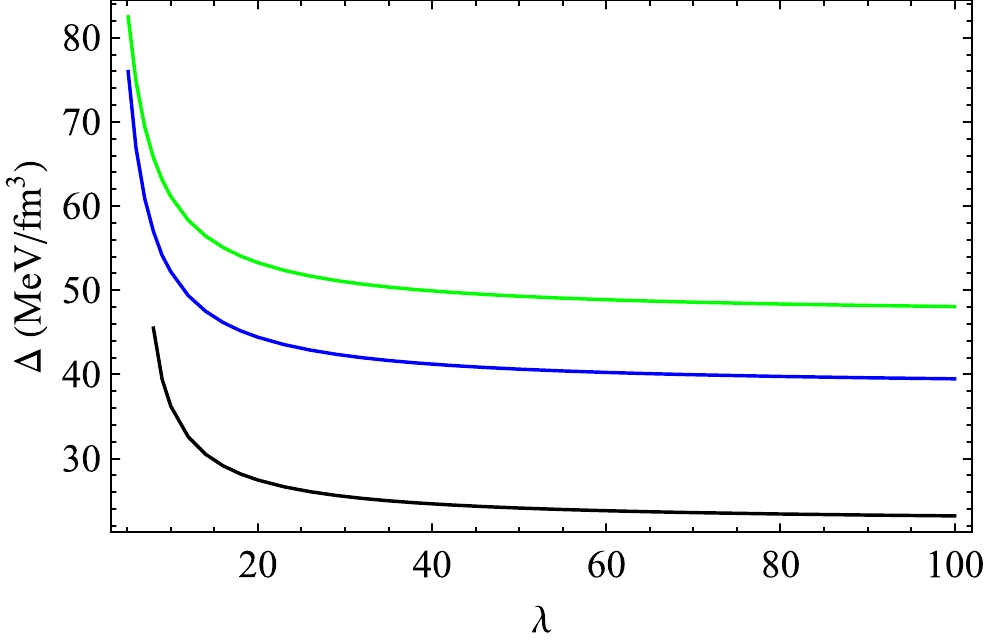
Figure 12. (color online) Variation in Δ with λ in VELA X1 for
$ \alpha=0.3 $ ,$ \beta=0.3 $ . The black, blue, and green lines correspond to D = 4, 5, 6 and B =$ 80.020 $ ,$ 169.401 $ ,$274.845\; \rm MeV/fm^{3}$ , respectively.
Figure 13. (color online) Variation in
$ E^{2} $ with λ inVELA X1 for$ \alpha=0.3 $ and$ \beta=0.3 $ . The black, blue, and green lines correspond to D = 4, 5, 6 and B =$ 80.020 $ ,$ 169.401 $ ,$274.845\; \rm MeV/fm^{3}$ , respectively.Case-2: Next we consider 4U 1608-52 [87], which has an observed mass and radius of
$ M=1.74 M_{\odot} $ and$b=9.8 \rm km$ , respectively. Using Eq. (36), we predict the mass M for different values of D, B, and α by fixing its radius in this model. We use the same approach as discussed in Case-1. We predict the mass$ M=1.74 M_{\odot} $ for 4U 1608-52 for different combinations of D, B, and α, and they are tabulated in Table 9. When$ D=4 $ and$ \alpha=0 $ , we note that observed mass of 4U 1608-52 ($ M=1.74 M_{\odot} $ ) may be predicted for a parametric value of$B=75.1\; \rm MeV/fm^3$ when its radius b is fixed at 9.8$ km $ . When the charge anisotropy increases, the observed mass can be predicted with a lower value of B while maintaining other parameters such as D and b. However, when the dimension increases ($ D>4 $ ) the observed mass can be achieved for higher values of B than that required in four dimensions when α and b are fixed is shown in Table 9. However, as the radius of the star is model dependent, we also attempt to predict the radius of 4U 1608-52 based on the observed mass, and the values are tabulated in Table 10. From Tables 9 and 10, we note that this model contains a co-relation between B and α (or$ E^2 $ ) to predict the radius using the observed mass, or vice versa. In Fig. 14, we show the co-relation between$ E^2 $ and B for which the observed mass of 4U 1608-52 may be predicted. In Figs. 15 and 16, we show the dependence of Δ and$ E^2 $ on the value of the spheroidal parameter λ and D for the parametric value of$ \alpha=0.3 $ and$ \beta=0.3 $ . From Fig. 15, we observe that the pressure anisotropy (Δ) increases with the increase in D. However, Δ approaches a constant value when λ is sufficiently large ($ \lambda>100 $ ). Therefore, we may conclude that anisotropy is independent of geometry in four and higher dimensions when the spheroidal parameter is sufficiently large. From Fig. 16, we observe that the square of the electric field ($ E^2 $ ) assumes a maximum value when λ is small and decreases towards a constant value as λ gradually increases. Additionally,$ E^2 $ has a higher value in four dimensions. Moreover, from Figs. 13 and 16, we note that the effect of dimensions is less significant when λ is large.Dimension B /( $\rm MeV/fm^3$ )

α R/ $\rm km$ 

M/ $ M_{\odot} $ 

$ E_B $ /MeV

4 75.100 0.0 $ 26.265 $ 

$ 1.74 $ 

885.495 75.061 0.3 $ 26.282 $ 

$ 1.74 $ 

885.380 74.990 0.5 $ 26.315 $ 

$ 1.74 $ 

885.171 5 156.865 0.0 $ 31.364 $ 

$ 1.74 $ 

1064.53 156.794 0.3 $ 31.380 $ 

$ 1.74 $ 

1064.41 156.672 0.5 $ 31.407 $ 

$ 1.74 $ 

1064.20 6 253.212 0.0 $ 35.213 $ 

$ 1.74 $ 

1199.91 253.113 0.3 $ 35.226 $ 

$ 1.74 $ 

1199.79 252.934 0.5 $ 35.250 $ 

$ 1.74 $ 

1199.58 Table 9. Prediction of the mass of the compact object 4U 1608-52 with an observed radius of
$ b=9.8 $ km for different bag constant$ (B) $ and charge anisotropy$ (\alpha) $ values. The energy per baryon ($ E_B $ ) is also shown in the final column. Here, we consider$ \lambda=10 $ .Dimension $B/ \rm (MeV/fm^3)$ 

α $b \rm /km$ 

$ E_B $ /MeV

$ 4 $ 

57.5 0.0 10.945 828.310 0.3 10.941 75.061 0.0 9.802 885.380 0.3 9.800 75.1 0.0 9.800 885.495 0.3 9.798 91.5 0.0 9.000 930.318 0.3 8.998 $ 5 $ 

91.5 0.0 11.956 930.318 0.3 11.954 156.865 0.0 9.800 1064.53 0.3 9.798 $ 6 $ 

91.5 0.0 14.046 930.318 0.3 14.044 253.212 0.0 9.800 1199.91 0.3 9.799 Table 10. Prediction of radius of the compact object 4U 1608-52 with an observed mass 1.74
$ M_{\odot} $ for different bag constant$ (B) $ and charge anisotropy$ (\alpha) $ values. The energy per baryon ($ E_B $ ) is also shown in the final column. Here, we consider$ \lambda=10 $ .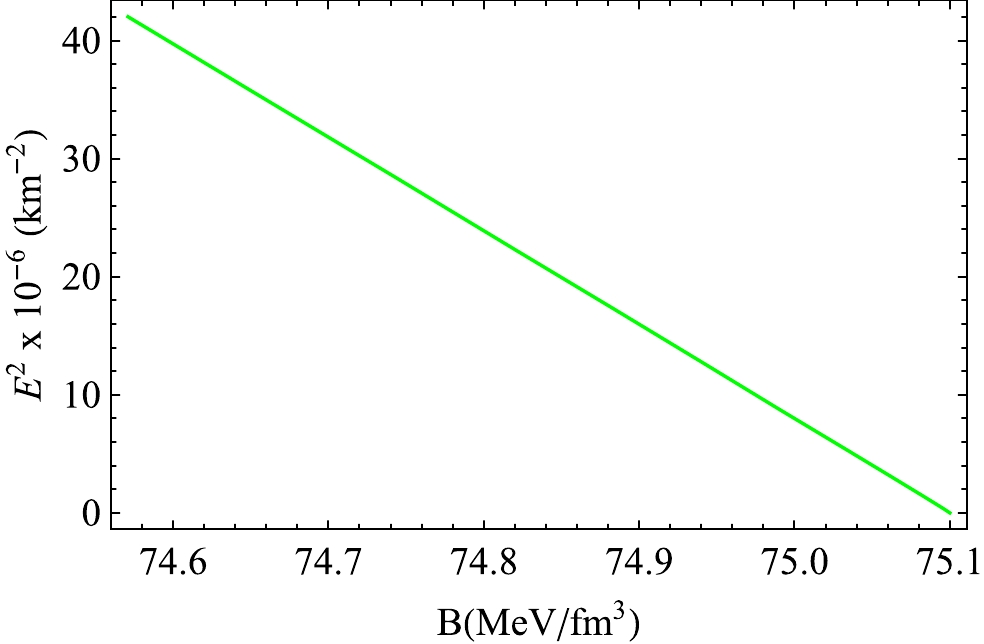
Figure 14. (color online) Variation in
$ E^2 $ at the surface ($ r=b $ ) with the bag constant (B) in 4U 1608-52 in 4D. -
For a relativistic charged fluid sphere, the following energy conditions must hold from the center to the surface of the fluid sphere for any realistic model:
i) Null energy condition:
$ \left(\rho+\dfrac{E^{2}}{8\pi} \right)\geq 0 $ ii) Weak energy condition:$\left( \rho+p_{t}+\dfrac{E^2}{4\pi}\right) \geq 0$ ,$ (\rho+p_{r}) \geq 0 $ iii) Strong energy condition:$\left(\rho+p_{r}+2p_{t}+\dfrac{E^{2}}{4\pi}\right) \geq 0.$ We have plotted the null energy conditions for VELA X1 in Fig. 17. In Figs. 18 and 19, we shown the variation in the weak energy conditions for VELA X1. The strong energy condition for VELA X1 is plotted in Fig. 20. From Figs. 17 to 20, we note that all energy conditions are obeyed in this model in the presence of a charge.
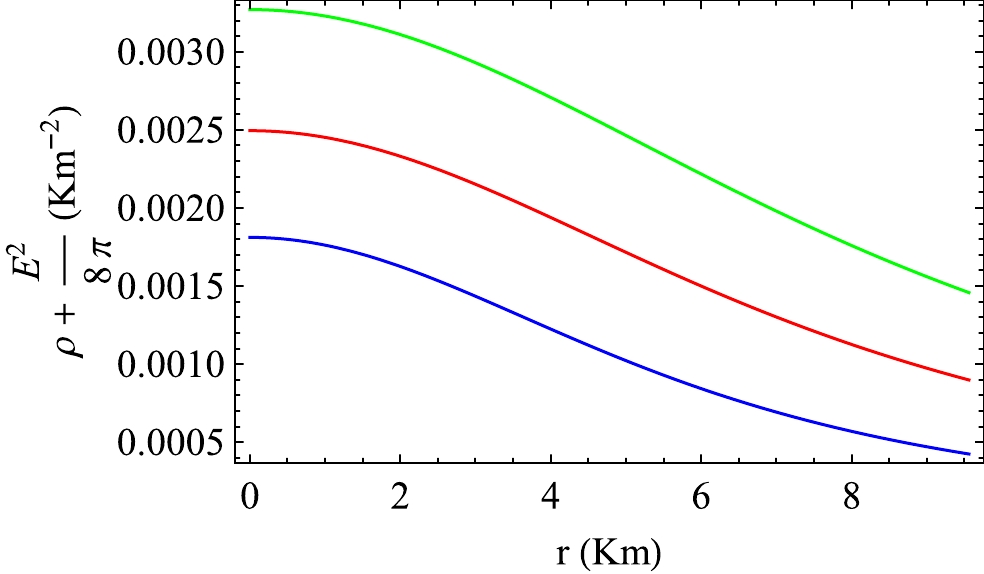
Figure 17. (color online) Variation in
$\left(\rho+\dfrac{E^{2}}{8\pi}\right)$ with r in VELA X1 for$ \alpha=0.3 $ . The blue, red, and green lines correspond to D = 4, 5, and 6, respectively.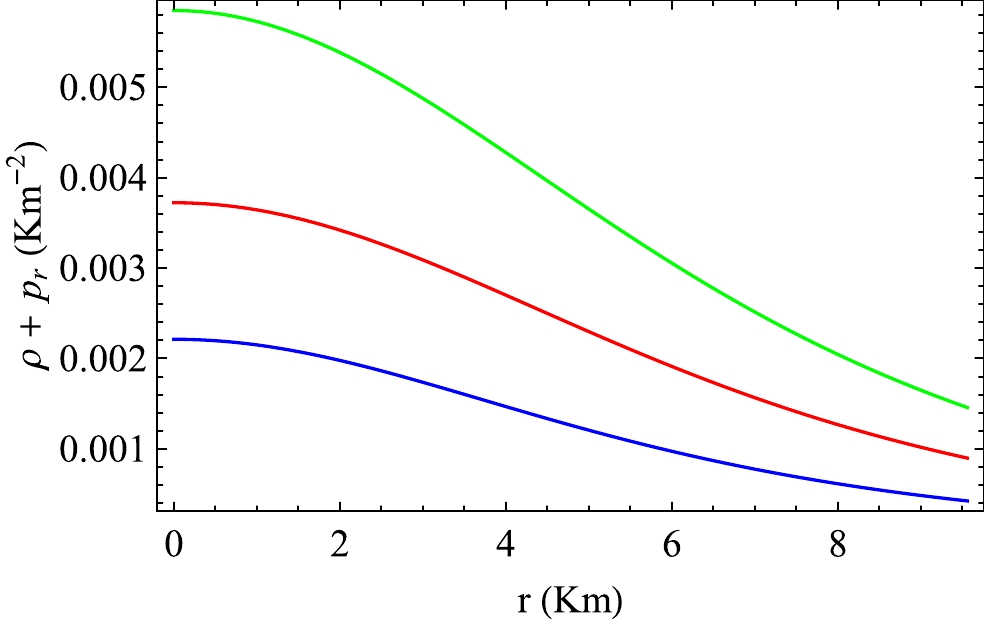
Figure 18. (color online) Variation in
$ (\rho+p_{r}) $ with r in VELA X1 for$ \alpha=0.3 $ and$ \beta=0.1 $ . Here, the blue, red, and green lines correspond to$D=4,~ 5$ , and$ 6 $ , respectively. -
To check the stability of a compact object, we can apply the following methods.
1. Stability criteria from the Tolman-Oppenheimer-Volkoff (TOV) equation.
2. Stability criteria from the cracking conditions given by Herrera.
3. Variation in the adiabatic index.
-
The generalized TOV equation [23, 88] in the presence of a charge is given by
$ -\frac{M_{G}(\rho+p_{r})}{r^2}{\rm e}^{\frac{(2\mu-2\nu)}{2}}-\frac{{\rm d}p_{r}}{{\rm d}r}+\sigma\frac{q}{r^2}{\rm e}^{\frac{2\mu}{2}}+\frac{2}{r}(p_{t}-p_{r})=0, $

(45) where
$ M_{G} $ denotes the effective gravitational mass and is defined as$ \begin{array}{*{20}{l}} M_{G}(r)=r^{2}{\rm e}^{(\nu-\mu)}\nu^{\prime}. \end{array} $

(46) The criterion of equilibrium for a charged anisotropic fluid is described by Eq. (45). If we denote the gravitational force as
$ F_{g} $ , anisotropic force as$ F_{a} $ , hydrostatic force as$ F_{h} $ , and electrostatic force as$ F_{e} $ , then Eq. (45) can alternatively be expressed as$ \begin{array}{*{20}{l}} F_{g}+F_{a}+F_{h}+F_{e} = 0, \end{array} $

(47) where
$ \begin{array}{*{20}{l}} F_{g} = \nu^{\prime}(\rho+p_{r}), \end{array} $

(48) $ F_{a} = \frac{2}{r}(p_{t}-p_{r}) = \frac{2}{r}\Delta, $

(49) where the expression for Δ is given in Eq. (11).
$ F_{h} = -\frac{{\rm d}p_{r}}{{\rm d}r}, $

(50) and
$ \begin{array}{*{20}{l}} F_{e} = \sigma E {\rm e}^{\frac{2\mu}{2}}, \end{array} $

(51) where the charge q and charge density σ are given in Eqs. (26) and (27), respectively.
Now, using Eqs. (47) — (49), we graphically show the radial variations in
$ F_g $ ,$ F_h $ ,$ F_e $ ,$ F_a $ , and the total force$ F=F_{g}+F_{h}+F_{e}+F_{a} $ for a particular choice of charge anisotropy$ \alpha=0.5 $ and for space-time dimensions$ D=4 $ and$ 5 $ for two stars, namely VELA X1 and 4U 1608-52. The plots are shown in Figs. 21 and 22. We note that the model presented here is in static equilibrium for the combined effect of forces$ F_{g} $ ,$ F_{h} $ ,$ F_{e} $ , and$ F_{a} $ . Thus, our model satisfies the TOV equation. From Figs. 21 and 22, we can conclude that$ F_{g} $ dominates over$ F_{h} $ ,$ F_{e} $ , and$ F_{a} $ . We also note that the sum of$ F_{h} $ ,$ F_{e} $ , and$ F_{a} $ is equal to the value of$ F_{g} $ at all radial points interior to the stars. The values of$ F_{g} $ and$ F_{h} $ are zero at$ r=0 $ and then increase along the radial direction away from the center, attain a maximum value at any intermediate point interior to the compact objects, and eventually decrease up to the surface. From Figs. 21 and 22, we also observe that$ F_{e} $ and$ F_{a} $ increase monotonically from the center to the surface of the compact objects. To plot the graphs, we have obtained the value of B from Table 7 for VELA X1 and from Table 10 for 4U 1608-52. -
According to Herrera [89], anisotropic stellar configuration must be stable with respect to the small variation in its physically relevant parameters, which is known as the "Herrera cracking condition." For any stable configuration, Herrera showed that the inequalities
$ 0\leq v_r^2 \leq1 $ and$ 0\leq v_t^2 \leq1 $ must be satisfied throughout the interior of a compact star, where$ v_{r}^2 $ and$ v_{t}^2 $ represent the squares of the radial and tangential sound velocities, respectively. To check the Herrera cracking condition, we show the radial variations in$ v_r^2 $ and$ v_t^2 $ for the two stars VELA X1 and 4U 1608-52 in Figs. 23 and 24, respectively, in the presence of a charge. We observe that the Herrera cracking condition is satisfied in this model.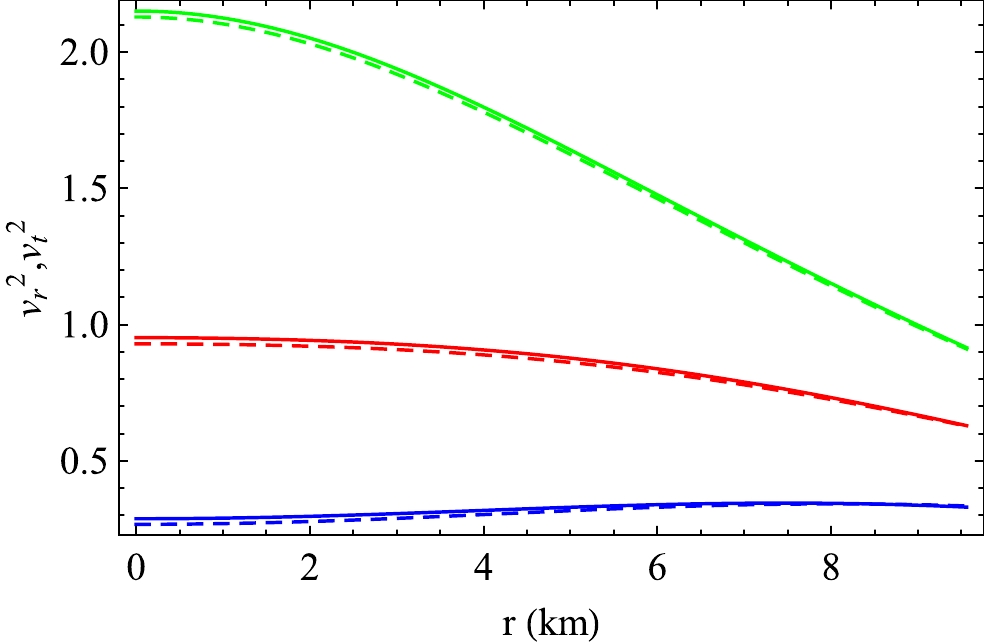
Figure 23. (color online) Variation in
$ v_r^2 $ and$ v_t^2 $ with radial distance r in VELA X1. The solid and dashed lines represent plots of$ v_r^2 $ and$ v_t^2 $ , respectively. The blue, red, and green lines correspond to dimensions$D=4,~ 5$ , and$ 6 $ , respectively.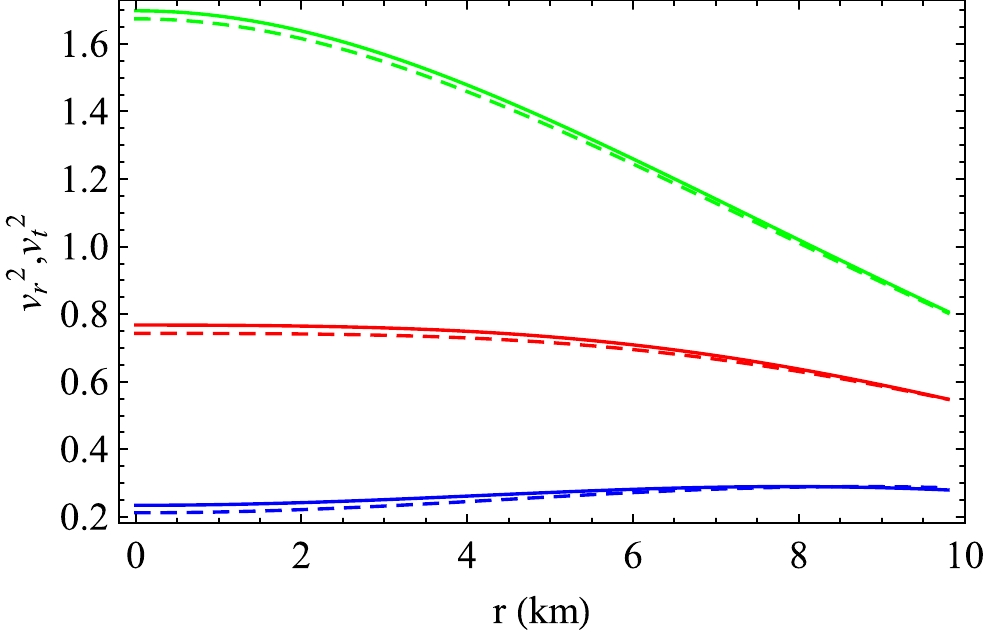
Figure 24. (color online) Variation in
$ v_r^2 $ and$ v_t^2 $ with r in 4U 1608-52. The solid and dashed lines represent plots of$ v_r^2 $ and$ v_t^2 $ , respectively. The blue, red, and green lines correspond to dimensions$D=4,~ 5$ , and$ 6 $ , respectively.Subsequently, Abreu et al. [90] predicted that a stellar configuration is considered to be stable if the squares of the radial
$ (v_{r}^2) $ and tangential$ (v_{t}^2) $ sound velocities satisfy the following criteria:$ \begin{array}{*{20}{l}} 0 \le |v_{t}^{2}-v_{r}^2| \le 1. \end{array} $

(52) Figures 25 and 26 show the differences in the squares of the tangential
$ (v_{t}^2) $ and radial$ (v_{r}^2) $ sound velocities for VELA X1 and 4U 1608-52, respectively. From Figs. 25 and 26, we observe that Abreu's inequality condition given in Eq. (52) is satisfied from the center to the surface of the stellar configuration. Therefore, we can conclude that our model is stable. -
The adiabatic index (Γ) is also an important factor for the stability of charged anisotropic fluid spheres and is expressed as
$ \Gamma=\frac{\rho+p_{r}}{p_{r}}\frac{{\rm d}p_{r}}{{\rm d}\rho}=\frac{\rho+p_{r}}{p_{r}}v_{r}^{2}. $

(53) In their paper, Heintzmann and Hillebrandt [91] showed the criterion for any stable stellar configuration. They showed that Γ must be greater than
$ 1.33 $ .In Figs. 27 and 28, we graphically show the radial variation in Γ for space-time dimensions
$ D=4, 5 $ , and$ 6 $ and for a particular charge anisotropy$ \alpha=0.5 $ for VELA X1 and 4U 1608-52, respectively. From Figs. 27 and 28, we observe that Γ is greater than$ 1.33 $ in the interior for VELA X1 and 4U 1608-52. Therefore, we may conclude that our model follows the stability criteria. -
To study the stability criteria of a stellar configuration against small amount of radial oscillation, we plot the frequency (
$ \omega^2 $ ) dependence of the Lagrangian perturbation of radial pressure at the surface of a star. In this context, we follow the procedure predicted by Pretel [92]. To simplify the problem, we consider the pressure isotropic condition ($ \beta=0 $ ). Two coupled equations that describe the infinitesimal radial mode of oscillation can be expressed in the following form:$ \frac{{\rm d}\chi}{{\rm d}r}=-\frac{1}{r}\left(3\chi+\frac{\Delta p_r}{\Gamma p_r}\right)+\frac{{\rm d}\nu}{{\rm d}r}\chi, $

(54) $ \begin{aligned}[b] \frac{{\rm d}(\Delta p_r)}{{\rm d}r}=&\chi \Bigg[\frac{\omega^2}{c^2}{\rm e}^{2(\mu-\nu)}(\rho+p_r)r-4\frac{{\rm d}p_r}{{\rm d}r}\\&-\frac{8\pi G}{c^4}(\rho+p_r){\rm e}^{2\mu}r p_r +r(\rho+p_r)\left(\frac{{\rm d}\nu}{{\rm d}r}\right)^2\Bigg]\\&-\Delta p_r\Bigg[\frac{{\rm d}\nu}{{\rm d}r}+\frac{4\pi G}{c^4}(\rho+p_r)r{\rm e}^{2\mu}\Bigg], \end{aligned} $

(55) where χ is the eigenfunction that is associated with the radial component of the Lagrangian displacement given by
$ \chi=\dfrac{\delta(r)}{r} $ . In this adopted procedure, χ is considered normalized such that its value at the center is 1 (i.e.,$ \chi(0)=1 $ ). Note that Eq. (54) has a singularity at the center ($ r=0 $ ). Therefore, to eliminate the singularity, the term containing the factor ($ \frac{1}{r} $ ) should vanish as$ r\rightarrow 0 $ . This essentially yields the following condition:$ \begin{array}{*{20}{l}} \Delta p_r = -3\Gamma \chi p_r \;\; as\;\; r\rightarrow 0. \end{array} $

(56) At the surface of the star (
$ r=b $ ), the Lagrangian perturbation of the radial pressure must vanish, i.e.,$ \begin{array}{*{20}{l}} \Delta p_r=0 \;\; as \;\; r\rightarrow b. \end{array} $

(57) In this paper, we consider different dimensions such as
$ D=4 $ ,$ 5 $ , and$ 6 $ , and the corresponding values of the bag constants are set as$ 80.02 $ ,$ 169.401 $ , and$ 274.845 $ $\rm MeV/fm^{3}$ for VELA X1 and$ 75.061 $ ,$ 156.794 $ , and$ 253.113 $ $\rm MeV/fm^{3}$ for 4U 1608-52; we then solve the coupled Eqs. (54) and (55) for different combinations of ω using the boundary conditions Eq. (56) and$ \chi(0)=1 $ . We plot$ |\Delta p_r(b)| $ against$ \omega^2 $ at the surface of the star in Fig. 29 for VELA X1 and Fig. 30 for 4U 1608-52. Here,$ |\Delta p_r(b)| $ is the absolute value of the Lagrangian change in radial pressure at the stellar surface. The correct values of normal mode frequencies are represented by the minima of these plots. From Figs. 29 and 30, we note that$ \omega_{n}^2>0 $ for all normal modes of oscillation of the stellar configuration. From the above analysis, we may conclude that the model considered here is stable against small radial oscillations. -
The tidal Love number (
$ k_2 $ ) is a parameter that measures the distortion of the shape of the surface of a compact object by an external perturbing gravity field. Tidal de-formability (Λ) is related to the tidal Love number through the following relation:$ k_2=\frac{3}{2}\Lambda\bigg(\frac{M}{b}\bigg)^5, $

(58) where M is the mass of compact object, and b its radius. Hinderer et al. [93] calculated the expression for the
$ l=2\; (even\; parity) $ tidal Love number, and it is given by$ \begin{aligned}[b] k_2=&\frac{8u^5}{5}(1-2u)^2[2+2u(g-1)-g]\times\bigg[2u[6-3g+3u(5g-8)] \\& +4u^3[13-11g+u(3g-2)+2u^2(1+g)] \\& +3(1-2u)^2[2-g+2u(g-1)]{\rm log}(1-2u)\bigg]^{-1}, \end{aligned} $

(59) where u is the compactness (=
$ \dfrac{M}{b} $ ), and$ g=\dfrac{bH^{'}(b)}{H(b)} $ . The expression of$ H(r) $ [94] is given by$ \begin{aligned}[b] H(r)=&c_1\left(\frac{r}{M}\right)^2\bigg(1-\frac{2M}{r}\bigg)\bigg[-\frac{M(M-r)(2M^2+6Mr-3r^2)}{r^2(2M-r)^2} \\& +\frac{3}{2}{\rm log}\bigg(\frac{r}{r-2m}\bigg)\bigg] + 3c_2\big(\frac{r}{M}\big)^2\bigg(1-\frac{2M}{r}\bigg). \end{aligned} $

(60) From the binary neutron star merger event GW170817, Abbott and Abbott [95] predicted some constraints on Λ. The article [96] describes that, for a star with a solar mass of
$ 1.4 $ , the tidal de-formability should be less than 800, i.e.,$ \Lambda<800 $ . In Table 11, the tidal Love number and tidal de-formability of three stars are tabulated for four and higher dimensions. Note that the tidal Love number ($ k_2 $ ) and tidal de-formability (Λ) have lower values when the space-time dimensions increase, and the results are consistent with the prediction proposed by Chakravarty et al. [97].$\rm Star$ 

$M /M_{\odot}$ 

$b /{\rm km}$ 

$ u=M/b $ 

D $ k_2 $ 

Λ VELA X1 1.77 9.56 0.2731 4 0.09209 40.418 5 0.03116 13.678 6 0.02650 11.622 4U 1608-52 1.74 9.8 0.2619 4 0.09902 53.589 5 0.03292 17.814 6 0.02796 15.132 EXO 1745-248 1.40 11 0.1877 4 0.19606 560.61 5 0.02590 74.063 6 0.02577 73.686 Table 11. Value of the tidal de-formability in our model within the parameter space used.
-
In this article, we have shown the relativistic solutions of the Einstein field equations for a class of charged strange quark stars with pressure anisotropy immersed in
$ (D-1) $ dimensional Euclidean space, where$ D\geq4 $ . We have considered that the metric ansatz, as proposed by Tikekar and Thomas [65], is constructed using two parameters: (i) spheroidal (λ) and (ii) curvature (R) parameters for the$ g_{rr} $ component. It$ (g_{rr}) $ is the functional form of radial coordinate r; we have solved the Einstein field equations to generate a physically viable relativistic model for stable strange quark star depending on λ, D, α, and β. Using these solutions, we have analysed the physical features of strange quark stars considering the EoS of the interior matter content described by the MIT bag model EoS,$ p=\frac{1}{3}(\rho-4B) $ . The value of B is selected in the range of$ 57.55<B<91.5 $ $\rm MeV/fm^3$ , which is necessary for bulk de-confined phase of stable strange quarks relative to iron [7]. We have noted some interesting results. The central density is observed to be independent of charge, although the star contains a net amount of charge. For a physically viable stellar model, the square of radial sound velocity$ ({v_{r}}^{2}) $ should be non-negative and causal, i.e.,$ {v_{r}}^{2}{\leq}1 $ , which places restrictions on the reduced radius ($ \dfrac{b}{R} $ ) as given in Table 1, and we observe that the reduced radius depends on the parameters λ, D, α, and β. However, effect of charge on reduced radius is less significant when$ \lambda \geq 11 $ and$ D \geq 6 $ . The gaps in Table 1 indicate that such combinations are not allowed in this model. Mass-radius plots are shown in Fig. 1. From Fig. 2, we also observe that the model is stable against gravitational collapse. For the uncharged case$ (\alpha=0) $ , our model satisfies the result previously obtained by Saha et al. [77]. We have evaluated the maximum mass and radius of a strange quark star for a given value of bag constant (B). The effect of dimensions on maximum mass is shown in Fig. 3, which shows that the maximum mass has the largest value in$ D=5 $ in the presence of a charge. In calculating the maximum mass, the square of radial sound velocity$ (v_{r}^{2}) $ is assumed to be maximum at the center, for which the causality condition should be obeyed throughout the star, and they are tabulated in Table 2. From Tables 4 and 5, we observe that the value of the maximum mass and radius increases with the increase in the net charge. However, the maximum mass and radius both decrease with the increase in B. Fig. 4 shows the variation in the maximum mass with the spheroidal parameter$ (\lambda) $ . We have observed an interesting result that enables the the maximum mass to approach a fixed value when λ is sufficiently large. As a result, the maximum mass does not depend on the geometry of space-time if the spheroidicity is large. For$ D=4 $ ,$ 5 $ , and$ 6 $ , the asymptotic values of maximum masses are 2.98$ M_{\odot} $ , 3.14$ M_{\odot} $ , and 2.14$ M_{\odot} $ , respectively, when$ B= $ 57.5$\,\rm MeV/fm^3$ . However, when$ B= $ 91.5$\rm MeV/fm^3$ , the corresponding maximum masses are 2.36$ M_{\odot} $ , 2.49$ M_{\odot} $ , and 1.69$ M_{\odot} $ . We have also determined the maximum allowed values of charge anisotropy parameter α and pressure anisotropy parameter β and corresponding values of$ E^2 $ and Δ and are also tabulated in Table 3 for which physically viable stellar model may be possible. Maximum masses corresponding to maximum allowed values of charge anisotropy ($\alpha_{\rm max}$ ) and pressure anisotropy ($\beta_{\rm max}$ ) are tabulated in Tables 4 and 5 for three dimensions$ D=4 $ ,$ 5 $ , and$ 6 $ . We observe that in$ 4 $ ,$ 5 $ , and$ 6 $ dimensions, the allowed values of maximum masses are 3.221$ M_{\odot} $ , 4.564$ M_{\odot} $ , and 4.814$ M_{\odot} $ , respectively, when$ B= $ $ 57.55 $ $\rm MeV/fm^3$ . However, when$ B= $ $ 91.5 $ $\rm MeV/fm^3$ , the corresponding values of the maximum mass are 2.554$ M_{\odot} $ , 3.618$ M_{\odot} $ , and 3.816$ M_{\odot} $ . All these limits of maximum mass lie below the maximum mass of 5$ M_{\odot} $ as predicted by Sabbadini and Hartle [98]. Figure 5 indicates that maximum mass increases with α in four and higher dimensions. The maximum surface redshifts are tabulated in Tables 4 and 5 for two different values of B, and we have noted that the maximum allowed value of the surface redshifts is in agreement with the value$(Z_s)_{\rm max} \leq 5.2$ as predicted by Ivanov [52]. The generalized Buchdahl limit in higher dimensional space-time as predicted by Ponce de Leon and Cruz [83] is also satisfied in our model. To study the physical viability of our present model, we consider two different stars, namely VELA X1 with an observed mass of$ M=1.77 M_{\odot} $ and radius of$b=9.56\; \rm km$ [84] and 4U 1608-52 with$ M=1.74 M_{\odot} $ and$b=9.8\; \rm km$ [87]. Figures 6–10 show the radial variations in physical parameters such as ρ,$ p_r $ ,$ p_t $ , Δ,$ E^2 $ for strange quark star VELA X1, respectively. In this model, we have predicted the mass of VELA X1 for different dimensions D, bag constants B, and charge anisotropies α (Table 6) when observed radius is selected as the input parameter. In Table 7, we have shown the predicted radius of VELA X1 with the observed mass as the input parameter. Thus, the observed mass or radius may be predicted for particular choice of D, B, and α, as shown in Tables 6 and 7. The predicted mass and radius of 4U 1608-52 are tabulated in Tables 9 and 10, respectively. We have noted one interesting result in that a correlation exists between$ E^2 $ and the bag constant (B), for which we may predict the mass of a compact object when its radius is fixed, and this is shown in Figs. 11 and 14 for VELA X1 and 4U 1608-52, respectively. We observe from Figs. 12 and 15 that Δ approaches a constant value when λ is large. From Figs. 13 and 16, we also observe that when λ is large the value of$ E^2 $ merges towards a constant value, and the effect of charge is less significant when λ is large. The energy conditions are shown in Figs. 17–20 for VELA X1. From these figures, we can conclude that all the necessary energy conditions are satisfied in the present model. The stability of the model is examined using (i) the TOV equation in generalized form, (ii) the Herrera cracking condition, and (iii) the adiabatic index. From Figs. 21–28, we observe that the necessary stability criteria for stellar structure are satisfied in our model. In addition, we have also studied the graphical nature of Lagrangian perturbation of radial pressure ($ |\Delta p_{r}(b)| $ ) at the surface of stars using the square of frequency of normal modes of oscillations. We observe from Figs. 29 and 30 for VELA X1 and 4U 1608-52, respectively, that all the normal mode frequencies are positive, implying that the model is stable against small radial perturbations. The constraints on the spheroidal parameter λ are determined in different dimensions and are shown in Figs. 31 and 32. In this model, we have determined the value of energy per baryon ($ E_B $ ), and we observe that$E_B < 930.4\; \rm MeV/fm^3$ in$ D=4 $ , but in higher dimensions ($ D\ge5 $ ),$E_B > 930.4 \rm MeV/fm^3$ within the parameter space used here. This may be because we have considered the surface value of B with the constraint of zero pressure condition. However, in the star, B may have a lower value as the pressure is not zero; hence, the existence of a stable strange quark matter core may be possible surrounded by metastable or unstable strange quark matter in higher dimensions. Such a structure may be explained using the concept of density dependence of B, which will be discussed elsewhere. We have evaluated the tidal Love number ($ k_2 $ ) and tidal de-formability (Λ) within the parameters space used in our model and tabulated them in Table 11. We observe that the constraints on the tidal de-formability (Λ) lie below the maximum allowed value of 800 ($ \Lambda<800 $ ) as predicted by Bauswein et al. [96] from the binary neutron star merger gravitational wave event GW170817 of 1.4$ M_{\odot} $ compact star.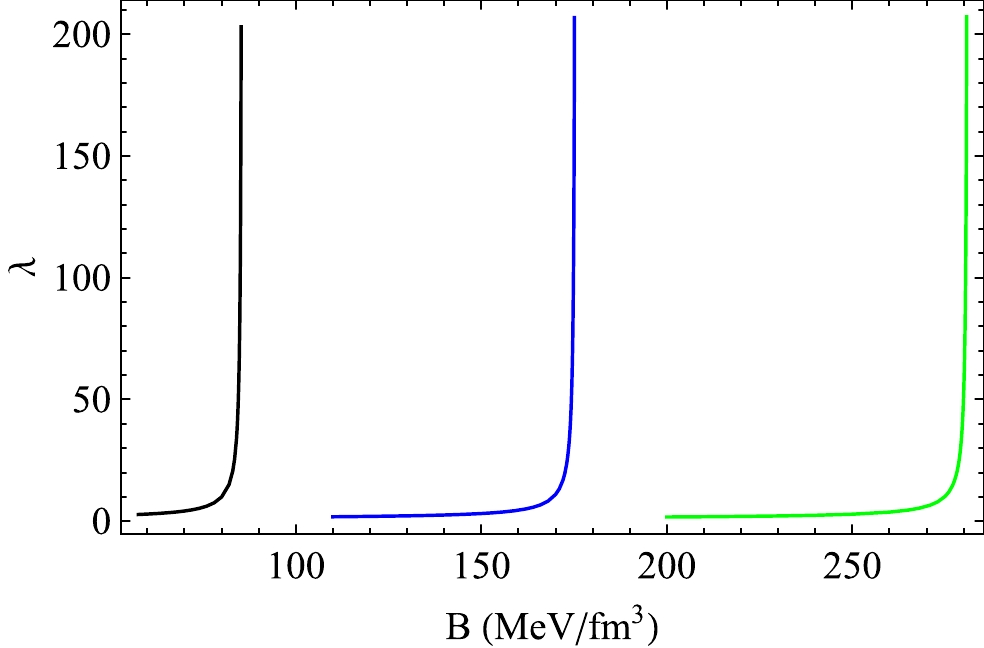
Figure 31. (color online) Variation in spheroidal parameter (λ) with B, for which the observed mass and radius of VELA X1 may be predicted. The black, blue, and green colors represent
$ D= $ 4, 5, and 6, respectively.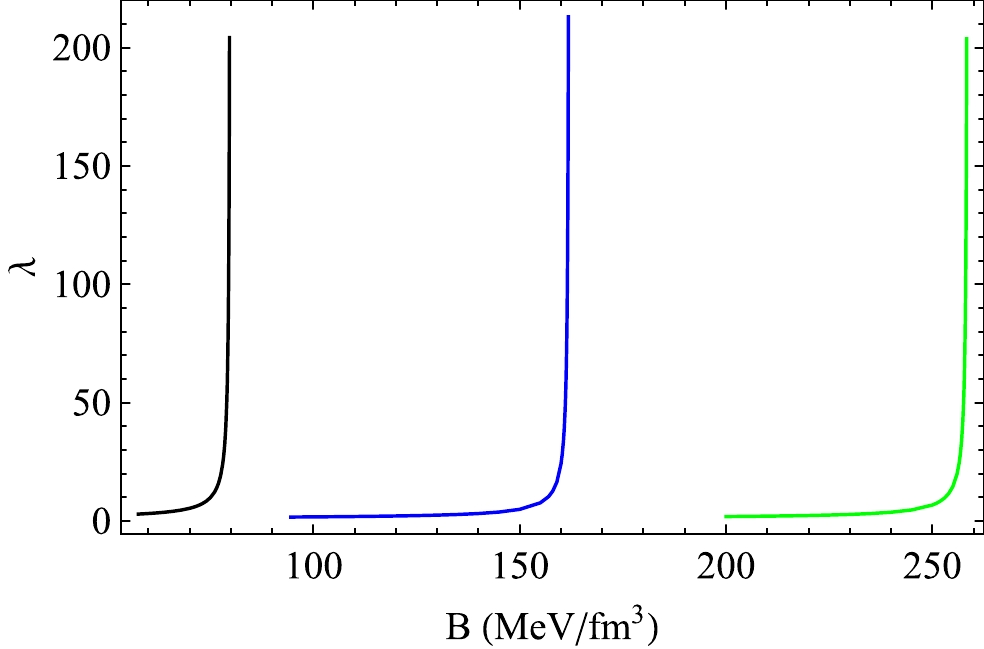
Figure 32. (color online) Variation of spheroidal parameter (λ) with B for which observed mass and radius of 4U 1608-52 may be predicted. Black, blue, and green colors represent
$ D= $ 4, 5 and 6 respectively.In summary, our study has predicted some important features of the stellar structure of strange quark stars in presence of pressure anisotropy, charge, dimensions
$ D\ge4 $ , and bag constant B constraint within the range required for stable strange quark stars. A wide range of observed masses and radii of stable strange quark stars may be predicted using the parameters space used here. -
KBG is grateful to CSIR for providing fellowships vide no: 09/1219(0004)/2019 EMR-I. BD is also grateful to CSIR for providing fellowships vide no: 09/1219(0005)/2019 EMR-I.
Maximum mass of anisotropic charged strange quark stars in a higher dimensional approach (D ≥ 4)
- Received Date: 2022-07-18
- Available Online: 2023-01-15
Abstract: In this article, a new class of solutions of Einstein-Maxwell field equations of relativistic strange quark stars obtained in dimensions


 Abstract
 HTML
HTML Reference
 Related
 PDF
PDF


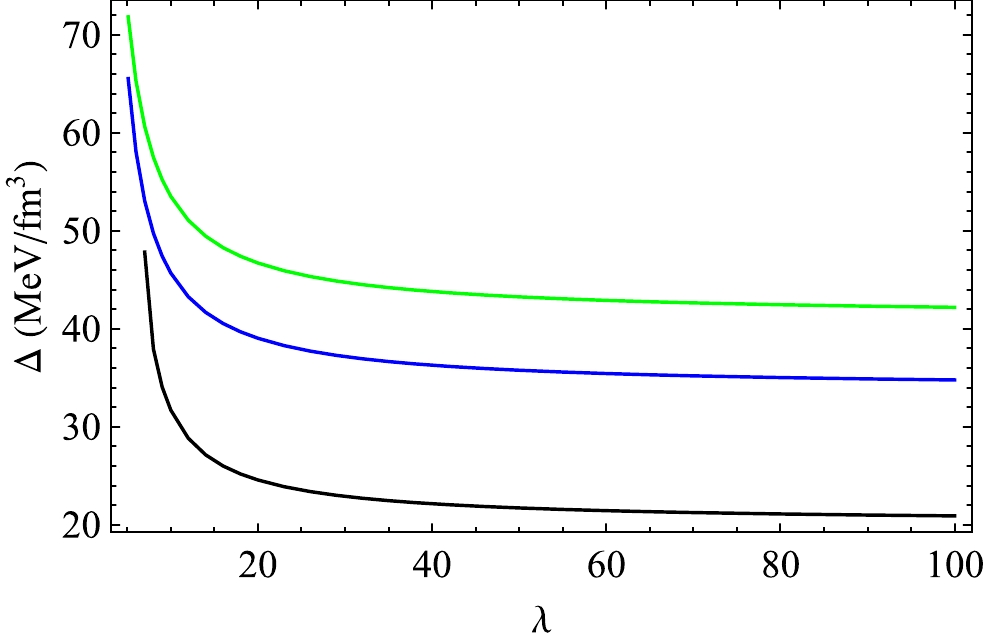
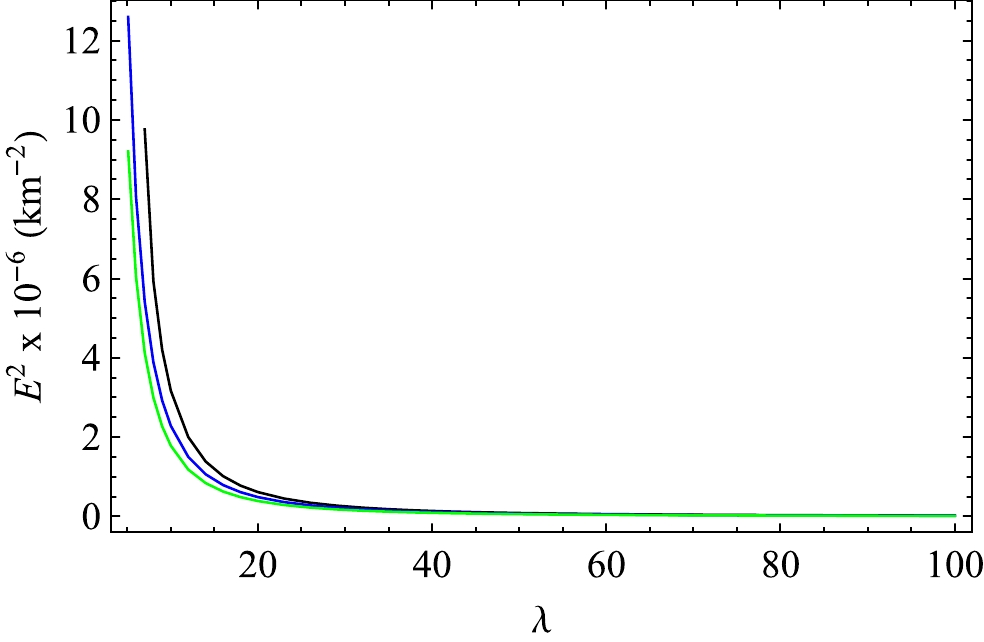
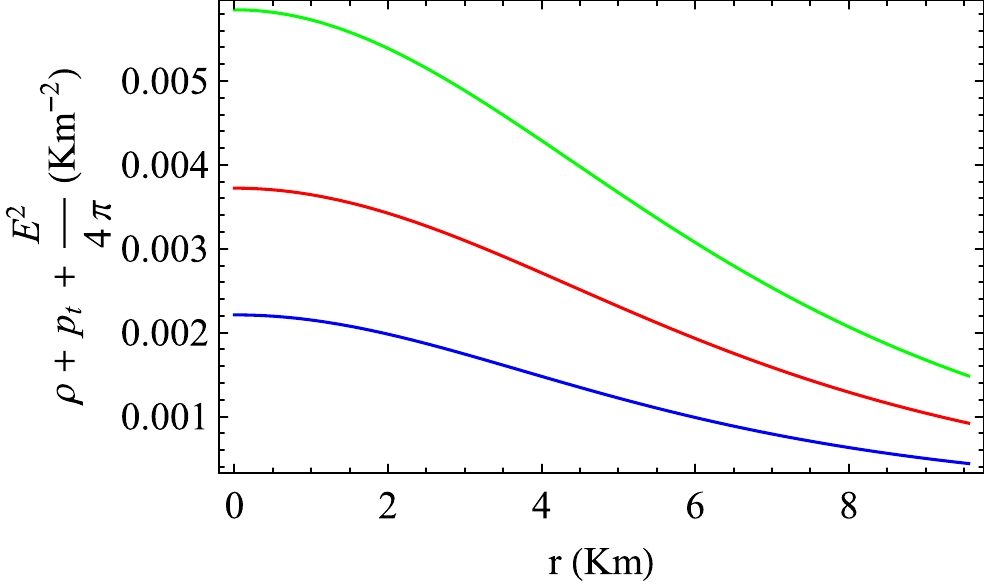
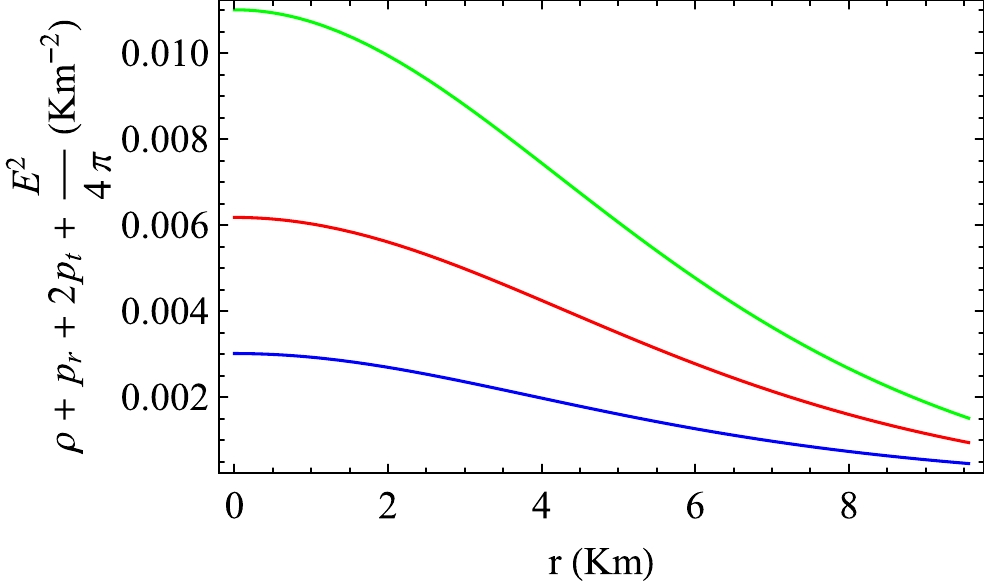
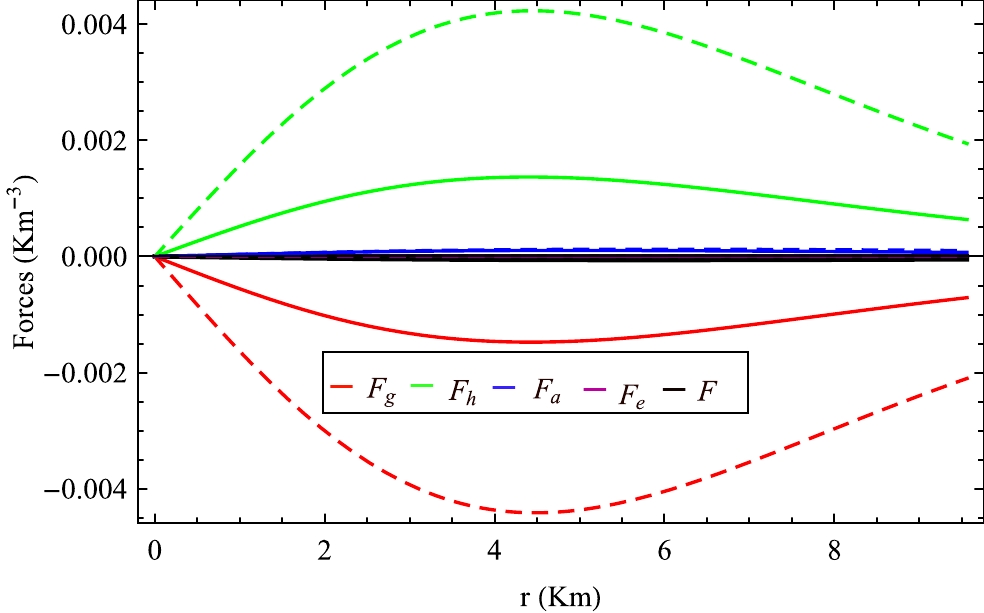

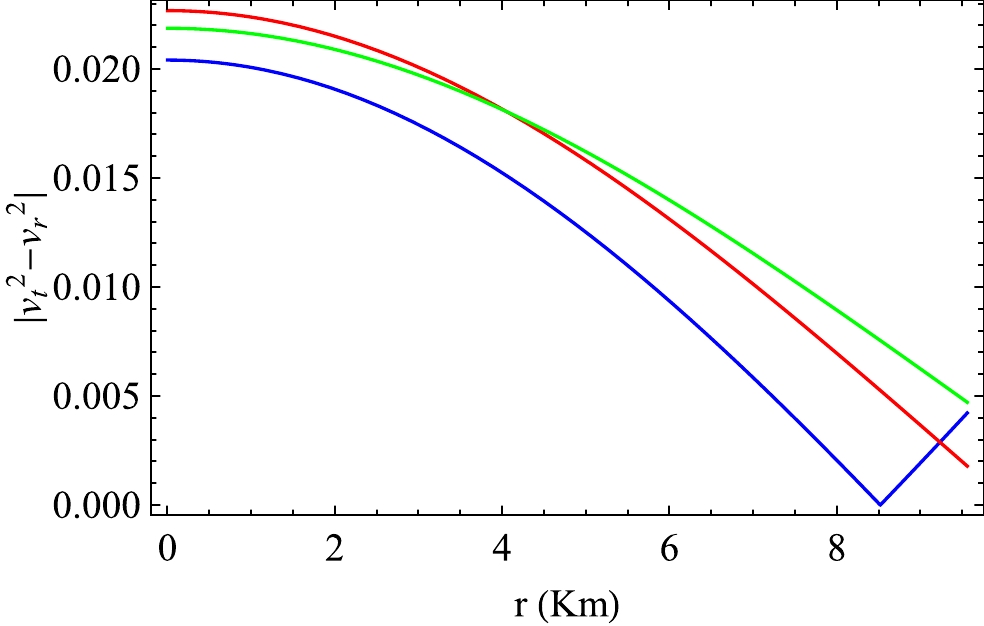
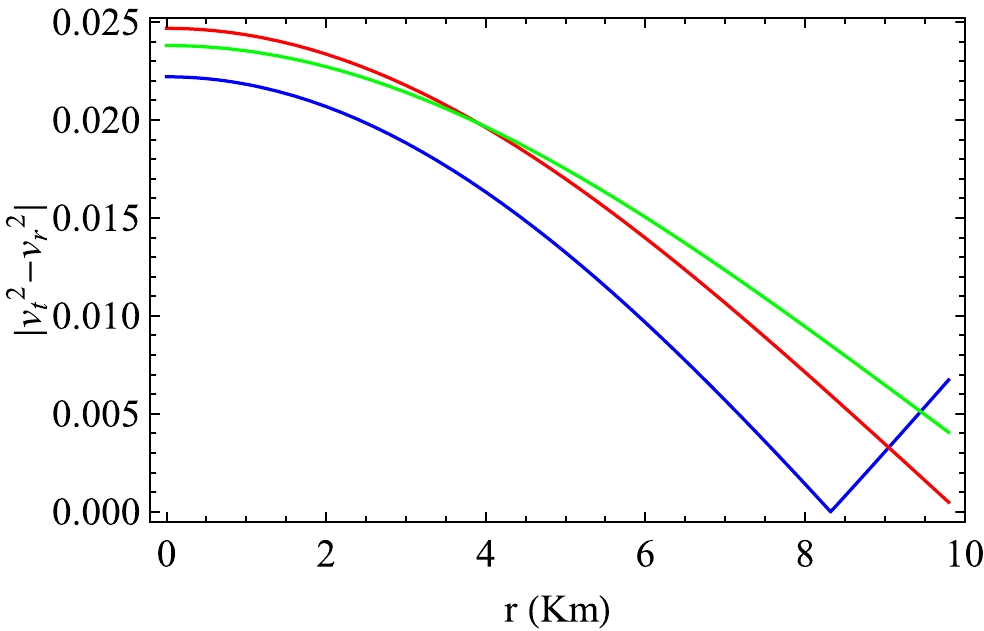
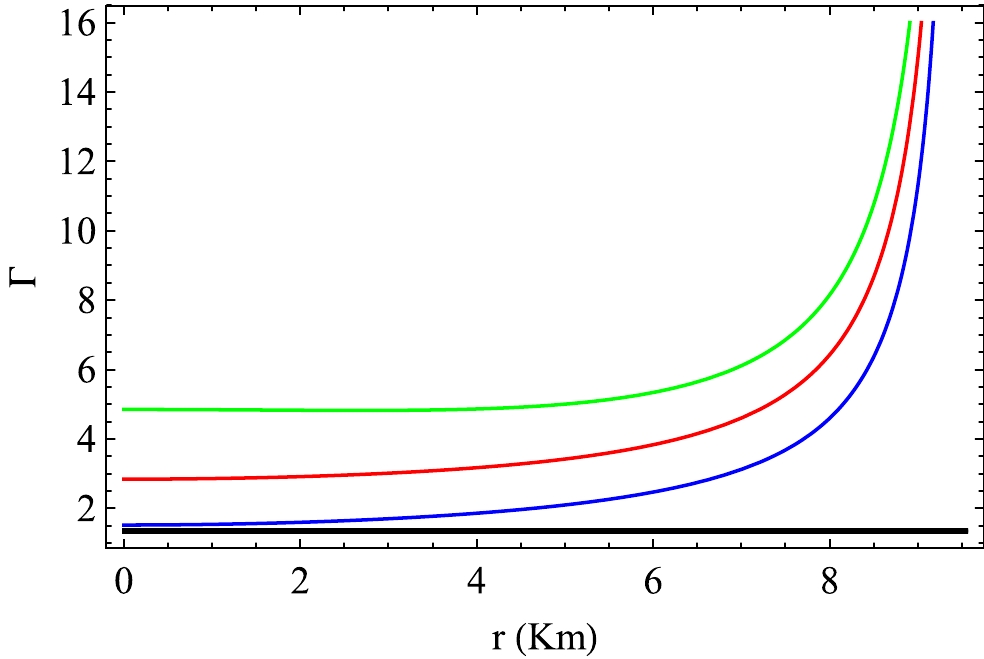
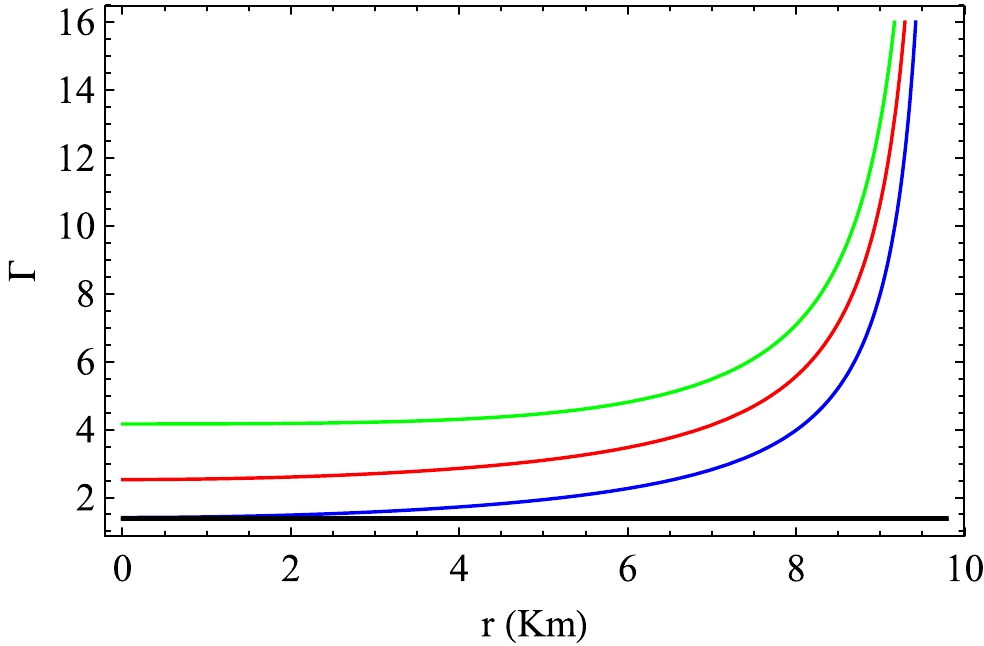
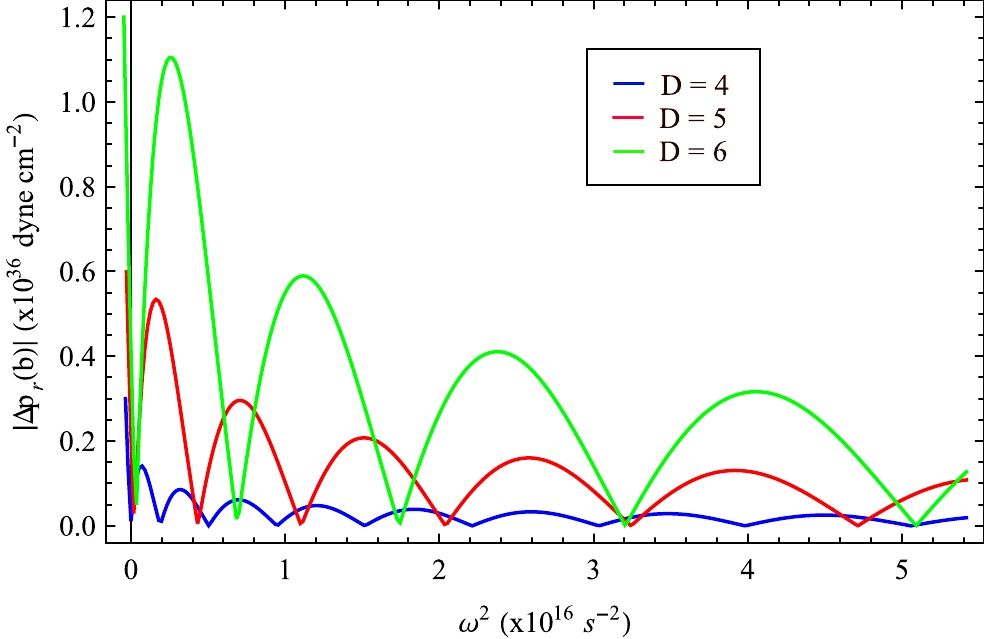


 DownLoad: