-
Gamma ray bursts (GRBs) are some of the most powerful explosions in the universe and can last from 10 ms to several hours as prompt emissions, releasing most of their energy in the form of photons from 30 keV to a few MeV. The properties of GRBs mainly include two components of temporal and spectral information. First, from the perspective of the temporal property, its prompt phase has a bimodal duration distribution separated at
$ t\sim 2 $ s, indicating that there are two different groups, that is, long GRBs (LGRBs) with$t_{\rm LGRB} > 2\ s$ and short GRBs (SGRBs) with$t_{\rm SGRB} < 2\ s$ [1, 2]. LGRBs are likely formed by the collapse of massive star cores [3, 4], whereas SGRBs are thought to originate from the coalescence of compact binary systems, such as binary neutron stars (BNSs) and neutron star-black hole (NS-BH) systems [5−7]. The associated events GW170817/ GRB170817A [8] from a BNS merger make the assumption grounded that BNS mergers are sources (or parts of the sources) of SGRBs. For spectral properties, a two-component structure has been revealed above tens of MeV. At low energy, an experiential Band-function can describe observations well [9, 10], which is possibly induced by the synchrotron radiation process [11−14]. At high energy, the model predicts that another component generated from the inverse-Compton (IC) process should exist [15−18]. In the past few decades, great achievements have been made in experimental measurements studying temporal and spectral characteristics. It is evident that the measurements are relatively rich at low energy, but observations in the TeV band are more desirable.A milestone was reached in the observation of γ-ray emissions in the TeV band in recent years. The Major Atmospheric Gamma Imaging Cherenkov (MAGIC) and High Energy Stereoscopic System (H.E.S.S.) experiments discovered very high energy (VHE) γ-ray emissions in GRB190114C and GRB180720B [19, 20]. Following these observations, the H.E.S.S. experiments detected photons with energies of up to 4 TeV from GRB190829A, during 4 hr to 56 hr after the trigger time [21]. Moreover, the brightest GRB221009A was recently observed in a multi-band. It is exciting that the most energetic photons can reach 18 TeV [22], as detected by the Large High Altitude Air Shower Observatory (LHAASO). This new discovery opened the observation window of the γ-ray emissions of GRBs in the TeV band and confirmed the new radiation mechanism expected by the model, known as the IC process [15−18]. These discoveries shined a new light on the central engine and radiation mechanism and probed potential new physics, such as Lorentz invariance violation (LIV) and dark matter (DM) [23−25]. It is unfortunate that the γ-ray emissions at TeV energies have only been observed at the afterglow phase of LGRBs. No prompt emission has yet been observed for GRBs at this energy band, let alone SGRBs. Despite this, TeV γ-ray emissions from SGRBs can play very important roles in exploring LIV, which is the hypothesis of several theories of quantum gravity, benefiting from the short duration of SGRBs. Therefore, scientists are highly anticipating γ-ray observation results in the TeV energy region.
Space-borne and ground-based experiments have both contributed to setting limits on LIV. GRB090510 is a typical bright SGRB among high-energy observations, with a photon observed at 31 GeV arriving 0.829 s after the trigger of the Fermi-GBM. This SGRB provides conditions to constrain the LIV effect and provides a lower limit for the linear modification of the photon dispersion relationship, that is,
$E_{\rm QG, 1} > 1.49\times10^{19} \ \text{GeV}$ [26], which is the best lower limit. However, only one photon was detected above 10 GeV by the Fermi-LAT in this work [26], and an event number with high statistics is better for confirmation of this important result. The shortage of space-borne experiments includes a limited effective area of$ \sim $ 1$ m^2 $ , which leads to insufficient sensitivity in the high-energy range. Imaging atmospheric Cherenkov telescope (IACT) experiments have high sensitivity above an energy of 100 GeV; however, the fatal weakness is their field of view (FOV), with a value of only several degrees [27−29]. However, the Cherenkov Telescope Array (CTA) will detect prompt emissions from SGRBs when they are slewed to the source before BNS mergers [30]. The traditional arrays of CR detectors, such as the High-Altitude Water Cherenkov (HAWC) and LHAASO, have good performance above TeV energy and a wide FOV, but these arrays cannot be compared with IACT detectors in the 100 GeV energy range. The optimal choice is an IACT with a wide FOV, such as the High Altitude Detection of Astronomical Radiation (HADAR) project. Therefore, it is necessary to know the detection capability of SGRBs for the HADAR experiment. In this study, the annual detection rate based on a set of pseudo-SGRB samples is generated and checked with the observations of space-borne experiments.This paper is organized as follows: First, we provide a brief introduction to the HADAR experiment and its performance parameters in Section II. Then, to predict the detection rate of SGRBs with HADAR as reliably as possible, we model the pseudo-SGRBs and the detecting process considering the performance of the detectors of both the Fermi-GBM (for a consistency check) and HADAR. The simulation methods and results are presented in Sections III and IV, respectively. In Section IV, we also describe the simulation of the observational results of GRB090510 in HADAR's case, given as a light curve considering LIV effects. In Section V, we describe the conclusion of our findings.
-
The HADAR project is proposed for construction in YangBaJing, Tibet of China, at an altitude of
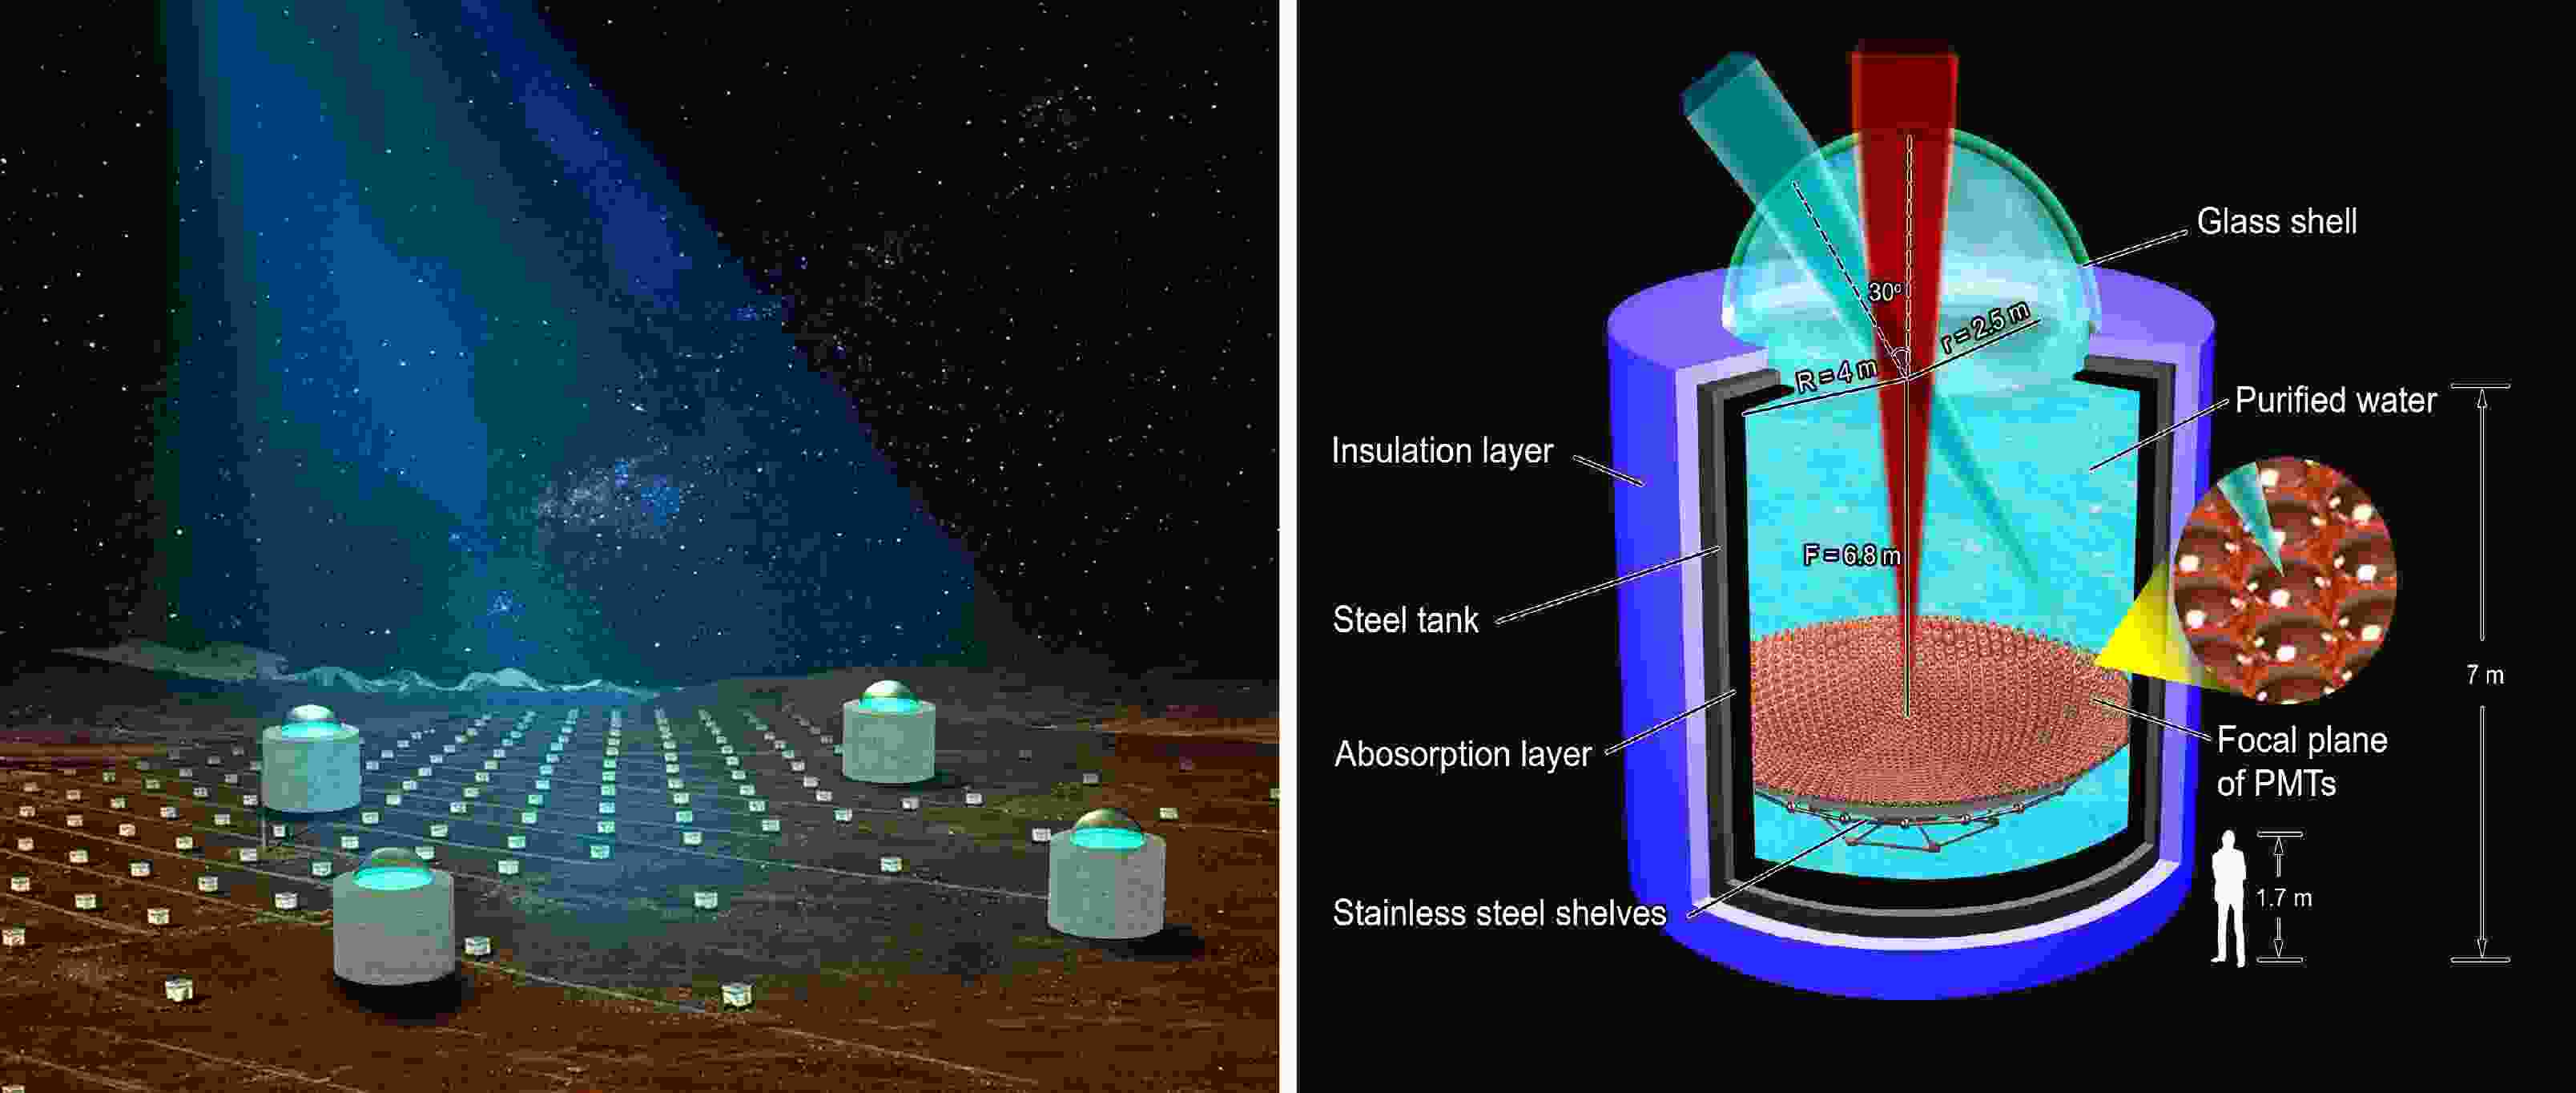
$ 4300 \ \text{m} $ . As shown in Fig. 1, this project has a hybrid array, which includes the two parts: water lenses and traditional scintillators.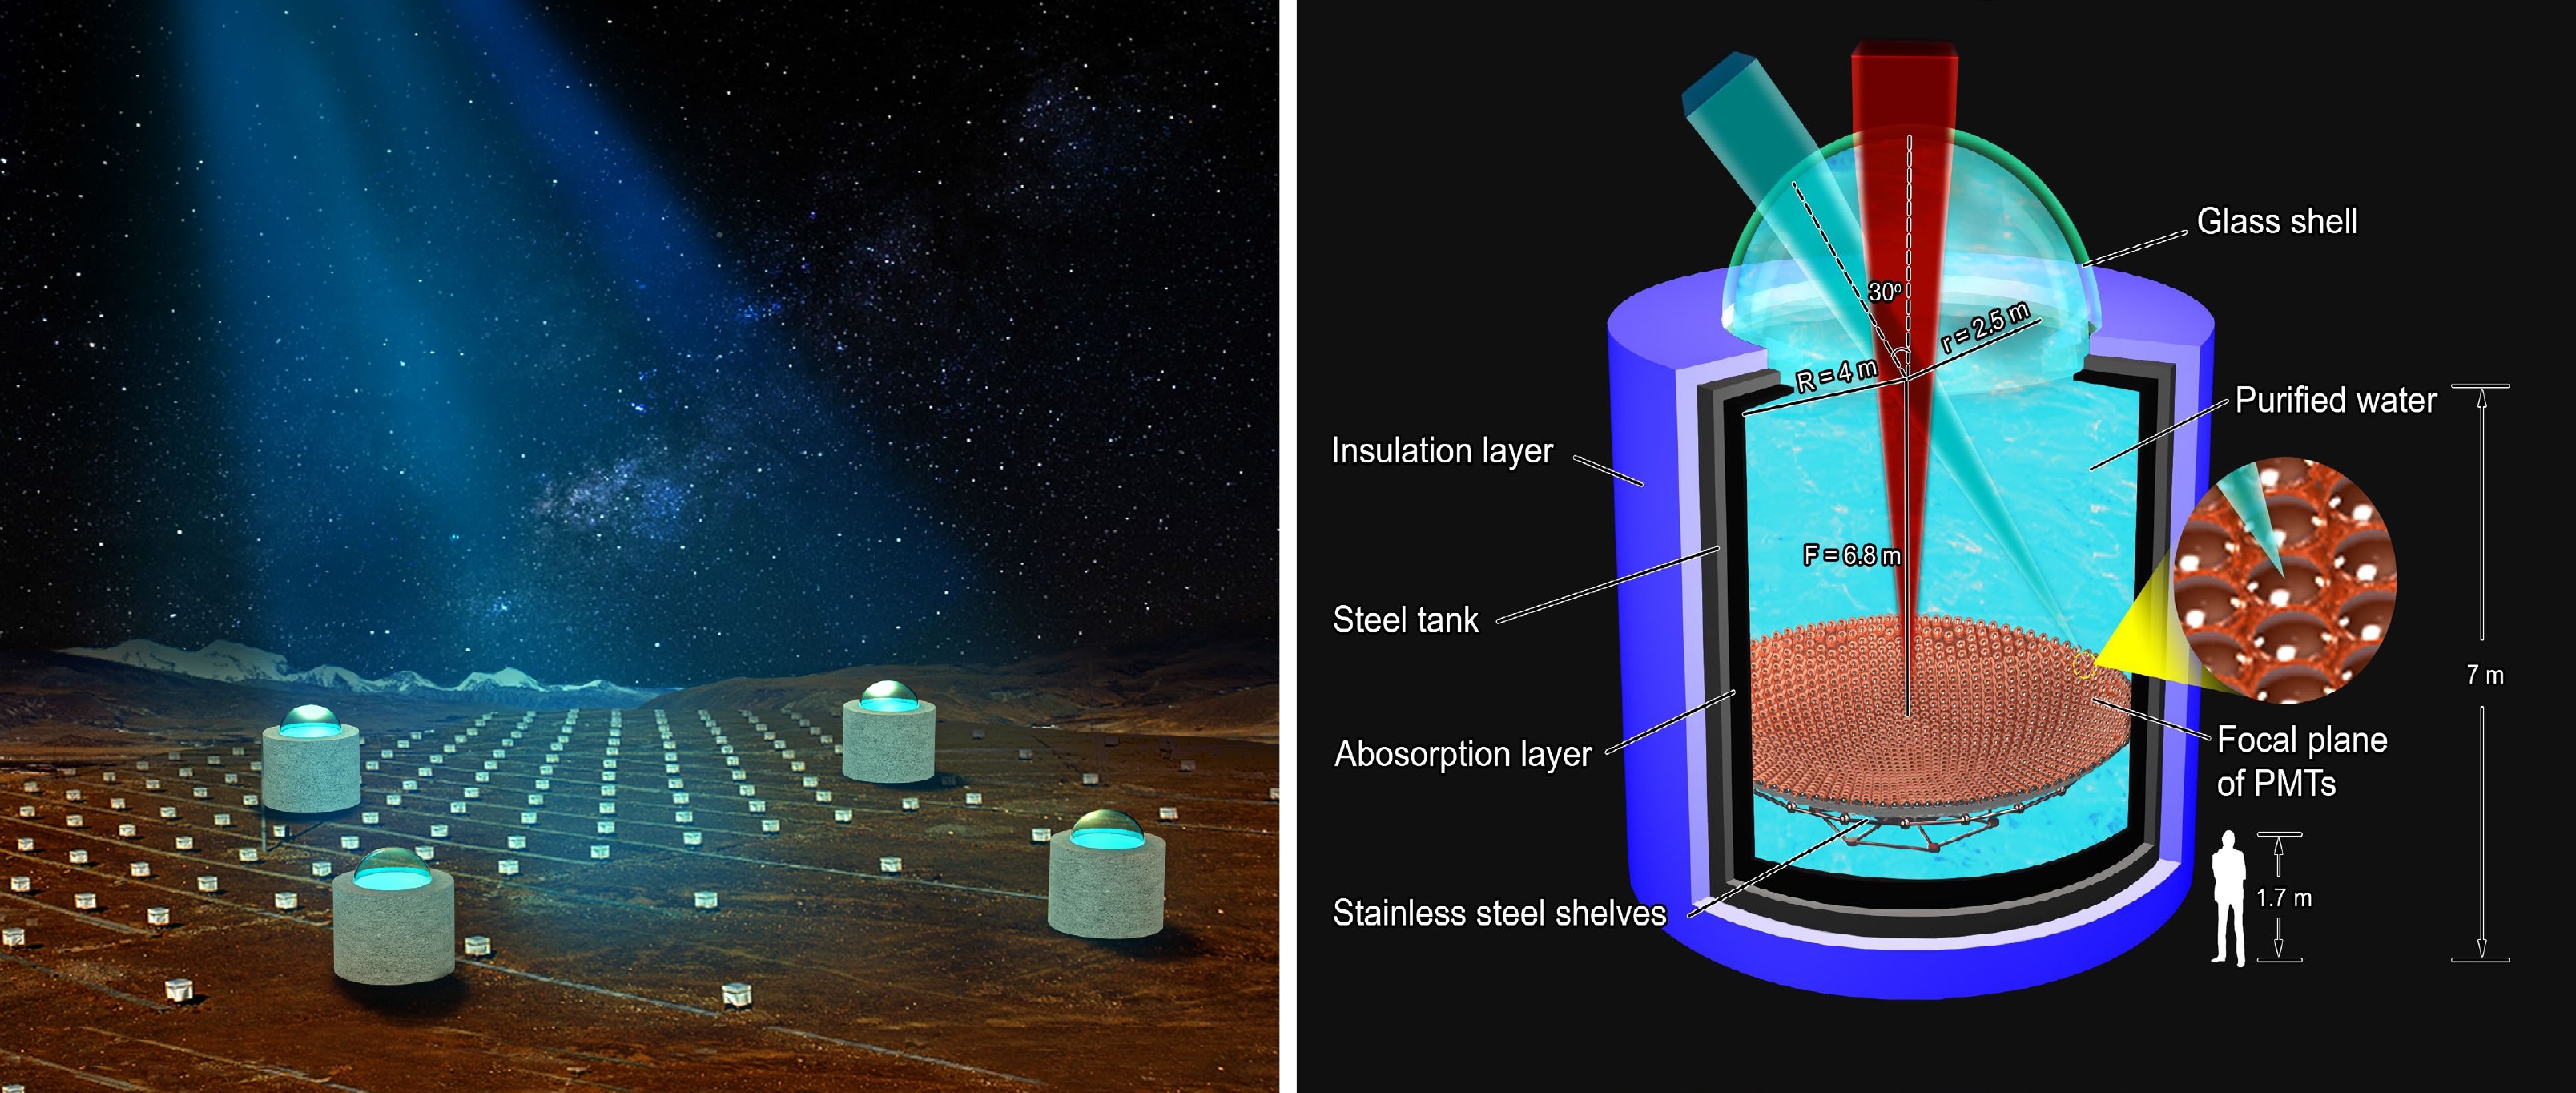
Figure 1. (color online) HADAR project [31]. Left: Layout of the HADAR array with water lenses. Right: Profile design of each telescope.
The water lens array is composed of four of the same telescopes. The diameter of each lens is 5 m, the distance between two lenses is 100 m, and the four lenses form a square. The right panel of Fig. 1 presents the detailed profile structure of a single water lens, which mainly consists of an acrylic spherical cap lens with a diameter of 5 m, a cylindrical tank with a radius of 4 m and a height of 7 m, and a camera with an array of 18, 961 photomultiplier tubes (PMTs), each 5 cm in diameter. A steel tank, which contains an absorption layer in the inside wall and a thermal insulation material coating on the outer wall, is filled with purified water to concentrate radiation emissions to the PMTs. The PMTs are placed in the focal plane of the lens and arranged as a series of concentric ring matrixes supported by a stainless-steel space frame. The water lens array is designed to focus on transient sources, such as GRBs and active galactic nuclei (AGNs), in the northern sky to measure primary γ-rays in the energy range from 10 GeV to 100 TeV. Owing to the properties of the water lens, it has an FOV of 0.84 sr (
$ 30^{\circ} $ field angle), which is almost one order of magnitude larger than that of IACTs such as H.E.S.S., MAGIC, and CTA [27−29]. It is more important that the effective area, angular resolution, and energy resolution at the 300 GeV energy can reach 10000 m$ ^2 $ , 0.5$ ^0 $ , and 20%, respectively, which is comparable to those of H.E.S.S. and MAGIC, except for the angular resolution. The water lens detection design can meet the observation requirements of our physical targets.The scintillator array is composed of 100 detectors and is designed to perform joint observations with a water lens. The installation and maintenance of a scintillator detector are simple, and such detectors can achieve long-term stable performance and good time resolution and are widely used in extensive air shower (EAS) arrays [32]. The frame structure is composed of stainless steel with an upside-down pyramidal shape, known as a box of light guide (BLG). The interfaces of a BLG are light-tight, with a reflective material, DuPont Tyvek, covering the inner surface with the purpose of significantly increasing the efficiency of light collection. A KD2000 plastic scintillator is adopted with dimensions of 1 m
$ \times $ 1 m$ \times $ 2 cm and placed on top of the frame. A PMT with a diameter of two inches is chosen and installed at the bottom. When charged particles induced by the primary CRs pass through the scintillator, photons are generated. Some of these photons can be refracted several times in the BLG, and some finally reach and are collected by the PMT. The main function of the scintillator detector is to measure the coincidence with the water lens and confirm the performance of the water lens.Following the methods of H.E.S.S. and CTA [33, 34], we can obtain the performance of HADAR, which includes the effective area, angular resolution, and point spread function (PSF). The effective area and angular resolution are shown in Ref. [35].
$ r_{80} $ is the radius of the circle around the center of gravity of the image, containing$80\%$ of the total intensity. In simulation,$ r_{80} $ for HADAR is 15 mm, and the focal length is 680 cm. Therefore, the PSF is 0.13 degrees. -
To estimate the detection rate of the prompt emissions from SGRBs for HADAR, we adopt a simulation method based on Monte Carlo. A set of SGRB samples is generated according to the phenomenological models of their intrinsic parameters, such as space density, luminosity, energy spectra, temporal duration, and extragalactic background light (EBL) attenuation. The expected detection rate is calculated using the spectra for each GRB and the HADAR sensitivity.
-
SGRBs are simulated with an isotropic distribution on the sky. The redshift distribution is used to generate the distance of the SGRBs. The redshift distribution describes the number of SGRBs per unit redshift bin
$ \mathrm{d}z $ per unit (observed) time$ \mathrm{d}t $ , which is expressed as [36]$ \begin{equation} \frac{\mathrm{d}N}{\mathrm{d}t\mathrm{d}z}=\frac{\dot{\rho}(z)}{1+z}\frac{\mathrm{d}V(z)}{\mathrm{d}z} \,, \end{equation} $

(1) where
$ \begin{equation} \frac{\mathrm{d}V(z)}{\mathrm{d}z}=\frac{c}{H_0}\frac{4\pi D_L^2}{(1+z)^2[\Omega_m(1+z)^3+\Omega_{\Lambda}]^{1/2}} \ . \end{equation} $

(2) In this study, we adopt
$ H_0 = 67.4\ \mathrm{km}\ \mathrm{s}^{-1}\ \mathrm{Mpc} $ ,$ \Omega_m = $ 0.315, and$ \Omega_{\Lambda} = 0.685 $ [37]. In addition,$ \dot{\rho}(z) $ is the event rate density at z (in units of$ \ \mathrm{Gpc}^{-3} \ \text{yr}^{-1} $ ), which is [38, 39]$ \begin{equation} \dot{\rho}(z)\propto(1+z)\int_{t_{\min}}^{t_{\max}}R_F[z_f(t_d, z)]P(t_d){\rm d} t_d , \end{equation} $

(3) where
$ P(t_d)\propto1/t_d $ ,$t_{\min}=20\ \mathrm{Myr}$ is the minimum delay time for a BNS system to evolve to merge,$t_{\max}$ is the age of the universe at the time of merging$ t(z) $ , and$ R_F[z_f(t_d, z)] $ is the star formation history (SFH), which is adopted from Ref. [40]. The relationship between z,$ z_f $ , and$ t_d $ is described in Eq. (4) below. We normalize the event rate density$ \dot{\rho}(z) $ with$ 1540^{+3200}_{-1220}\ \mathrm{Gpc}^{-3} \ \text{yr}^{-1} $ [8], which corresponds to the local event rate density at$ z = 0 $ .The delay time
$ t_d $ between the formation of the binary system$ t_f(z_f) $ and the age of the universe at the time of the merger$ t(z) $ is given as$ \begin{equation} t_d=\int_{z} ^{z_f}\frac{{\rm d} z'}{H_0(1+z')[\Omega_m(1+z)^3+\Omega_{\Lambda}]^{1/2}} \, , \end{equation} $

(4) where
$ z_f $ and z represent the redshifts at which the BNS systems form and merge, respectively. -
The luminosity of SGRBs can be parameterized as a broken power law, as widely adopted in other studies:
$ \begin{equation} \Phi(L) = A \left\{ \begin{matrix} \left(\dfrac{L}{L_c}\right)^{\alpha}, & L \le L_c \\ \left(\dfrac{L}{L_c}\right)^{\beta}, & L > L_c \end{matrix} \right. \end{equation} $

(5) where A is the normalization constant,
$ L_c $ is the break luminosity, and α and β are the power-law indices. Here, we adopt$ \alpha = -1.95 $ ,$\beta = -3,\;L_c = 2\times10^{52} \mathrm{erg}\ \mathrm{s}^{-1},$ $L_{\min} = 1\times10^{49} \ \mathrm{erg}\ \mathrm{s}^{-1}$ [41]. The luminosity function is used to generate the peak luminosity$ L_p $ . -
The prompt emission spectrum of GRBs may include two spectral components: a non-thermal Band component (Band) and a non-thermal power law component extending to high energies (Extra). In this study, we assume all of the pseudo-SGRBs have a Band + Extra spectrum.
The Band function is usually used to fit the spectrum of a GRB when the detector's energy band is sufficiently wide. The Band function is [9, 10]
$ \begin{eqnarray} N_{\rm Band}(E)=A_0 \begin{cases} \left(\dfrac{E}{E_0} \right)^{\alpha} \exp{\left(-E/E_p\right)}, & E \le E_c \\ \left(\dfrac{E_c}{E_0}\right)^{\alpha-\beta} \exp{(\beta-\alpha)}\left(\dfrac{E}{E_0}\right)^{\beta}, & E > E_c \end{cases} \end{eqnarray} $

(6) where
$ E_0=100 \ \mathrm{keV} $ ,$ E_c=(\alpha-\beta)E_p $ ,$ A_0 $ is the normalization constant in units of$ \mathrm{photons} \ \mathrm{s}^{-1} \ \mathrm{cm}^{-2} \ \mathrm{keV}^{-1} $ , which is detetermined by the average luminosity$L_{\rm ave}=0.31L_p$ [42], α and β are the low and high energy photon indices, respectively, and$ E_p $ is the peak energy of the spectrum. In this study, α and β are adopted from the observations of the Fermi-GBM [43], and$ E_p $ is determined by the$ E_p-L_p $ relationships examined in Ref. [44].Beyond the Band function, a high-energy and power law spectral component is necessary to fit the spectrum in certain GRBs [26, 45, 46]. The power law component is the dominant contribution to the high-energy prompt emission beyond tens of GeV. Here, we introduce the extra component for GRB spectra.
$ \begin{equation} N_{\rm ext}=B_0 \left (\frac{E}{E_0}\right) ^{\beta_{\rm ext}}, \end{equation} $

(7) $ B_0 $ is the normalization constant, similar to$ A_0 $ , which is determined by the luminosity of the extra power law spectrum$L_{\rm ext}$ . The luminosity ratio$R_{\rm ext} = L_{\rm ext} / L_{\rm ave}$ and photon index$\beta_{\rm ext}$ are used to describe the extra component.$L_{\rm ave}$ is the luminosity of the Band component. We take$R_{\rm ext} = 0.1$ and$\beta_{\rm ext} = 1.75$ by default. Therefore, in our study, the spectrum of SGRBs is expressed as$ \begin{equation} N(E) = N_{\rm Band}(E) + N_{\rm ext}(E), \end{equation} $

(8) Photons with high energies may be strongly attenuated because of internal absorption, the Klein-Nishina (KN) effect [47−49], and EBL absorption.
Following [31], an exponential cutoff on the spectrum is used to describe the internal absorption and KN effect:
$ \begin{equation} N_{\rm cut}(E)=N(E)\exp({-E/E_{\rm cut}}), \end{equation} $

(9) here,
$ E_{\rm cut} $ is the cutoff energy. The cases of 30 GeV, 50 GeV, 100 GeV, 1 TeV and no energy cutoff are considered.High-energy photons from distant astrophysical sources are subject to attenuation because of two-photon pair production with EBL. The spectrum with EBL attenuation is expressed as
$ \begin{equation} N_{\rm EBL}(E) = N(E)\exp(-\tau(E, z), \end{equation} $

(10) where
$ \tau(E, z) $ is the optical depth for the γ-rays at energy E. The EBL attenuation introduced in Ref. [35] is used by default.The spectrum considering EBL and the exponential cutoff is expressed as
$ \begin{equation} N_{\rm EBL+cut}(E) = N(E)\exp[-(\tau(E, z)+ E/E_{\rm cut})]. \end{equation} $

(11) Figure 2 shows the energy spectrum of the SGRBs, where EBL and the exponential cutoff are considered.
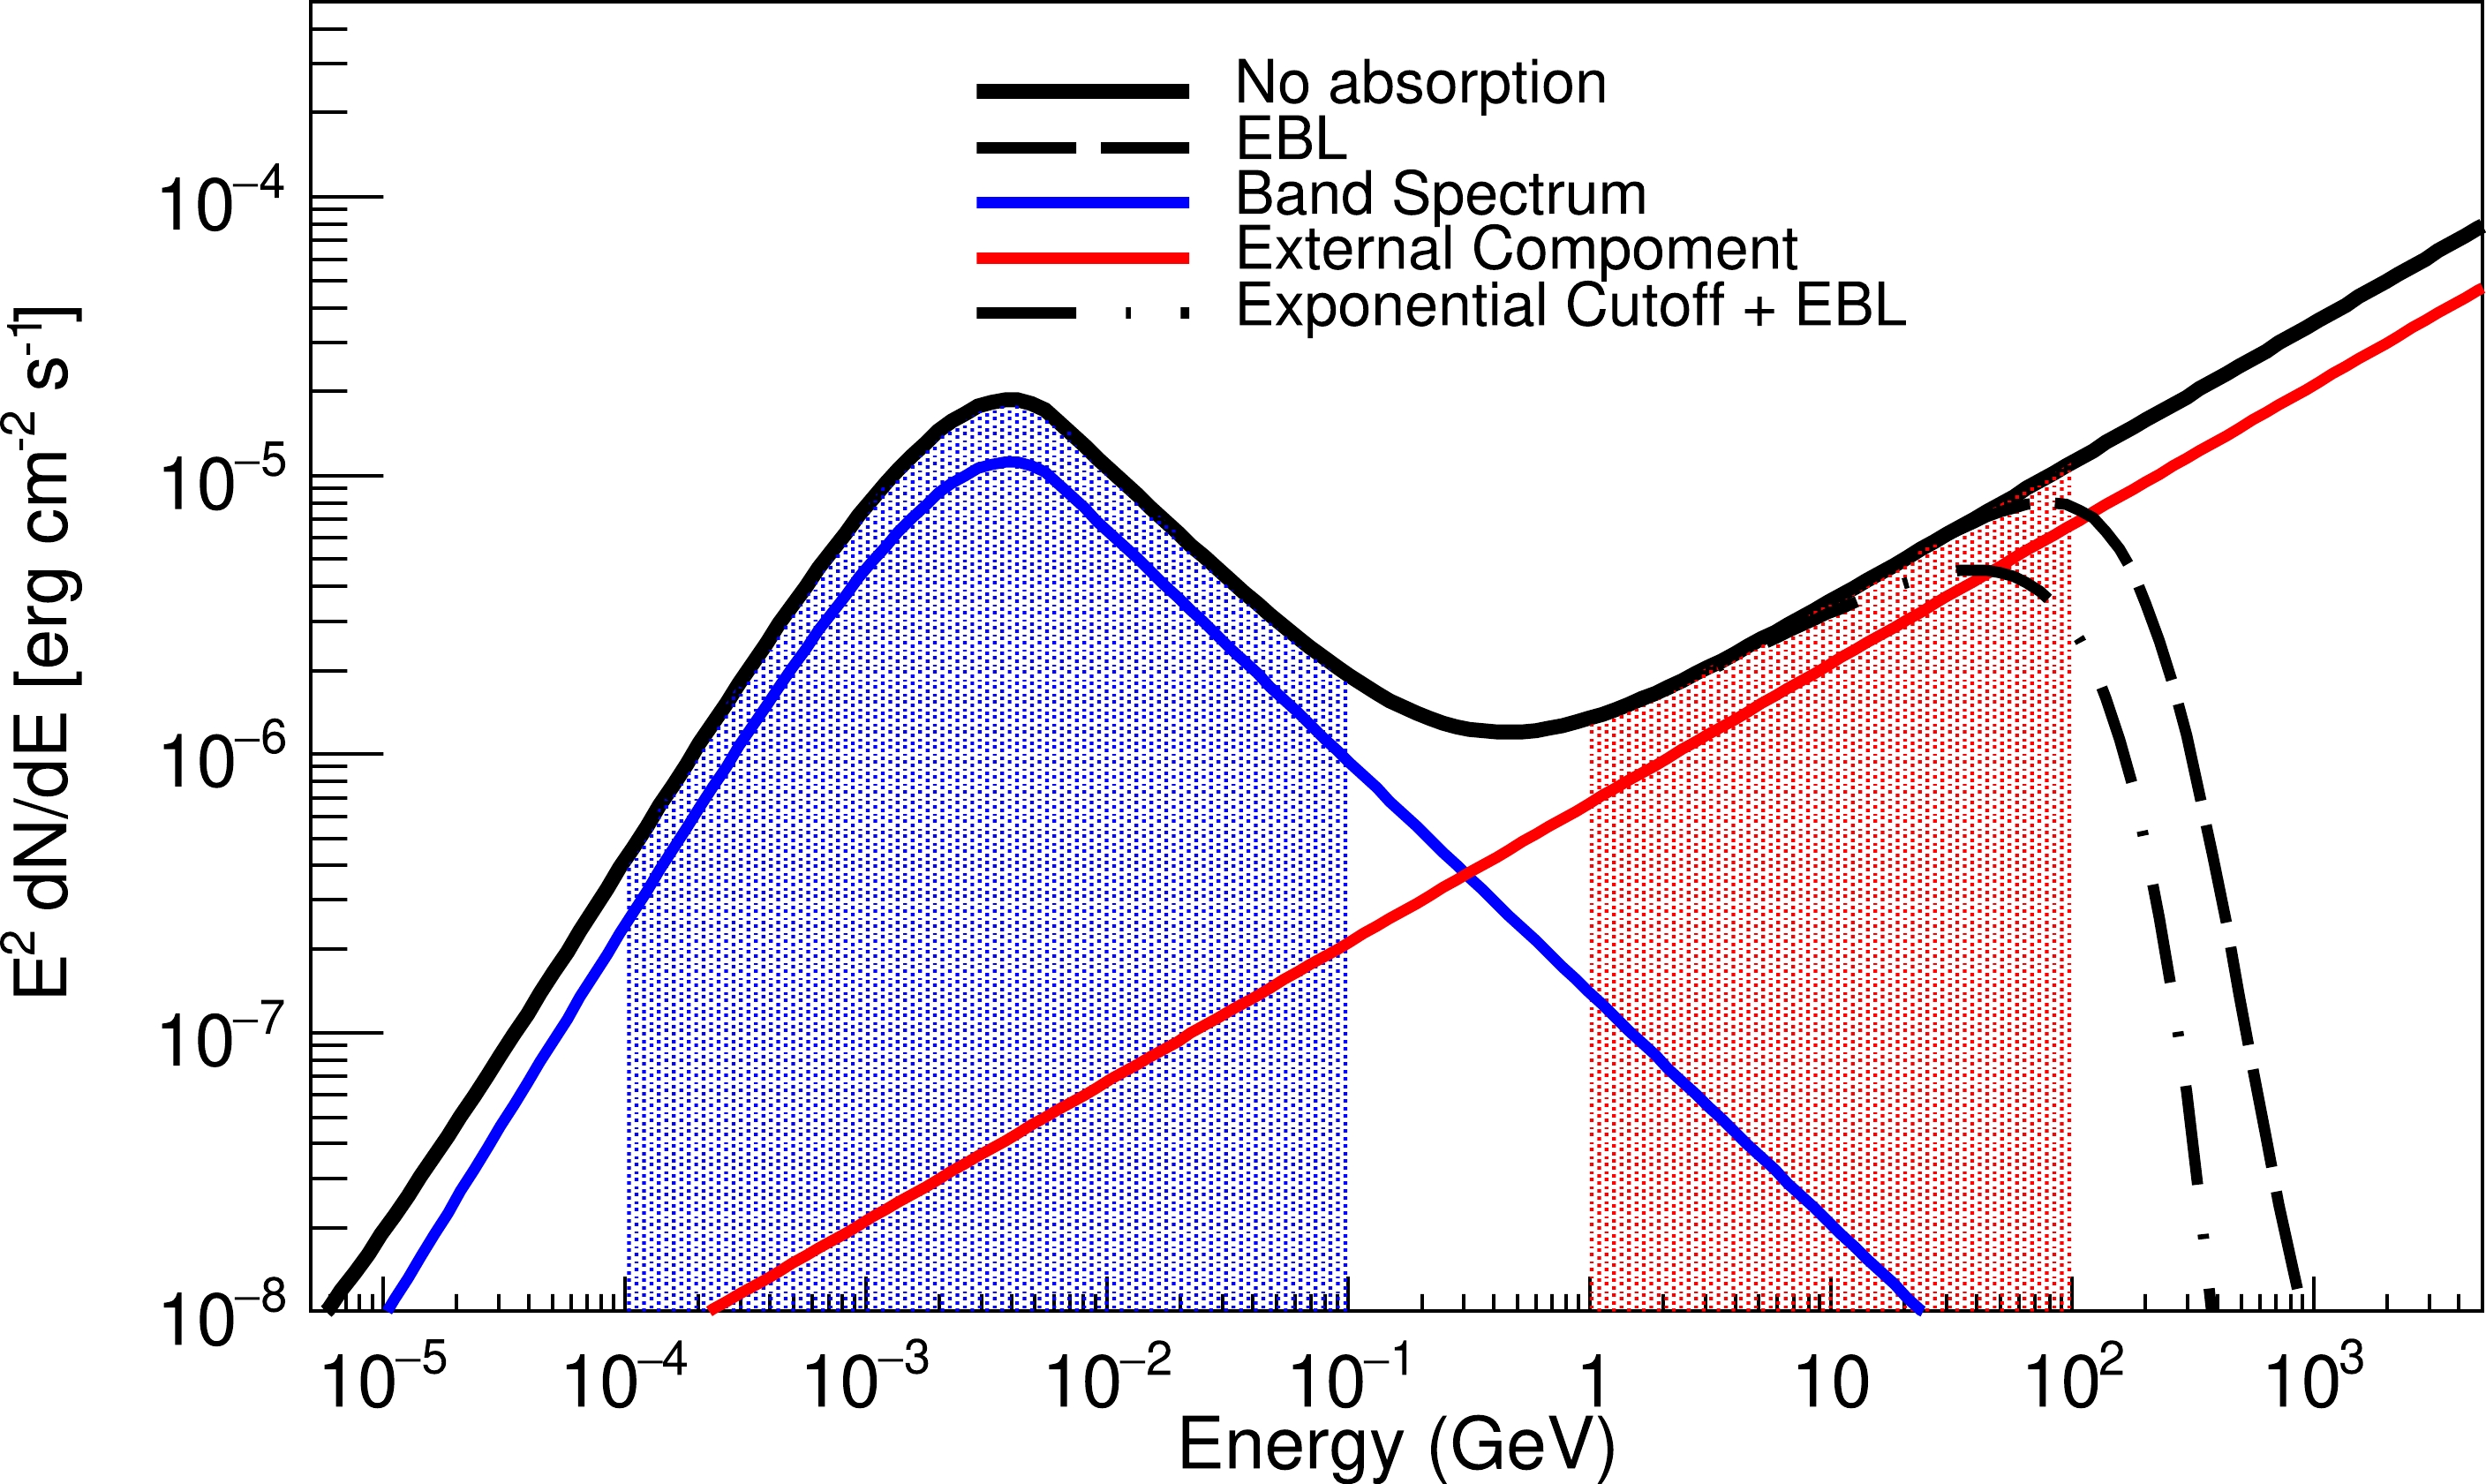
Figure 2. (color online) Energy spectrum of the Band function considering EBL and the exponential cutoff. The blue and red solid lines represent the spectra of the Band function and extra component, respectively. The dashed line represents the spectrum when considering the EBL absorption of Ref. [35]. The dotted line represents the spectrum considering the exponential cutoff and EBL. These are described in Eqs. (10) and (11). A redshift of z = 0.903 is adopted, and the cutoff energy is 100 GeV. The black lines are the sum of the Band function and extra component, which is described in Eq. (8). The values of
$ \beta_{\rm ext} $ and$ R_{\rm ext} $ are –1.5 and 0.1, respectively.$ R_{\rm ext} $ represents the ratio of the fluences in the energy ranges of 100 MeV to 100 GeV and 100 keV to 100 MeV, which are the red- and blue-shaded regions, respectively. To distinguish the individual components of the emission from the total combined flux, both the Band spectrum and extra component are scaled by 0.5. -
The duration of the GRBs is approximately estimated using
$ T_{90} $ , which corresponds to the time in which$90\%$ of the counts arrive.$ T_{90} $ is described as [42, 50]$ \begin{equation} T_{90}=(1+z)\frac{E_{\rm iso}}{L_{\rm ave}} \,, \end{equation} $

(12) where the isotropic energy
$E_{\rm iso}$ is calculated using [44]$ \begin{equation} E_{\rm iso} = 10^{51.42\pm0.15}\mathrm{erg} \left(\frac{E_p}{774.5 \;\mathrm{keV}} \right)^{1.58\pm0.28} \ . \end{equation} $

(13) The average luminosity
$ L_{\rm ave} $ is calculated using$ L_{\rm ave} = 0.31 L_p $ . -
Based on the preparations above, a group of GRBs can be constructed using Monte Carlo with the definite parameters
$ \left(\alpha, \beta, E_p, L_p, T_{90}, z \right) $ . Then, the sample is ready for a quality check with Fermi-GBM observations. The significance for every GRB is calculated based on the expected signal and background number, that is,$N_{\rm signal}$ and$N_{\rm bkg}$ , respectively. The signal can be obtained as$ \begin{equation} N_{\rm signal}=\int_{E_{\min}}^{E_{\max}}N_{\rm EBL}(E)T_{90}A_{\rm eff}^{\gamma}(E, \theta)\mathrm{d}E \,, \end{equation} $

(14) where
$ T_{90} $ is described in Eq. (12), and$N_{\rm EBL}(E)$ is the spectrum of the SGRB with EBL. If the exponential cutoff is considered, it will be replaced by$N_{\rm EBL+cut}(E)$ .$A_{\rm eff}$ is the effective area of the detector. For HADAR, the effective area is adopted from Ref. [31]. The integral limit$(E_{\min}, E_{\max})$ is the detector's energy band, which is$ (10\ \text{GeV}, 10\ \text{TeV}) $ for HADAR.For space-borne detectors such as the GBM,
$N_{\rm bkg}$ originates from cosmic γ background rates in the corresponding energy bands. For IACT,$N_{\rm bkg}$ results from the cascades of cosmic rays [31, 42]:$ \begin{equation} N_{\rm bkg}=\int_{E_{\min}}^{E_{\max}}S_p(E)T_{90}A_{\rm eff}^{p}(E, \theta)\Omega(E)\mathrm{d}E , \end{equation} $

(15) where
$ S_p(E) $ represents the spectrum of cosmic rays,$A_{\rm eff}^p$ is the effective area of HADAR corresponding to cosmic rays, and$ \Omega(E) $ is the solid angle corresponding to the angular resolution of HADAR. These are given in Ref. [31].A
$ 5\sigma $ deviation is required as a trigger, which is calculated as$N_{\rm signal}/\sqrt{N_{\rm bkg}} \ > 5$ . -
Data from of the Fermi-GBM is used to check our samples, and the detection rates of the Fermi-GBM, Swift-BAT, and Fermi-LAT are used to verify our detection rate. In the observational results of the Fermi-GBM, 395 SGRBs were observed over ten years. To evaluate the difference between our samples and this observation,
$\chi^2_{\rm tot}$ is calculated as$\sum \chi_i^{2}/\sum N_{i}^{\rm bin}$ , where i denotes$\alpha,\,\, \beta,\, \,E_p,\, z, \,T_{90}$ , and the fluence, and$N_i^{\rm bin}$ is the corresponding bin number. The total combined$\chi^2_{\rm tot}$ is 0.81.The
$\alpha, \,\beta,\, E_p,\, z,\, T_{90}$ , and fluence distributions of our phenomenological models and real observations are compared, as shown in Fig. 3. From Fig. 3, we find that our model results are roughly consistent with the real observations of the Fermi-GBM given the experimental uncertainties.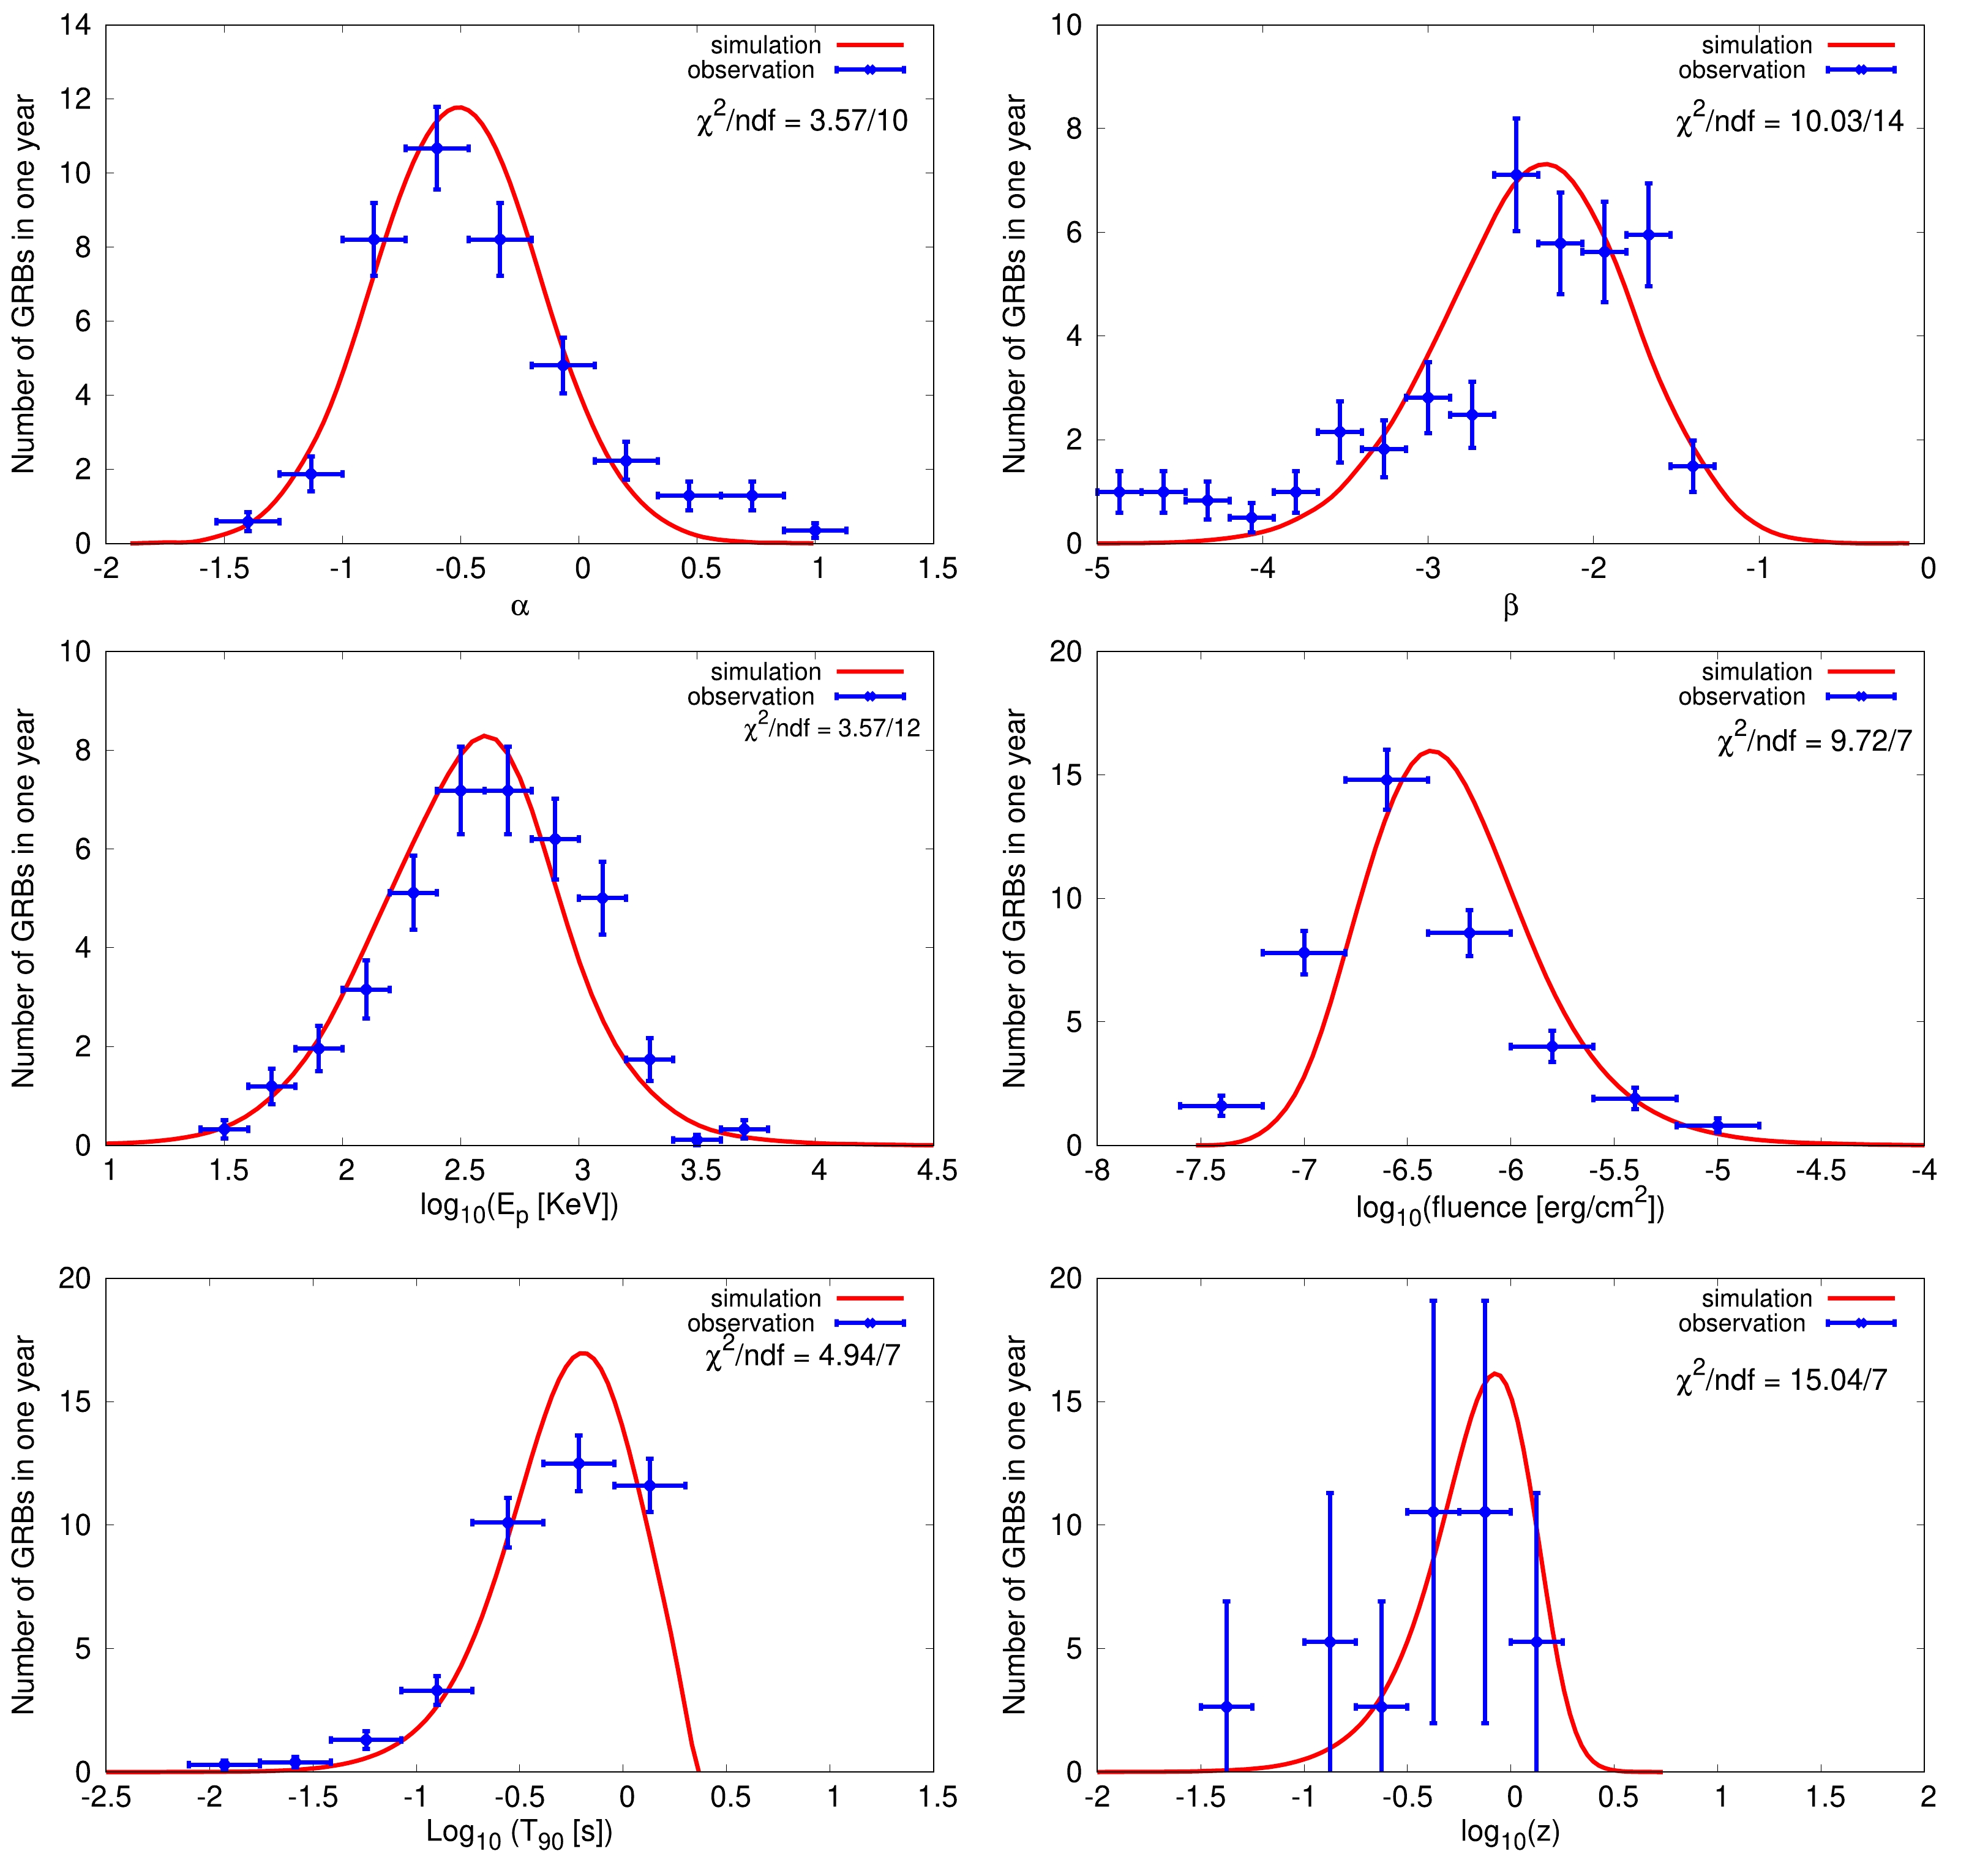
Figure 3. (color online) Model results of α (top left), β (top right),
$ E_p $ (middle left), fluence (middle right),$ T_{90} $ (bottom left), and redshift z (bottom right). The observation data is taken from the Fermi-GBM.Table 1 shows the real detection rates compared with simulated rates of the Fermi-GBM, Swift-BAT, and Fermi-LAT. Figure 4 shows the cumulative simulated detection rates as a function of detected photons. We find that at a low or high energy, our simulated detection rates are roughly consistent with the real detection rates
Fermi-GBM Swift-BAT Fermi-LAT Fermi-LAT Fermi-LAT $> $ 100 MeV

$> $ 1 GeV

$> $ 10 GeV

Observation 39.5 9.32 1.4 0.7 0.1 Simulation $ 38.9\pm6.24 $ 

$ 8.75\pm2.96 $ 

$ 1.55\pm1.24 $ 

$ 0.78\pm0.88 $ 

$ 0.05\pm0.23 $ 

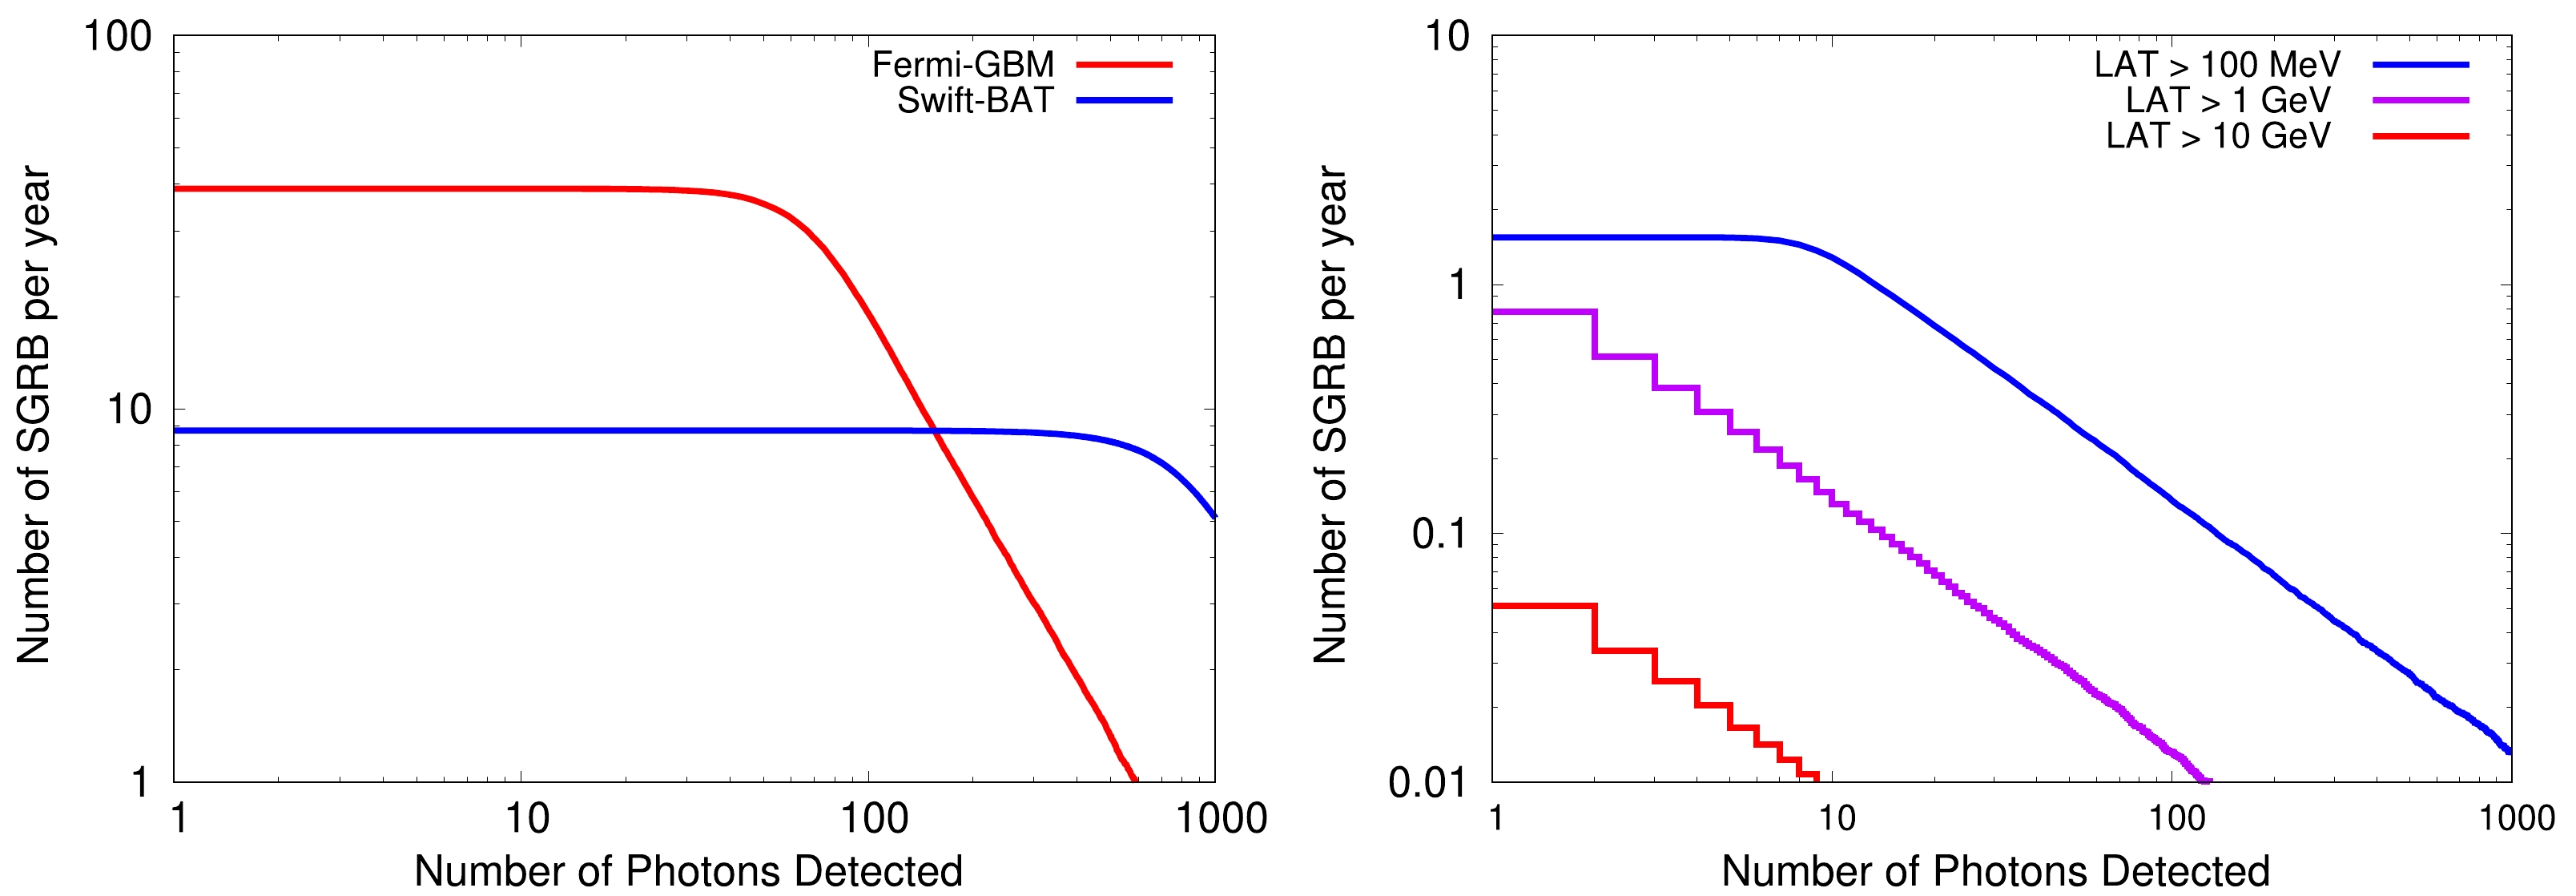
Figure 4. (color online) Simulated detection rates of SGRBs with the Fermi-GBM, Swift-BAT, and Fermi-LAT. The solid lines represent the cumulative number of detected SGRBs per year as a function of the number of photons detected. The observation rates compared with simulated rates are showed in Table 1.
-
The results of our study include two parts: the detected event rates of SGRBs, and a pseudo light curve for GRB090510 simulated with the HADAR experiment, which reflects HADAR's capacity to detect VHE SGRBs with sufficient sensitivity and a wide FOV to observe photons extending to the VHE spectral component.
-
The left panel of Fig. 5 presents the expected detection rates between z and
$ z+\mathrm{d}z $ for the GBM and HADAR compared with the BNS merger rate. The right panel of Fig. 5 shows the cumulative detection rates of SGRBs. Here, the spectrum with only the Band spectrum or Band and extra power low spectrum is considered. If the single Band spectrum is considered, the expected detection rate for HADAR is 0.49 per year. If the spectrum with the extra power law is considered in the simulation ($R_{\rm ext} = 0.1$ ), the detection rates are 0.82, 1.2, and 1.6 for$\beta_{\rm ext} = $ –2.0, –1.75, and –1.5, respectively.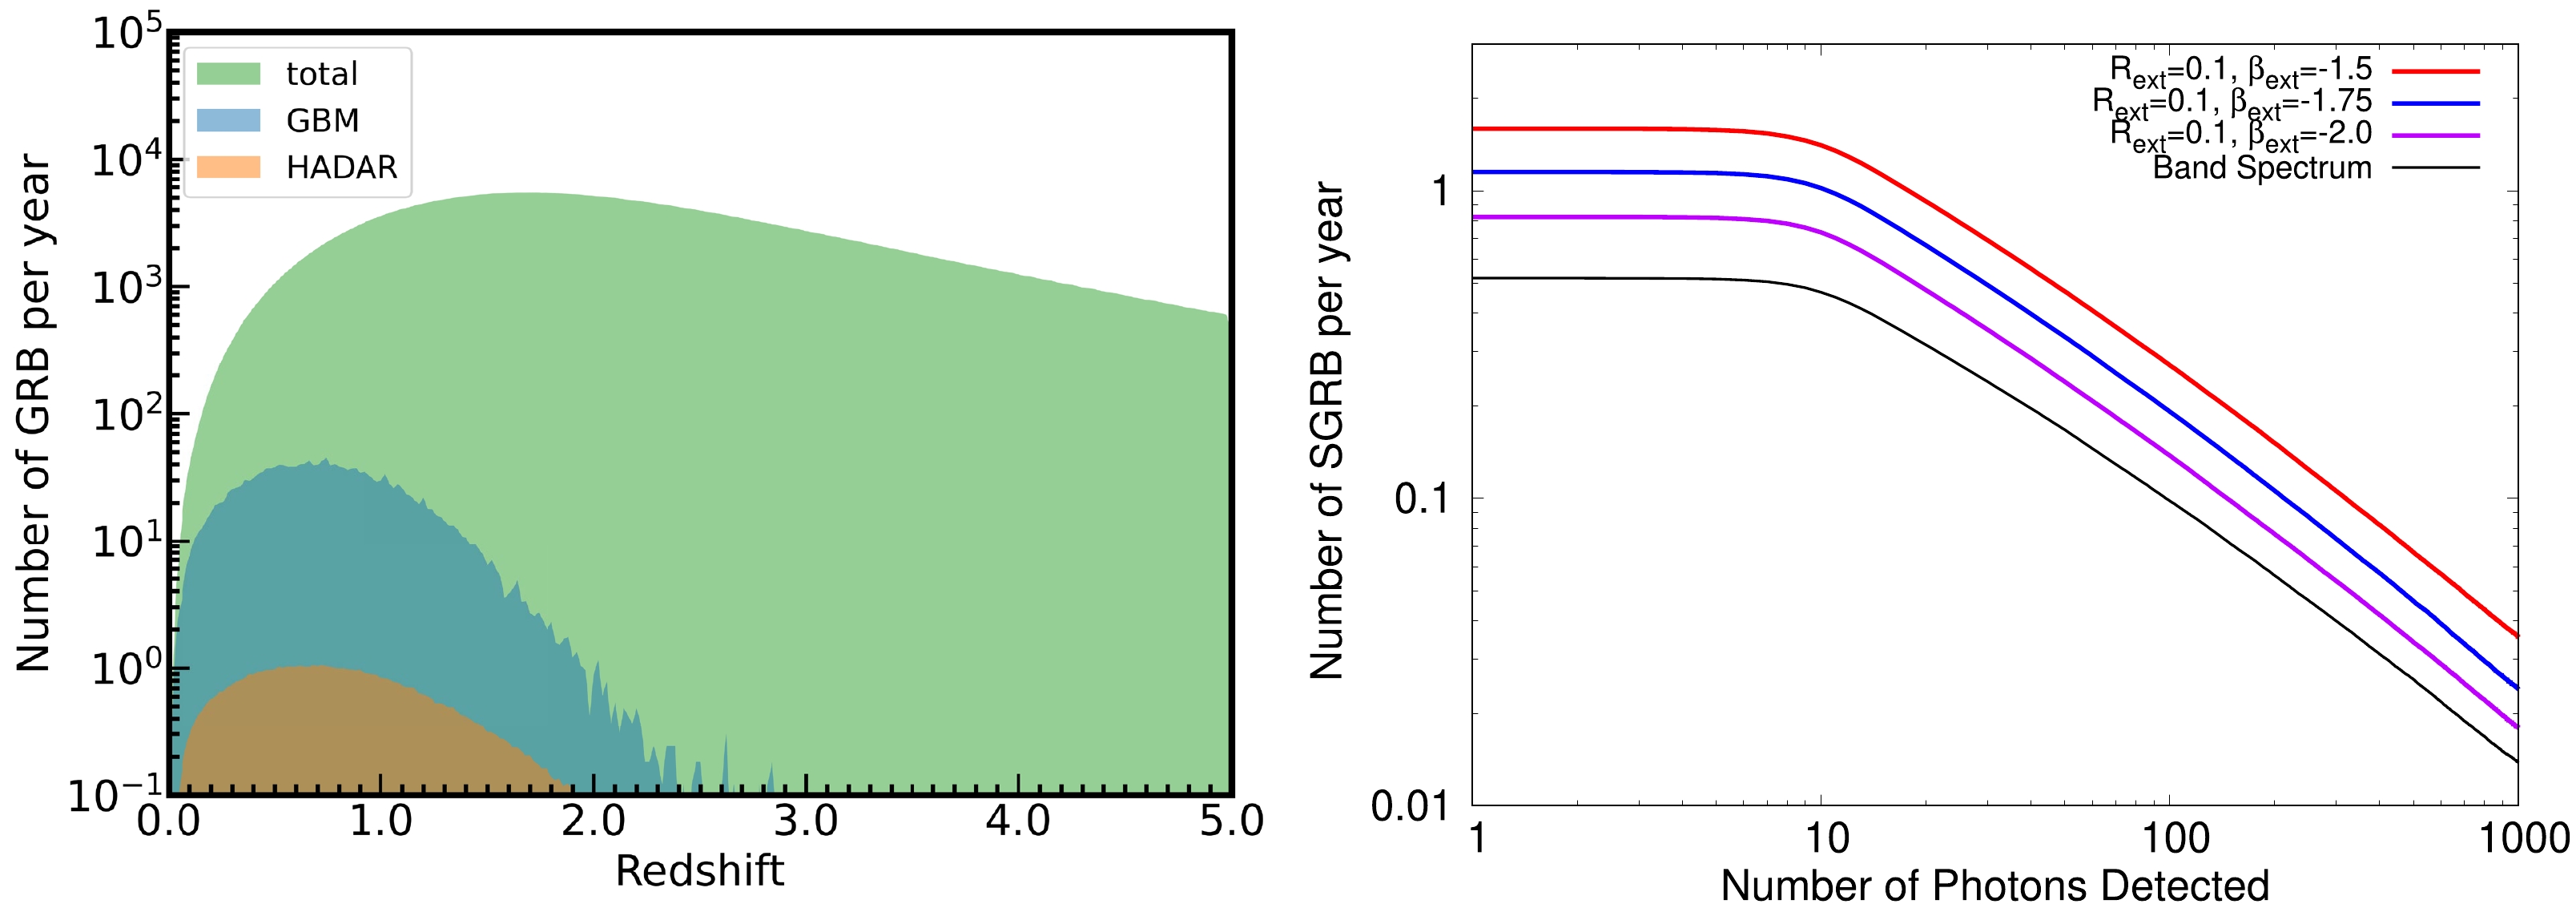
Figure 5. (color online) Left: SGRB detection rate between the redshifts z and z+dz of the GBM and HADAR, respresented by the blue and orange lines, respectively, whereas the green line denotes the BNS merger rate between the redshifts z and z+dz. Right: SGRB cumulative detection rate of HADAR for different combinations of parameters for the extra component, in which the black line represents the Band spectrum, and the magenta, blue, and red lines represent combinations of the extra + Band components. The model for the EBL absorption described in Ref. [35] is considered, whereas no exponential cutoff is considered.
The left panel of Fig. 6 shows the cumulative detection rate with different energy cut-offs considering the exponential cutoff. With the EBL model of Ref. [35], the expected detection rates are 0.20, 0.38, 0.64, and 1.1 for
$E_{\rm cut} =$ 30 GeV, 50 GeV, 100 GeV, and 1 TeV, respectively. The right panel of Fig. 6 presents the cumulative detection rate for HADAR with different EBL models. It is shown that the different EBL models have little effect on the expected detection rates for HADAR, which are approximately 0.55 or 1.1 per year for the different EBL models adopted from Refs. [35, 54−56] with or without a 100 GeV energy cutoff.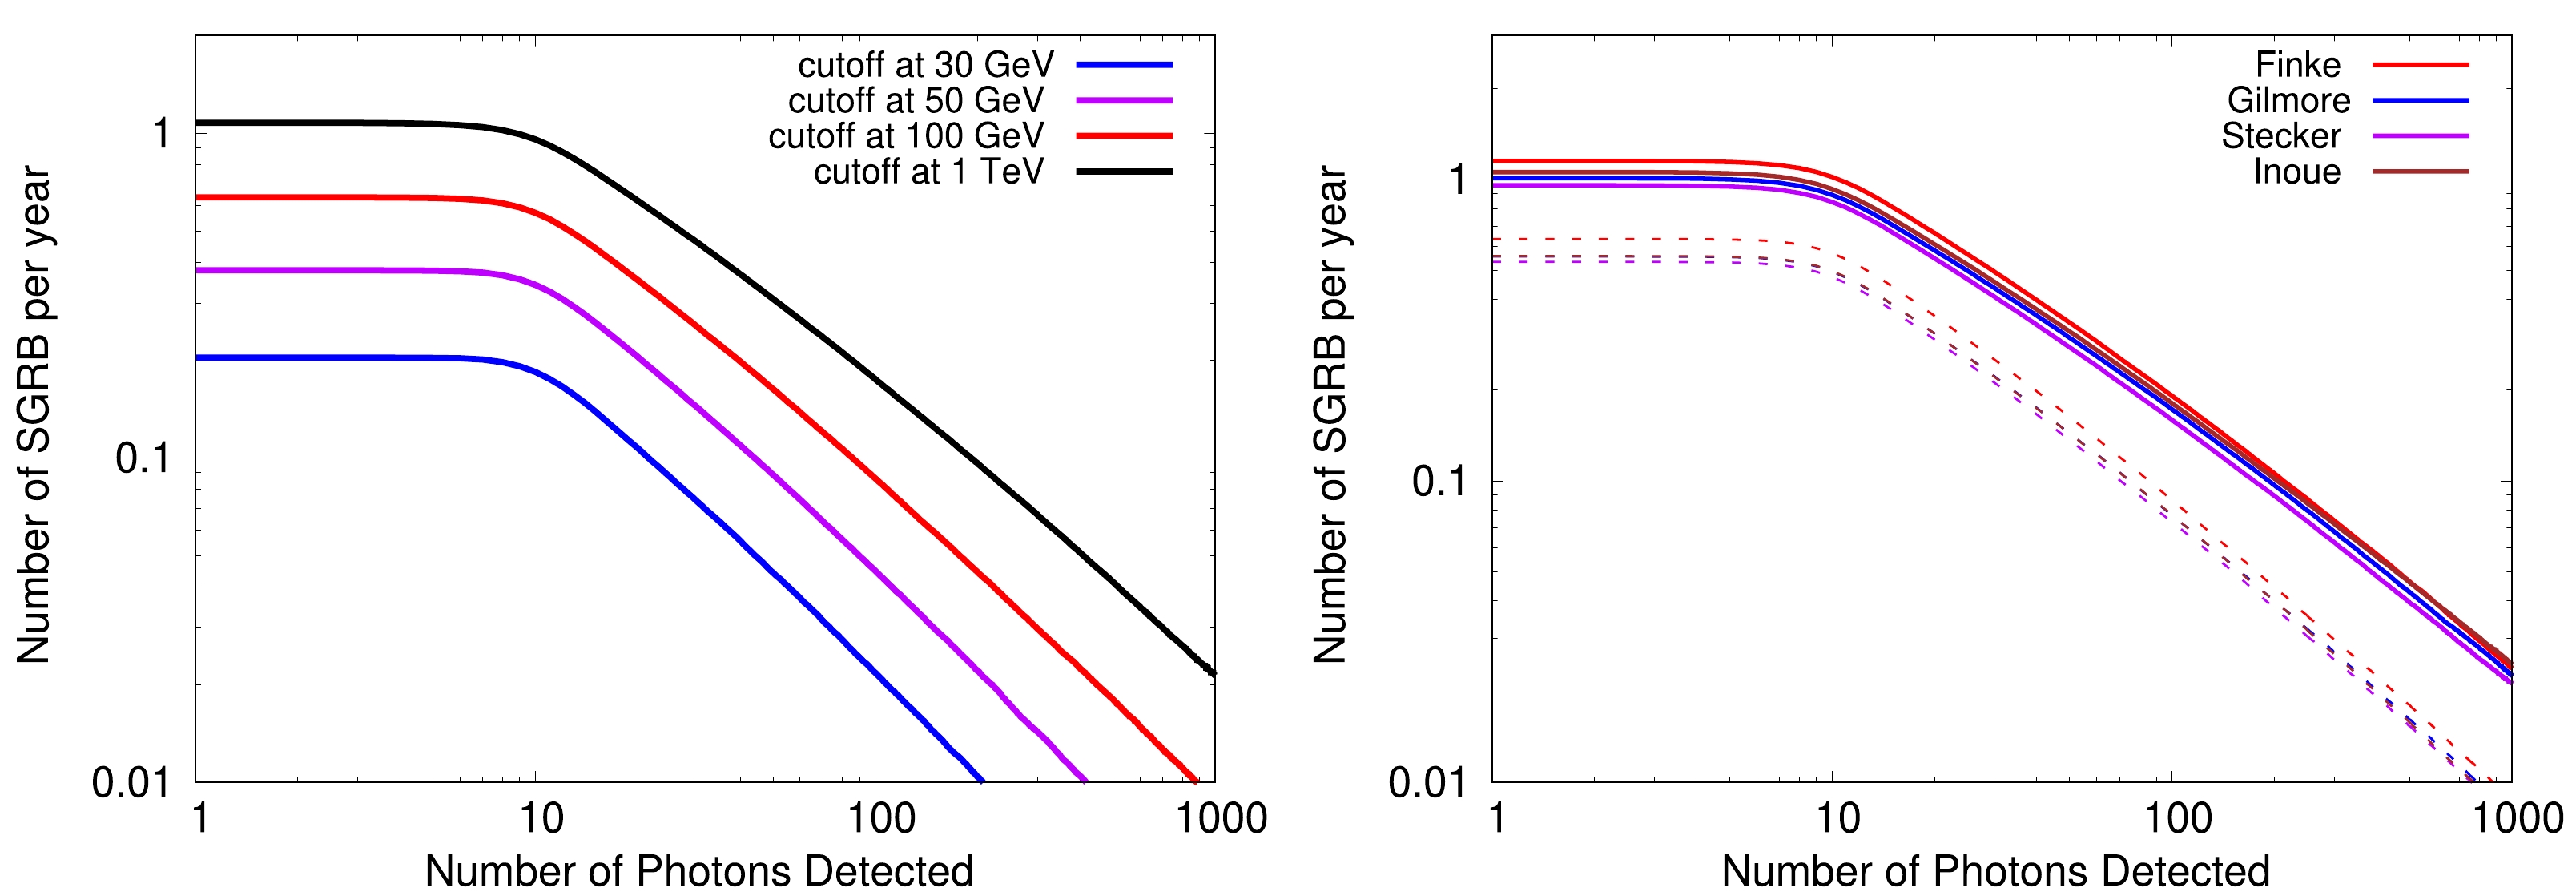
Figure 6. (color online) Left: SGRB cumulative detection rate with the extra + Band spectra considered for different energy breaks in the case of
$\beta_{\rm ext}$ = –1.75,$R_{\rm ext}=0.1$ , and the EBL model [35]. Right: SGRB cumulative detection rate with the extra + Band spectra considered for different EBL models,$\beta_{\rm ext}$ = –1.75,$R_{\rm ext}=0.1$ . The solid lines are cases without an exponential cutoff, and the dashed lines are the results when the energy spectrum is considered to cut off at 100 GeV. -
Based on our HADAR model and the parameters of GRB090510 extracted from the observational results [45], including the redshift, spectrum, and considering the model of the LIV effects for the GRB from Ref. [26], a pseudo light curve of the HADAR observation is generated, as shown in panels (c) and (d) of Fig. 7, as well as each photon with the observed time and energy.
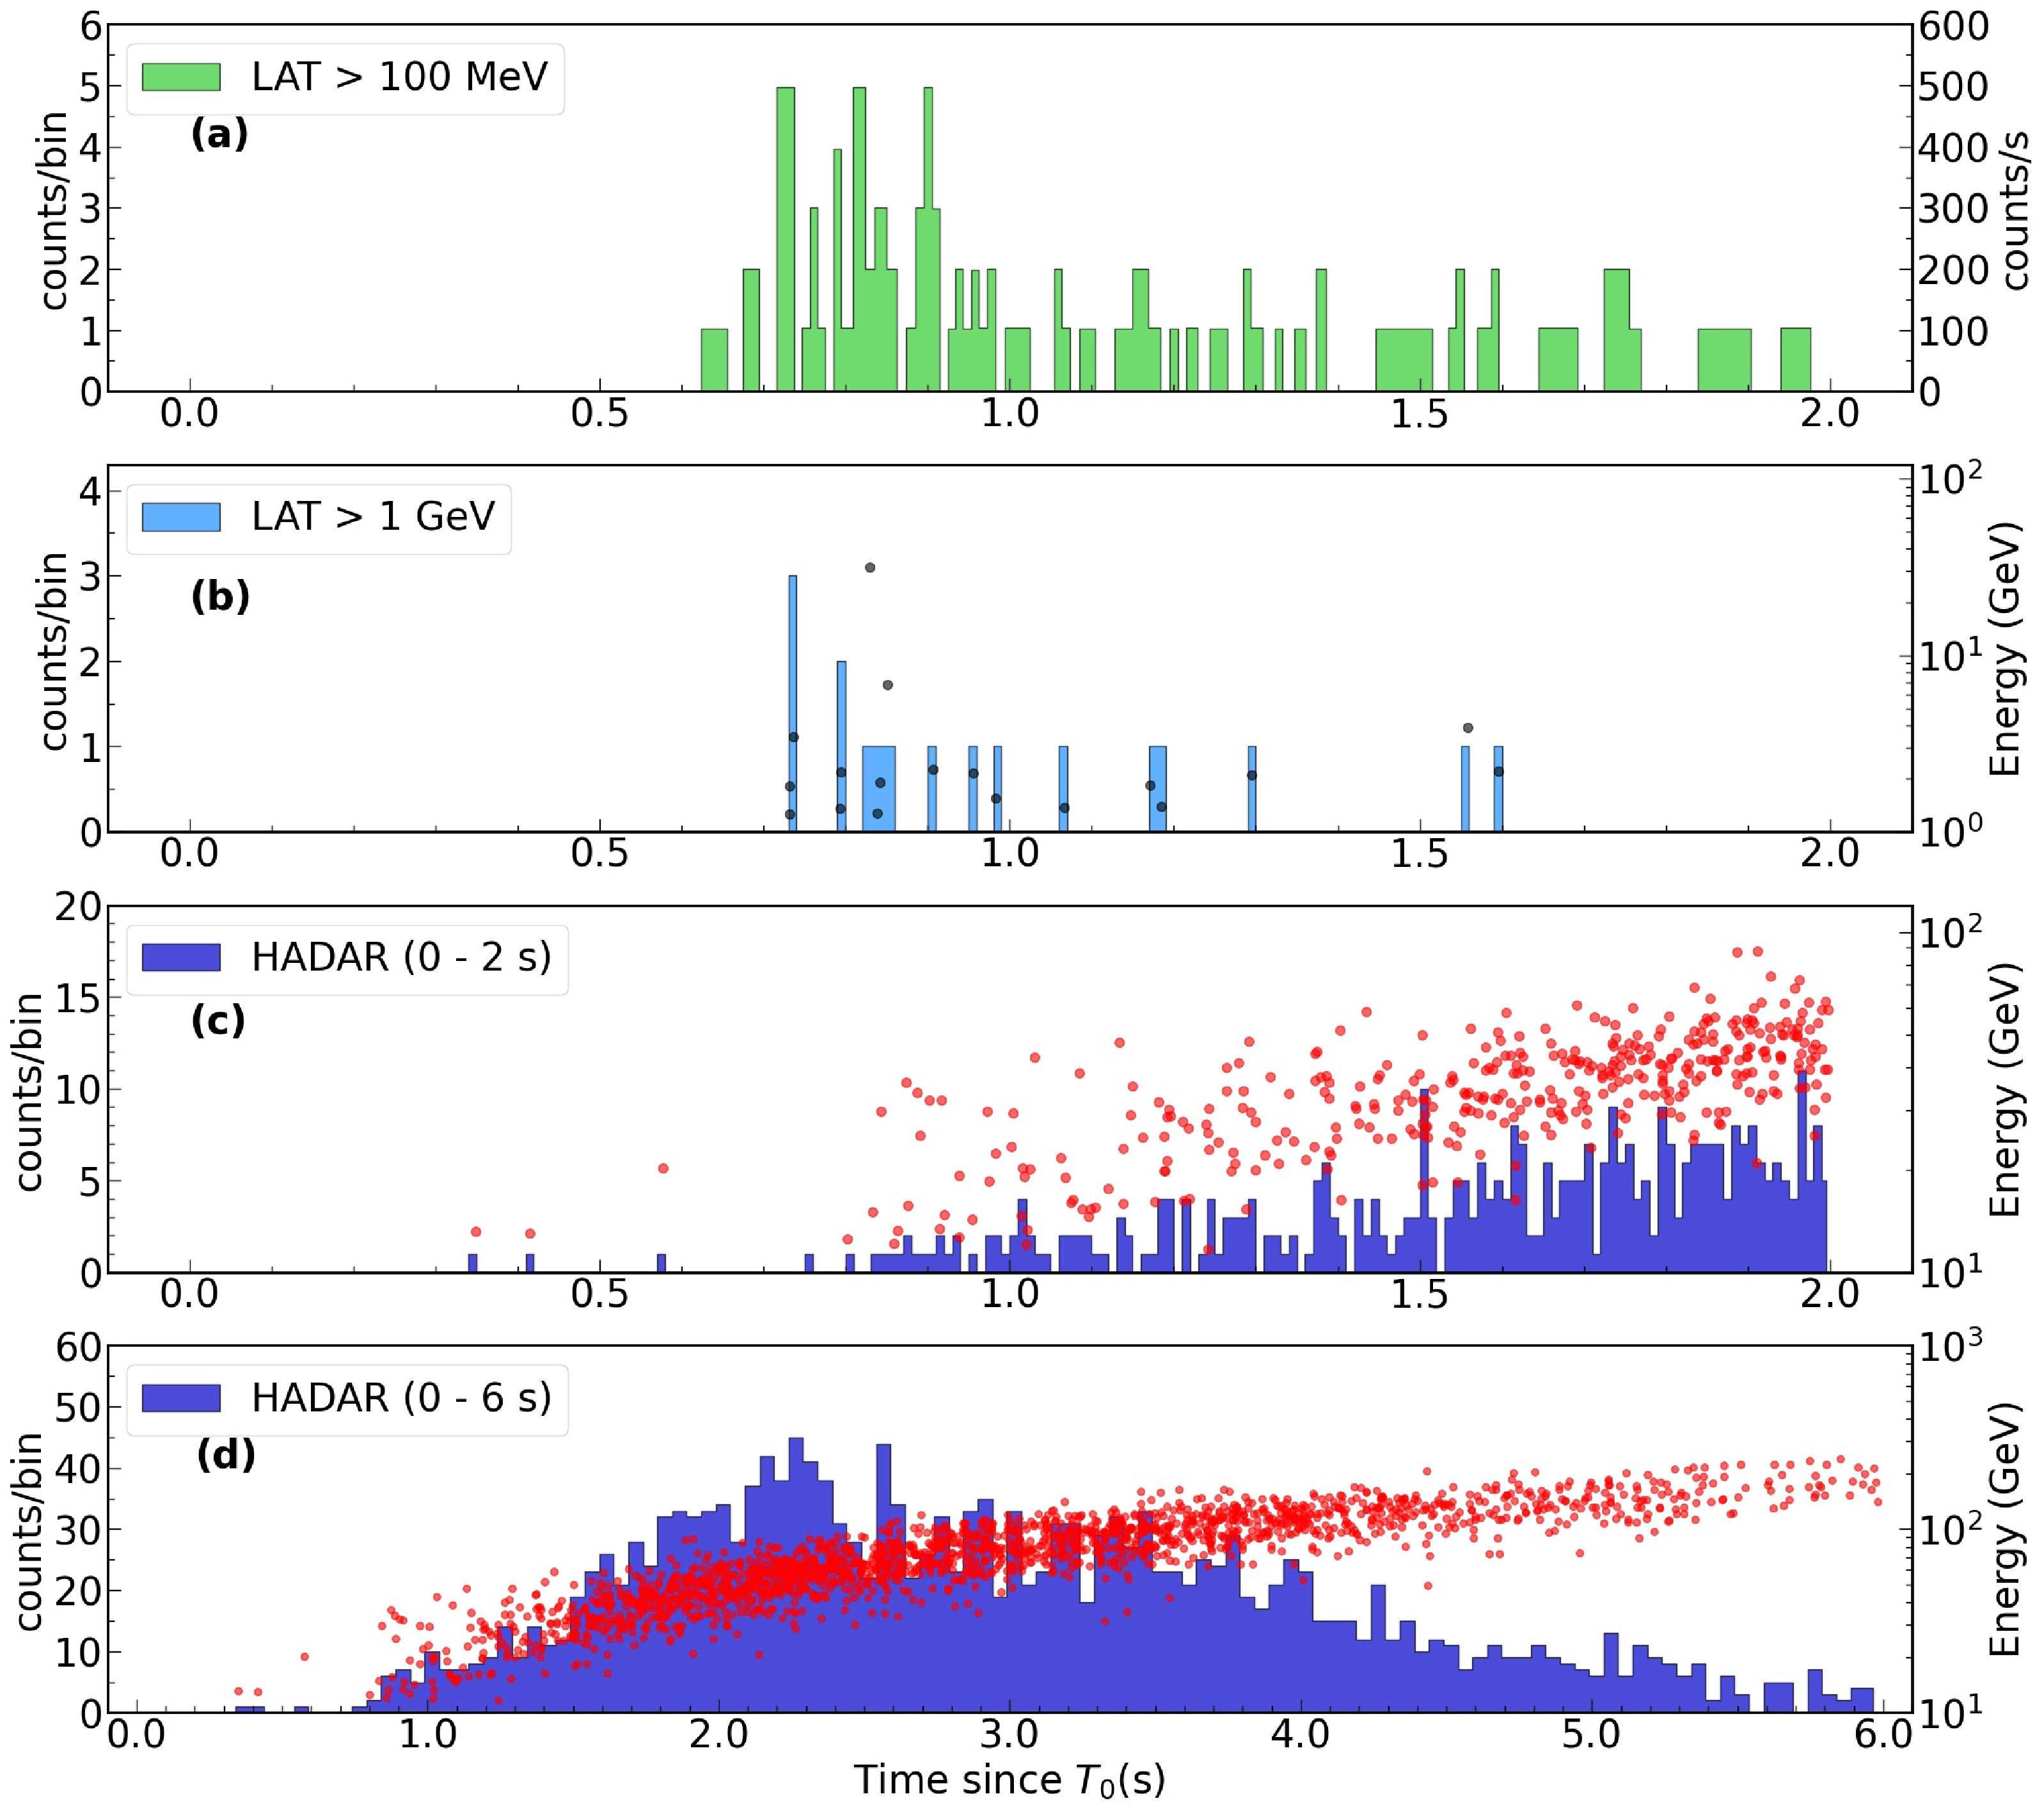
Figure 7. (color online) Light curves of GRB090510 at different energies. The Fermi-LAT data is taken from Ref. [26]. (a) is for LAT
$ > $ 100 MeV. The per-second count rate is displayed on the right side for convenience. (b) is for LAT$ > $ 1 GeV. (c) A simulated light curve of a 090510-like GRB detected by HADAR. (b), (c), and (d) also overlay the energy versus arrival time for each photon, with the energy scale displayed on the right side. (d) Full light curve described in (c). Photons are represented as gray dots in (b) and red dots in (c) and (d).To present this light curve, we consider the photon energy distribution to follow the spectrum of a 090510-like GRB combined with EBL attenuation. Then, these photons are detected by HADAR with effective areas and a
$20\%$ energy resolution. From the observation of GRB090510, there are seven pulses in the light curve. Therefore, we use them to simulate the light curve detected by HADAR. An assumption is made that the photons in a pulse from the source burst at exactly the same time. For the LIV effects, a positive time delay$\Delta t = (\Delta E/ E_{\rm QG})D/c$ is included in the simulated arrival time of photons, where$E_{\rm QG}=M_{\rm QG}c^2$ is the Planck energy, D is the co-moving distance from source to detector, and$\Delta E = E_{\gamma,\rm high} - E_{\gamma,\rm low}$ . The energy dispersion of the time delay$ \Delta t/\Delta E = +0.03\ \text{s}/\text{GeV} $ is adopted [26]. From Fig. 7, it is clear that HADAR is better than the Fermi-LAT in the high energy range, which is helpful for providing more constraints on the parameters of LIV effects. -
The observations of TeV γ-ray emissions from SGRBs are very important for studying the central engine, radiation mechanism, and potential new physics, such as LIV. Limited by the effective area and narrow FOV of space-borne and ground-based applications with IACT technology experiments, there are still no related results. New experiments are required to have a wide FOV and high sensitivity with IACT technology. The HADAR experiment can fulfill these two requirements simultaneously.
In this study, we produce one SGRB sample and then check the sample with the Fermi-GBM, Fermi-LAT, and Swift-BAT observations. Based on this sample, the annual detection rate of the SGRB is calculated for HADAR experiments. In the present status, HADAR can detect 0.5 SGRBs in one year. The annual rate can slightly change with different EBL absorption models and intrinsic spectral break-off. Furthermore, we assume that GRB090510A-like events appear in the FOV of HADAR. HADAR can detect approximately 2000 photons with the exponential cutoff considered. HADAR will exhibit good performance in exploring potential new physics, such as LIV. Based on this study, we believe that the HADAR experiment will exhibit good performance in the observation of SGRBs. We hope that the HADAR experiment will be successfully completed and that it will observe SGRBs that are consistent with our expectations in the future.
Prospects for the detection rate of very-high-energy γ-ray emissions from short γ-ray bursts with the HADAR experiment
- Received Date: 2023-04-03
- Available Online: 2023-09-15
Abstract: The observation of short gamma ray bursts (SGRBs) in the TeV energy range plays an important role in understanding the radiation mechanism and probing potential new physics, such as Lorentz invariance violation (LIV). However, no SGRBs have been observed in this energy range owing to the short duration of SGRBs and the weakness of current experiments. New experiments with new technology are required to detect the very high energy (VHE) emission of SGRBs. In this study, we simulate the VHE γ-ray emissions from SGRBs and calculate the annual detection rate with the High Altitude Detection of Astronomical Radiation (HADAR) experiment. First, a set of pseudo-SGRB samples is generated and checked using the observations of the Fermi-GBM, Fermi-LAT, and Swift-BAT measurements. The annual detection rate is calculated from these SGRB samples based on the performance of the HADAR instrument. As a result, the HADAR experiment can detect 0.5 SGRBs per year if the spectral break-off of γ-rays caused by the internal absorption and Klein-Nishina (KN) effect is larger than 100 GeV. For a GRB090510-like GRB in HADAR's view, it should be possible to detect approximately 2000 photons considering the internal absorption and KN effect. With a time delay assumption due to LIV effects, a simulated light curve of GRB090510 has evident energy dependence. We hope that the HADAR experiment can perform SGRB observations and test our calculations in the future.


 Abstract
 HTML
HTML Reference
 Related
 PDF
PDF


 DownLoad: