-
Over the last decades, the development of radioactive beam facilities has greatly advanced the field of nuclear physics. Many elastic scattering measurements have been conducted using weakly bound nuclei as the projectile impinging on medium-heavy targets, and the findings have been compiled in several reviews [1−3]. These experiments have highlighted the significance of studying exotic nuclei. Exotic nuclei are highly unstable and lie far from the valley of β-stability, giving them weak binding energies and unusual structures. Their characteristics, such as clusters and halos, are excellent examples of many-body open quantum systems, providing extreme testing platforms for models of nuclear structure and reactions [4]. Experimental elastic scattering data for extremely weakly bound nuclei such as
$ ^{6} $ He [5−8],$ ^{8} $ B [4, 9],$ ^{8} $ He [10], and$ ^{11} $ Be [11] have been analyzed in detail using different models. It has been demonstrated that the angular distribution of these nuclei differs significantly from that of tightly bound nuclei.For stable nuclei, the elastic scattering cross section at forward angles is typically pure Rutherford scattering. The interference between the Coulomb and short-range nuclear potentials produces typical diffraction modes at large scattering angles. However, for weakly bound nuclei, the breakup due to the strong Coulomb force or the dynamic polarization potential may lead to unusual angular distribution patterns [12−14].
The phenomenological study of the interaction distance has been a powerful tool in gaining insight into the systematic behavior of angular distributions for different reactions. Two typical reduced distances have been adopted in literature. The first is the reduced critical interaction distance
$ d_\mathrm{I} $ , where the nuclear interaction begins to have an impact. The idea of extracting$ d_\mathrm{I} $ from elastic scattering measurements dates back to the 1970s to Christensen et al., which has had important consequences in the interpretation of reaction data and the nuclear potential [15, 16]. The ratio of the elastic scattering cross section to the Rutherford value$ \mathrm{d} \sigma_\mathrm{el}/\mathrm{d} \sigma_\mathrm{Ru} $ could be set as 0.98, where the absolute value of the S matrix = 0.99 [17]. The other useful tool is the reduced strong absorption distance$ d_\mathrm{S} $ , where$ \mathrm{d} \sigma_\mathrm{el}/\mathrm{d} \sigma_\mathrm{Ru}=0.25 $ [18], which is also known as the quarter-point recipe [19]. Based on the strong absorption model or sharp cut-off model from Fresnel diffraction theory, it was proposed that diffraction by an absorbing object causes the amplitude at the edge of the geometrical shadow to drop to one-half of the undisturbed amplitude [19, 20].The
$ d_\mathrm{I} $ extracted from various elastic scattering experimental data, involving mainly weakly bound$ ^{6} $ Li and$ ^{7} $ Li, has demonstrated that it depends strongly on the mass of the target nucleus [21]. The elastic back-scattering experiment$ ^{6} $ He+$ ^{209} $ Bi was reported in Ref. [17]. By comparing this reaction with other typical reactions, it was found that$ d_\mathrm{I} $ of reactions involving$ ^{6} $ He was considerably higher than those of the weakly bound$ ^{6} $ Li,$ ^{9} $ Be nuclei and tightly bound$ ^{4} $ He,$ ^{12} $ C,$ ^{16} $ O nuclei. The notably larger value for$ ^{6} $ He can be explained by the influence of the long-range coupling from its large Coulomb dipole polarizability. A more systematical comparison on$ d_\mathrm{I} $ was performed in Ref. [22], including the tightly bound nuclei ($ ^{9} $ Li,$ ^{10} $ Be,$ ^{12} $ C,$ ^{16} $ O,$ ^{19} $ F), weakly bound nuclei ($ ^{6} $ Li,$ ^{7} $ Li,$ ^{8} $ Li,$ ^{8} $ He,$ ^{9} $ Be,$ ^{17} $ F), and halo nuclei ($ ^{6} $ He and$ ^{11} $ Li) as the projectiles. They were used to bombard the$ ^{208} $ Pb target at near barrier energies. It was concluded that there was an apparent correlation between$ d_\mathrm{I} $ and the binding energy, that is,$ d_\mathrm{I} $ of halo nuclei$ > $ weakly bound nuclei$ > $ tightly bound nuclei. Recent studies on elastic scattering on$ ^{58} $ Ni,$ ^{64} $ Sn targets [23] and the light$ ^{27} $ Al target [24] by the same theoretical group led to similar conclusions.The strong absorption distance
$ d_\mathrm{S} $ has been studied in various works due to its evident physical meanings. It is first proposed to explain the α particle elastic scattering by Blair in 1954 [18]. The investigation showed that the sum of the target nucleus and α particle radii is approximately equal to that evaluated with$ d_\mathrm{S} $ . Information on the grazing angular momentum and Coulomb barrier height could be obtained using this method [19, 25]. Ground state deformation was introduced in the analysis of the quarter-point angle to explain the seemingly larger radius for$ ^{208} $ Pb compared with$ ^{232} $ Th [26]. The effect of dynamic deformation on the quarter-point angle was derived and used to analyze several experiments [27].The energy dependence of the quarter-point angle was systematically studied using a reduction method for different reactions [28]. A comparison between theoretical and experimental results shows that the maximum deviation originates from halo nuclei, and this is possibly due to the coupling to the other reaction channels. Systematical investigations into the relationship between the quarter-point elastic scattering angle and nuclear radius were conducted in Ref. [29]. Four phenomenological formulae for nuclear radius were compared, one of which was especially recommended, as a function of the binding energy.
As mentioned above, there have been several systematic studies directly comparing
$ d_\mathrm{I} $ on tightly bound, weakly bound, and halo nuclei. However, studies comparing$ d_\mathrm{S} $ are still rare, except for a few cases on the$ ^{27} $ Al target in Ref. [24].$ d_\mathrm{S} $ conveys more information about the radii and barrier; therefore, studying this is expected to give us more insight into the structure and reaction mechanisms of exotic nuclei. In this study, systematic investigations on$ d_\mathrm{S} $ are conducted with abundant experimental elastic scattering data including nuclei with different binding energies on various targets. Information on the radius and Coulomb potential barrier height is extracted.The paper is organized as follows. In Sec. II, the theoretical framework and fitting procedure of the experimental elastic scattering cross sections are briefly described. Sec. III presents the results and discussions. Finally, the summary of this study is given in Sec. IV.
-
Distance plays an important role in the study of elastic scattering. In the process of projectile-target collision, the distance of the closest approach is a key physical quantity. Assume that the collision of two nuclei follows the Coulomb trajectory, the distance of the closest approach is
$ D=\frac{Z_{\mathrm{P}} Z_{\mathrm{T}} {\rm e}^2 }{2 E_{\mathrm{cm}}}\left[1+\frac{1}{\sin (\theta / 2)}\right] $

(1) and the reduced distance of closest approach is
$ d=D/(A_\mathrm{T}^{1/3}+A_\mathrm{P}^{1/3}) $ . In the above equations,$ A_\mathrm{P},Z_\mathrm{P}\; (A_\mathrm{T},Z_\mathrm{T}) $ are the mass and charge number of the projectile (target),$ E_\mathrm{cm} $ and θ are the incident energy and scattering angle in the center of mass coordinate, respectively.When the interval between two nuclei is less than the strong absorption distance
$ R_{\mathrm{S}}=d_{\mathrm{S}}(A_\mathrm{T}^{1/3}+A_\mathrm{P}^{1/3}) $ , nuclear absorption is the main process. The transition from Coulomb scattering to nuclear absorption is located within a narrow range near$ R_{\mathrm{S}} $ , which is usually a geometrical feature and does not depend on the details of nuclear structure. The strong absorption model or diffraction model was proposed using an analogy of nucleus-nucleus scattering to the diffraction of light by an absorbing sphere [19]. A study on tightly bound nuclei based on this model demonstrated that the place where$ \sigma_\mathrm{el}/\sigma_\mathrm{Ru} = 0.25 $ is closely related to the reduced strong absorption distance$ d_{\mathrm{S}} $ [18]. For weakly bound and exotic nuclei, which have very diffuse surfaces,$ d_{\mathrm{S}} $ at the quarter-point angle may be different. To extract this distance, we adopt the Boltzmann exponential function with three free parameters to fit the elastic scattering cross section,$ \mathrm{d} \sigma_{\mathrm{el}} / \mathrm{d} \sigma_{\mathrm{Ru}}=\frac{a_0}{1+{\rm e}^{a_{1}\left(d-a_2\right)}}, $

(2) where
$ a_0, a_1, a_2 $ are free parameters used to fit the data. The above formula, despite its simplicity compared to optical model calculations, was proven effective and accurate in the fitting of experimental data [22]. To conveniently extract the reduced strong absorption distance$ d_{\mathrm{S}} $ , we slightly modify the formula as follows:$ \mathrm{d} \sigma_{\mathrm{el}} / \mathrm{d} \sigma_{\mathrm{Ru}}=\frac{1}{1+3 {\rm e}^{a_1 \left(d-a_2\right)}}. $

(3) We find that when
$ d=a_2 $ ,$ \mathrm{d} \sigma_{\mathrm{el}} / \mathrm{d} \sigma_{\mathrm{Ru}}=0.25 $ . Therefore,$ a_2 $ is the$ d_{\mathrm{S}} $ we need. -
In the present context, we use the popular Minuit minimization program [58] to determine the parameters by searching the global minimum in the hyper-surface of the
$ \chi^2 $ function. The$ \chi^2 $ per point is expressed as$ \chi^2/pt= \frac{1}{n}\sum\limits_i \left(\frac{ \sigma_i^{\rm The} - \sigma_i^{\rm Exp} }{\delta \sigma_i^{\rm err}}\right)^2 ,$

(4) where
$ i,n $ are the i-th and the total number of experimental points for each reaction,$ \sigma_i^{\rm The} $ ,$ \sigma_i^{\rm Exp} $ , and$ \delta \sigma_i^{\rm err} $ represent the theoretical cross sections, experimental data, and their corresponding error, respectively.The experimental elastic scatterings close to the Coulomb barrier of different projectiles are selected, including tightly bound (
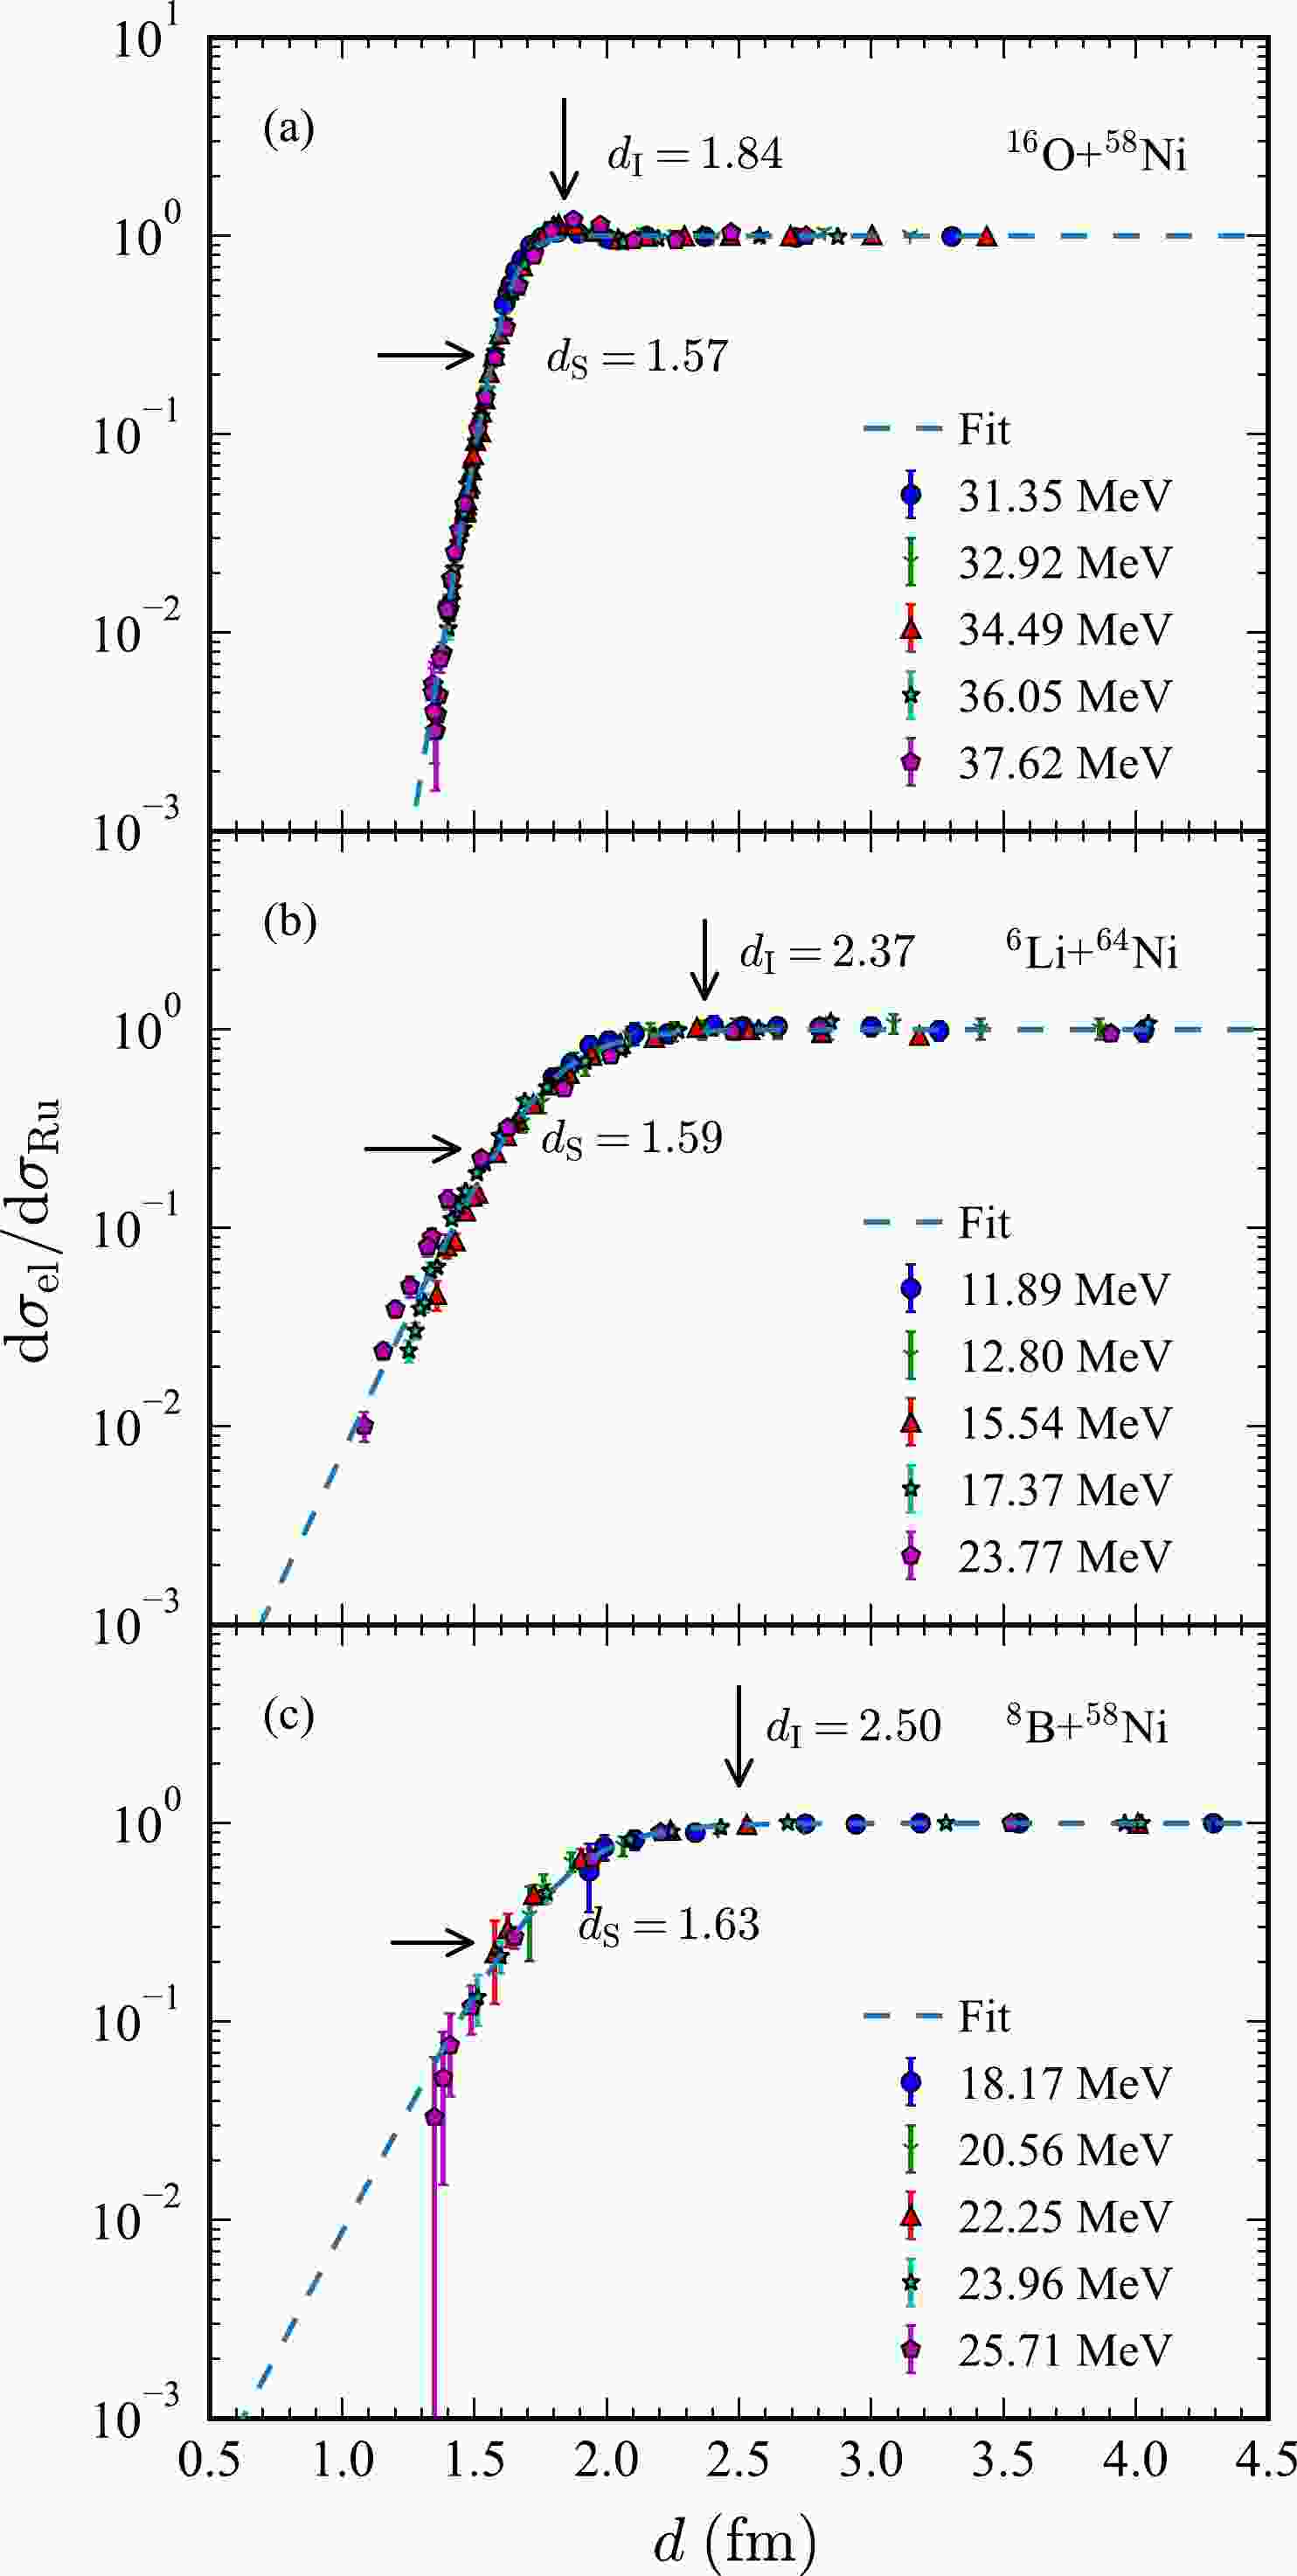
$ ^{12} $ C,$ ^{16} $ O), weakly bound ($ ^{6} $ Li,$ ^{7} $ Li,$ ^{8} $ Li,$ ^{9} $ Li,$ ^{7} $ Be,$ ^{9} $ Be,$ ^{10} $ Be,$ ^{17} $ F), and exotic ($ ^{6} $ He,$ ^{8} $ He,$ ^{11} $ Be,$ ^{8} $ B,$ ^{11} $ Li) nuclei on various tightly bound targets. A total of 84 sets of reactions are collected, many of them containing experimental angular distributions at several incident energies. The reactions with weakly bound and halo nuclei as the projectiles are listed in Table 1. For simplicity, reactions with tightly bound projectiles are not shown. The experimental angles for${\rm d}\sigma_\mathrm{el}/{\rm d}\sigma_\mathrm{Ru}$ from literature are converted to reduced distance according to Eq. (1). The advantage of this approach is that experiments at different incident energies can be reduced by considering$ E_{\mathrm{cm}} $ in the formula. For instance, we show$ \mathrm{d} \sigma_\mathrm{el}/\mathrm{d} \sigma_\mathrm{Ru} $ as a function of the reduced distance of closest approach d for$ ^{16} $ O+$ ^{58} $ Ni,$ ^{6} $ Li+$ ^{64} $ Ni, and$ ^{8} $ B+$ ^{58} $ Ni in Fig. 1. As shown, the experimental data under different incident energies for reactions with tightly bound, weakly bound, and halo projectiles can be effectively reduced. The fitting based on Eq. (3) is shown as a dashed line and can satisfactorily reproduce the experimental data. The positions of the extracted$ d_\mathrm{S} $ and$ d_\mathrm{I} $ are indicated in the figure for reference.Reaction $ a_1 $ 

$ d_{\mathrm{S}} $ /fm

$ \Delta d_{\mathrm{S}} $ /fm

Reference Reaction $ a_1 $ 

$ {d_{\mathrm{S}}} $ /fm

$ \Delta d_{\mathrm{S}} $ /fm

Reference $ ^{6} $ He+

$ ^{58} $ Ni

−3.40 1.53 0.019 [5] $ ^{6} $ Li+

$ ^{112} $ Sn

−9.13 1.57 0.001 [30] $ ^{6} $ He+

$ ^{64} $ Zn

−5.00 1.48 0.002 [6] $ ^{6} $ Li+

$ ^{120} $ Sn

−8.29 1.45 0.005 [31] $ ^{6} $ He+

$ ^{120} $ Sn

−5.61 1.56 0.016 [32] $ ^{6} $ Li+

$ ^{138} $ Ba

−10.50 1.57 0.001 [33] $ ^{6} $ He+

$ ^{197} $ Au

−6.85 1.51 0.0001 [34] $ ^{6} $ Li+

$ ^{144} $ Sm

−9.84 1.54 0.0003 [35] $ ^{6} $ He+

$ ^{208} $ Pb

−7.70 1.59 0.003 [7,8] $ ^{10} $ Be+

$ ^{208} $ Pb

−12.31 1.54 0.031 [36] $ ^{8} $ He+

$ ^{208} $ Pb

−9.54 1.70 0.002 [10] $ ^{6} $ Li+

$ ^{208} $ Pb

−9.21 1.45 0.003 [37] $ ^{11} $ Li+

$ ^{208} $ Pb

−1.49 1.65 0.018 [14] $ ^{8} $ B +

$ ^{58} $ Ni

−5.76 1.63 0.013 [38] $ ^{6} $ Li+

$ ^{28} $ Si

−5.39 1.57 0.007 [39] $ ^{6} $ Li+

$ ^{209} $ Bi

−13.32 1.53 0.002 [40] $ ^{6} $ Li+

$ ^{40} $ Ca

−5.63 1.63 0.006 [41] $ ^{7} $ Li+

$ ^{208} $ Pb

−17.02 1.52 0.001 [42] $ ^{6} $ Li+

$ ^{54} $ Fe

−6.50 1.60 0.005 [43] $ ^{8} $ Li+

$ ^{208} $ Pb

−8.08 1.66 0.006 [44] $ ^{6} $ Li+

$ ^{59} $ Co

−6.25 1.52 0.003 [45] $ ^{9} $ Li+

$ ^{208} $ Pb

−14.07 1.52 0.001 [14] $ ^{6} $ Li+

$ ^{64} $ Ni

−6.46 1.59 0.001 [37] $ ^{8} $ B+

$ ^{64} $ Zn

−7.97 1.55 0.016 [9] $ ^{6} $ Li+

$ ^{65} $ Cu

−6.07 1.54 0.002 [46] $ ^{11} $ Be+

$ ^{64} $ Zn

−5.22 1.76 0.008 [11] $ ^{6} $ Li+

$ ^{70} $ Ge

−6.39 1.57 0.004 [47] $ ^{11} $ Be+

$ ^{208} $ Pb

−5.29 1.48 0.020 [48] $ ^{6} $ Li+

$ ^{72} $ Ge

−6.16 1.57 0.004 [47] $ ^{8} $ B+

$ ^{120} $ Sn

−11.92 1.66 0.002 [4] $ ^{6} $ Li+

$ ^{74} $ Ge

−5.21 1.56 0.005 [47] $ ^{7} $ Be+

$ ^{58} $ Ni

−8.82 1.61 0.011 [49] $ ^{6} $ Li+

$ ^{90} $ Zr

−8.34 1.56 0.001 [50] $ ^{7} $ Be+

$ ^{208} $ Pb

−11.13 1.49 0.005 [51−53] $ ^{6} $ Li+

$ ^{91} $ Zr

−6.72 1.54 0.001 [54] $ ^{9} $ Be+

$ ^{208} $ Pb

−15.75 1.54 0.0003 [55] $ ^{17} $ F+

$ ^{208} $ Pb

−18.04 1.47 0.004 [56] Table 1. List of reactions with weakly bound and halo nuclei as the projectiles. The fitted
$ a_1 $ ,$ d_{\mathrm{S}} $ ($ a_2 $ ), and its error$ \Delta d $ are presented.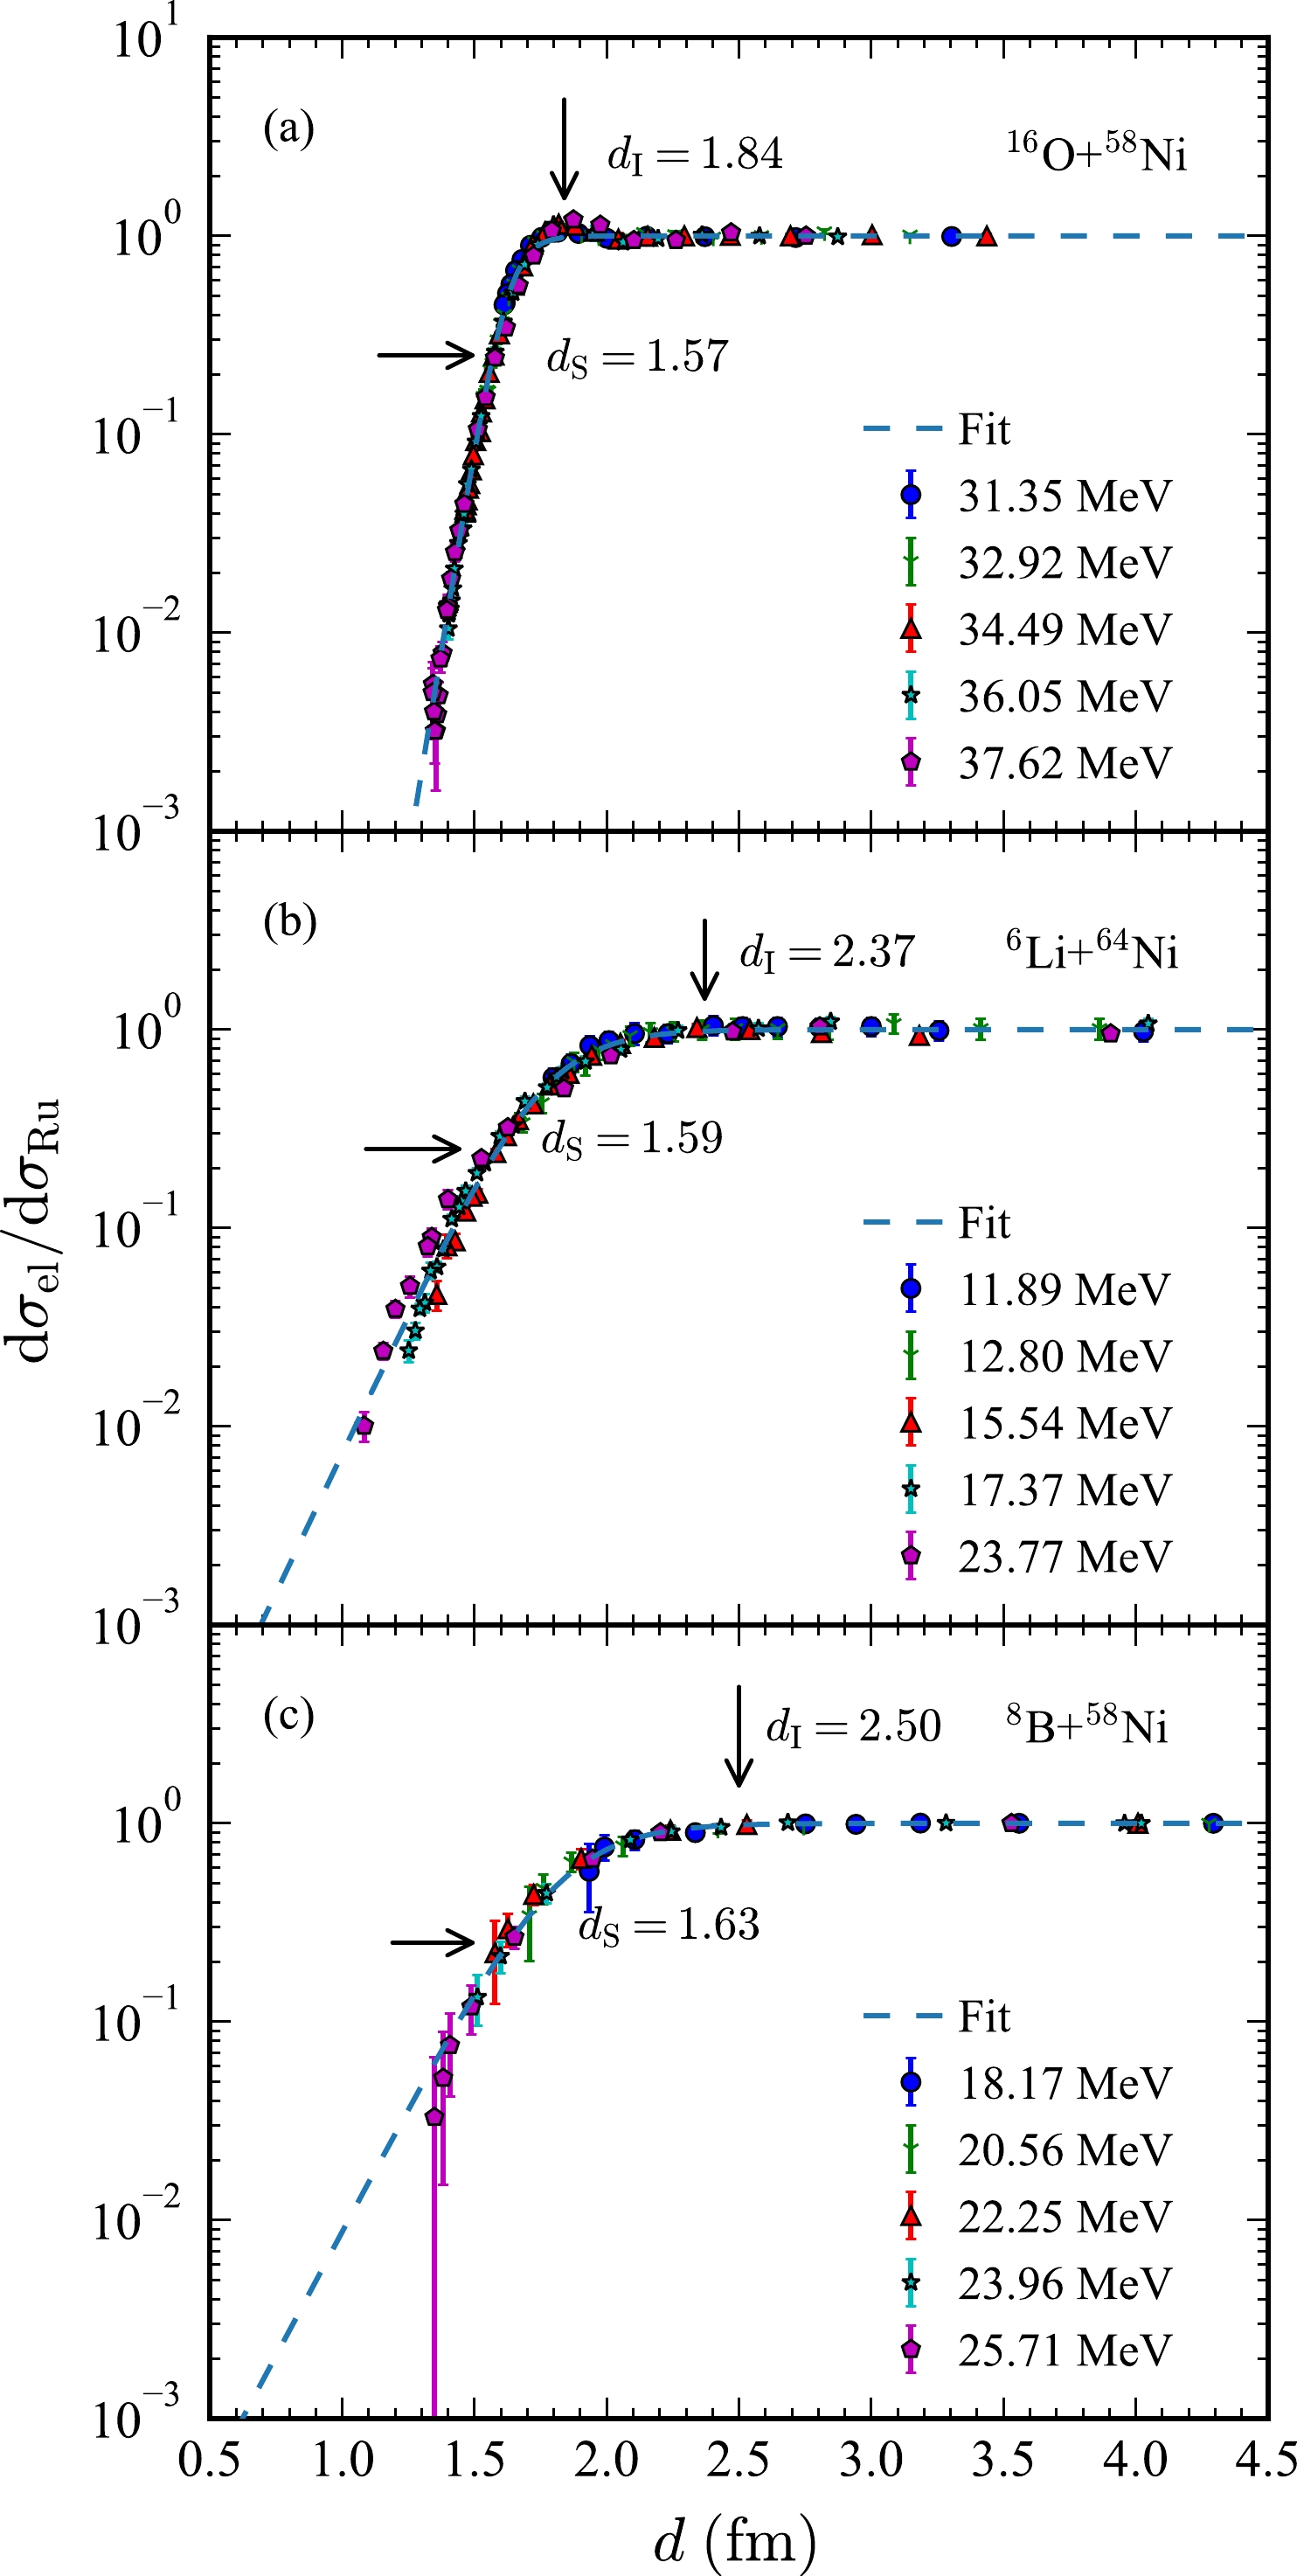
Figure 1. (color online) Ratio of the elastic cross section to the Rutherford value
$ \mathrm{d} \sigma_\mathrm{el}/\mathrm{d} \sigma_\mathrm{Ru} $ as a function of the reduced distance of closest approach d for$ ^{16} $ O+$ ^{58} $ Ni [57],$ ^{6} $ Li+$ ^{64} $ Ni [37], and$ ^{8} $ B+$ ^{58} $ Ni [38] at the corresponding energy. Theoretical fitting is shown by the dashed line.$ d_\mathrm{S} $ and$ d_\mathrm{I} $ are indicated for reference. -
As shown in Table 1, the extracted
$ d_\mathrm{S} $ values for halo and weakly bound projectiles do not appear to vary significantly. The minimum value is 1.47 fm for$ ^{17} $ F+$ ^{208} $ Pb, whereas the maximum is 1.76 fm for$ ^{11} $ Be+$ ^{64} $ Zn. A detailed comparison of all the fitted$ d_\mathrm{S} $ as a function of system size$ A_\mathrm{T}^{1/3}+A_\mathrm{P}^{1/3} $ is shown in Fig. 2. The reactions are shown in three groups based on the projectiles, that is, the tightly bound, weakly bound, and halo nuclei. We can see that$ d_\mathrm{S} $ for most reactions is located at a small range between 1.4 and 1.7 fm and does not change significantly with the system size. There is no clear boundary between the three groups. Some exceptions with larger$ d_\mathrm{S} $ are labeled in the figure, including$ ^{11} $ Be,$ ^{8} $ B,$ ^{8} $ He, and$ ^{11} $ Li, which are all typical halo nuclei.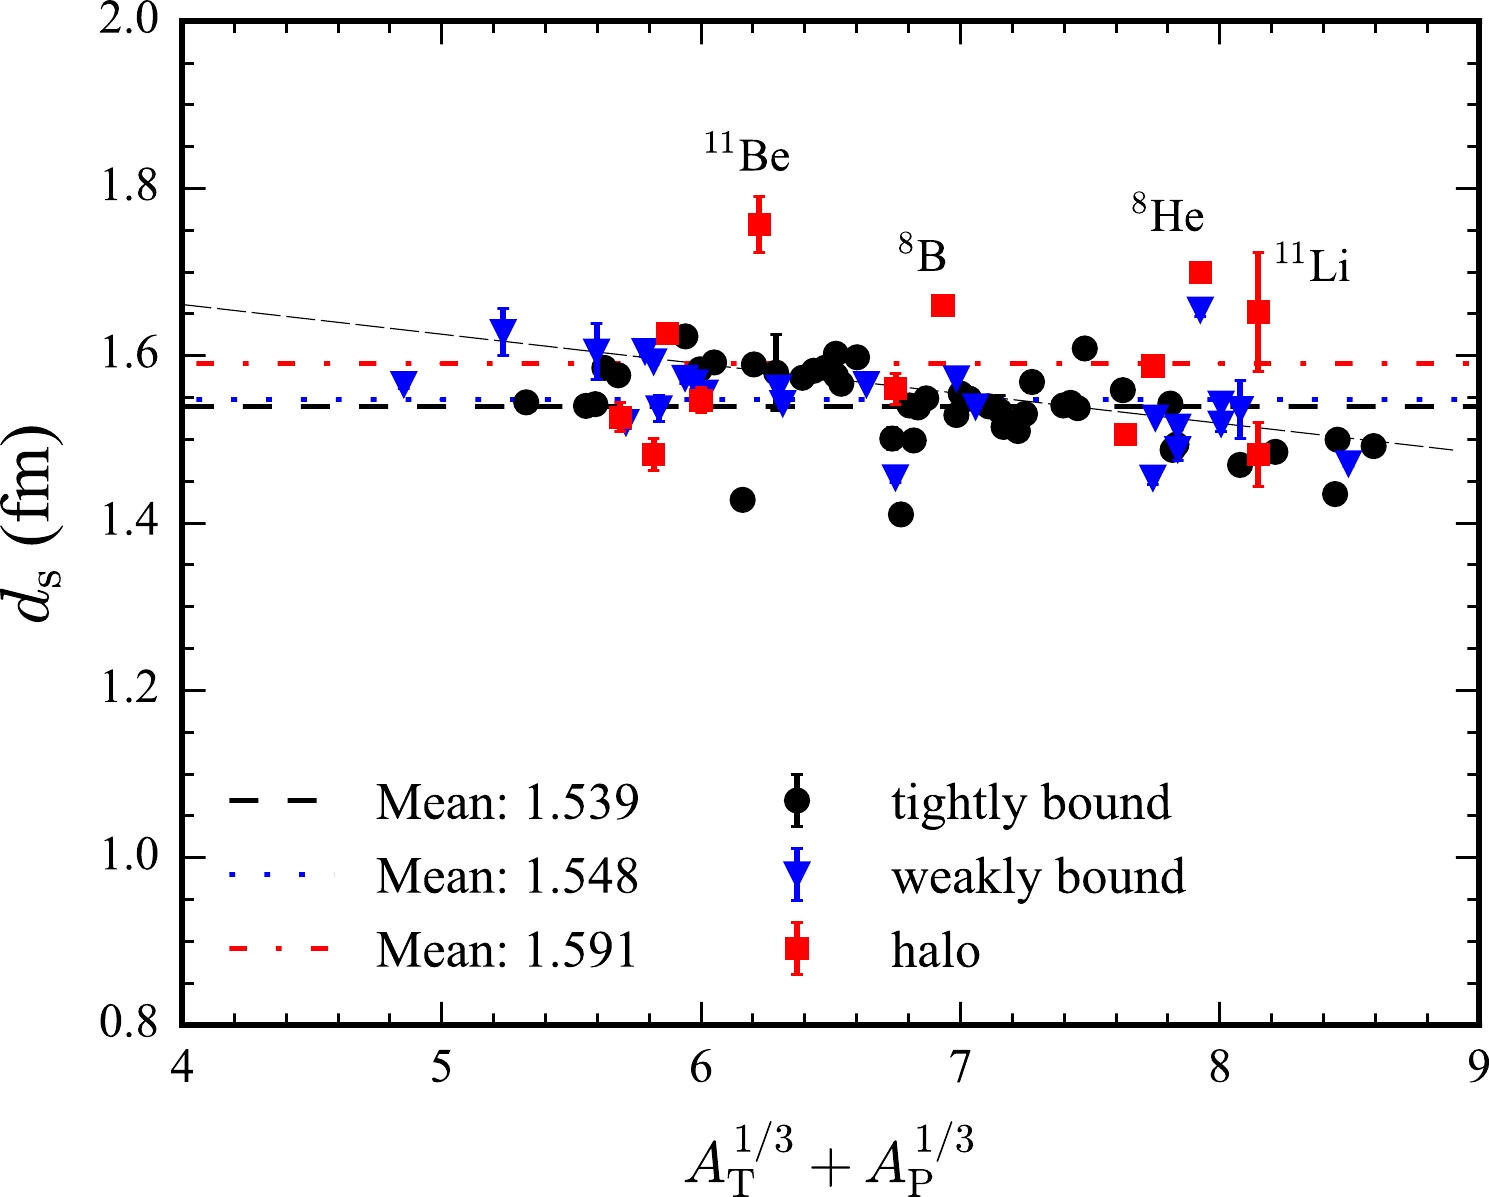
Figure 2. (color online) Reduced strong absorption distance
$ d_\mathrm{S} $ as a function of the system size$ A_\mathrm{T}^{1/3}+A_\mathrm{P}^{1/3} $ . The solid circles, triangles, and squares represent the tightly bound, weakly bound, and halo projectiles, respectively. The mean values of$ d_\mathrm{S} $ for these three types are shown as dashed, dotted, and solid lines for reference. Linear fitting of all the scatter points is shown as the densely dashed line.To compare them, we also calculate the mean values of
$ d_\mathrm{S} $ for the three groups. The mean values of the tightly and weakly bound nuclei are 1.539 fm and 1.548 fm, respectively, which are very close and not easy to distinguish in Fig. 2. The mean value of the halo nuclei is 1.591, which is significantly larger than the other two values. The current trends are similar to those in Ref. [22], where$ d_\mathrm{I} $ was found to be larger for the halo nuclei compared with the weakly bound nuclei, and even more so when compared with tightly bound projectiles. The reason for this phenomenon may be the extremely low binding energies or the Coulomb dipole polarizability of halo nuclei.The linear fitting of
$ d_\mathrm{S} $ for all the data is shown as the densely dashed line. As shown in Fig. 2,$ d_\mathrm{S} $ tends to be smaller with increasing system size. In Fig. 3, we present the name of each reaction with the halo projectile. The distribution of scatter points is relatively far from the mean value. The obvious contrasting reactions are$ {}^{11} $ Be+$ {}^{64} $ Zn and$ {}^{11} $ Be+$ {}^{208} $ Pb, whose$ d_\mathrm{S} $ values are 1.76 fm and 1.48 fm, respectively. Comparing these two reactions, we find that$ d_\mathrm{S} $ is not only dependent on the separation energy of the projectile nucleus, but also exhibits a complex behavior related to the properties of the target nucleus. However, there are still existing data with large error bars. For weakly bound or halo projectiles, the quasielastic scattering reaction can be easily mixed in with elastic scattering. More experiments with high precision should be performed to clarify their systematic behaviors in the future.
Figure 3. (color online) Same as that in Fig. 2, but for only the halo nuclei. The mean value,
$ d_\mathrm{S}=1.591 $ fm, is shown by the dashed line. The reactions are labeled around the corresponding scatter points for reference. -
To study the relationship between the strong absorption distance and the Coulomb barrier radius, we first show the results of
$ R_\mathrm{S} $ as a function of system size$ A_\mathrm{T}^{1/3}+A_\mathrm{P}^{1/3} $ in Fig. 4. The fit to all the extracted data is shown by the solid line, which is
Figure 4. (color online) Similar to that in Fig. 2, but for the strong absorption distance
$ R_\mathrm{S} $ . The Coulomb barrier radius$ R_\mathrm{B}^\mathrm{CW76} $ predicted by Eq. (6) for the CW76 potential is shown by the dashed line. The fit$ R_\mathrm{S}^\mathrm{Fit} $ to all the extracted data is given in Eq. (5) and shown by the solid line.$ \begin{array}{*{20}{l}} R_{\rm S}^{\rm Fit}=1.31(A_{\rm P}^{1/3}+A_{\rm T}^{1/3})+1.72 \; {\rm fm}. \end{array} $

(5) Because
$ d_\mathrm{S} $ is nearly constant with the variation in system size, as demonstrated in Fig. 2, the$ R_\mathrm{S} $ that is$ d_\mathrm{S} (A_\mathrm{T}^{1/3}+A_\mathrm{P}^{1/3}) $ exhibits a linear relationship with the system size. We also show the results of the approximate barrier radius$ R_{\rm B}^{\rm CW76} $ formula based on the CW76 potential for convenience of comparison in Ref. [16], that is,$ \begin{array}{*{20}{l}} R_{\rm B}^{\rm CW76}=1.07(A_{\rm P}^{1/3}+A_{\rm T}^{1/3})+2.72 \; {\rm fm}. \end{array} $

(6) The CW76 potential model has a simple form; however, the prediction of the barrier height
$ V_\mathrm{B} $ is surprisingly in agreement with that extracted from the fusion reactions [59] and sophisticated potential models such as DP2015 [60], which includes the contributions of the macroscopic and shell-correction terms.$ R_\mathrm{S} $ , as the grazing distance in literature [19, 25], should be slightly larger than$ R_\mathrm{B} $ , which is confirmed in this figure.The Coulomb barrier and radius are important physical quantities for applying constraints on potential models. It is worth noting that there have been many studies on extracting the law of
$ V_\mathrm{B} $ from fusion reactions [61−63], including our previous study in Ref. [59]. However, it is difficult to extract simple formulas on$ R_\mathrm{B} $ from fusion reactions. One of the results can be found in Fig. 12 of Ref. [63]. When$ A_{\rm P}^{1/3}+A_{\rm T}^{1/3} $ is greater than approximately 7.7,$ R_\mathrm{B} $ decreases significantly and can be as low as 3 fm when$ A_{\rm P}^{1/3}+A_{\rm T}^{1/3} \approx 9 $ . It is because$ \pi R^2_\mathrm{B} $ can be seen as the measure of the cross section. When the system gets larger, other reaction channels, such as deep inelastic transfer, quasi-fission, or fission, decrease the total fusion cross section and therefore$ R_\mathrm{B} $ . This is a graduate process with increasing system size, which makes it difficult to extract a simple law of$ R_\mathrm{B} $ based on fusion reactions.However, for elastic scattering, the reaction channel is much simpler than that for fusion reactions. Based on the linear relationship shown in Fig. 4, we propose to extract empirical
$ R_\mathrm{B} $ using the following method:$ \begin{aligned}[b] R_{\rm B}^{\rm Emp} & = R_{\rm S} + (R_{\rm B}^{\rm CW76} -R_{\rm S}^{\rm Fit} ) \\ &= R_{\rm S} - 0.24 (A_{\rm P}^{1/3}+A_{\rm T}^{1/3}) + 1.0 \; {\rm fm}. \end{aligned} $

(7) This means that we can estimate the barrier radius
$ R_\mathrm{B} $ based on the extracted grazing distance$ R_\mathrm{S} $ from the quarter-point recipe. This formula is model dependent on$ R_{\rm B}^{\rm CW76} $ in Eq. (6). In Fig. 5, we show a comparison of the formula$ R_{\rm S}^{\rm Emp} $ and$ R_{\rm B}^{\rm CW76} $ and those predicted by the 18 potential models: CW76 [16], BW91 [64], AW95 [65], Bass73 [66], Bass77 [67], Bass80 [19], Prox77 [68], Prox88 [69], Prox00 [70], Prox00DP [71], MWS [72], ETF2 [73], ETF4 [74], NGO80 [75], DP2002 [76], DP2015 [60], DU2011 [77], and GH2016 [78]. We can see that$ R_{\rm B}^{\rm CW76} $ and$ R_{\rm S}^{\rm Emp} $ are in agreement with many models, including BW91, AW95, Bass80, DU2011, GH2016, and especially the sophisticated DP2015 potential. This agreement may increase the credibility of Eq. (7).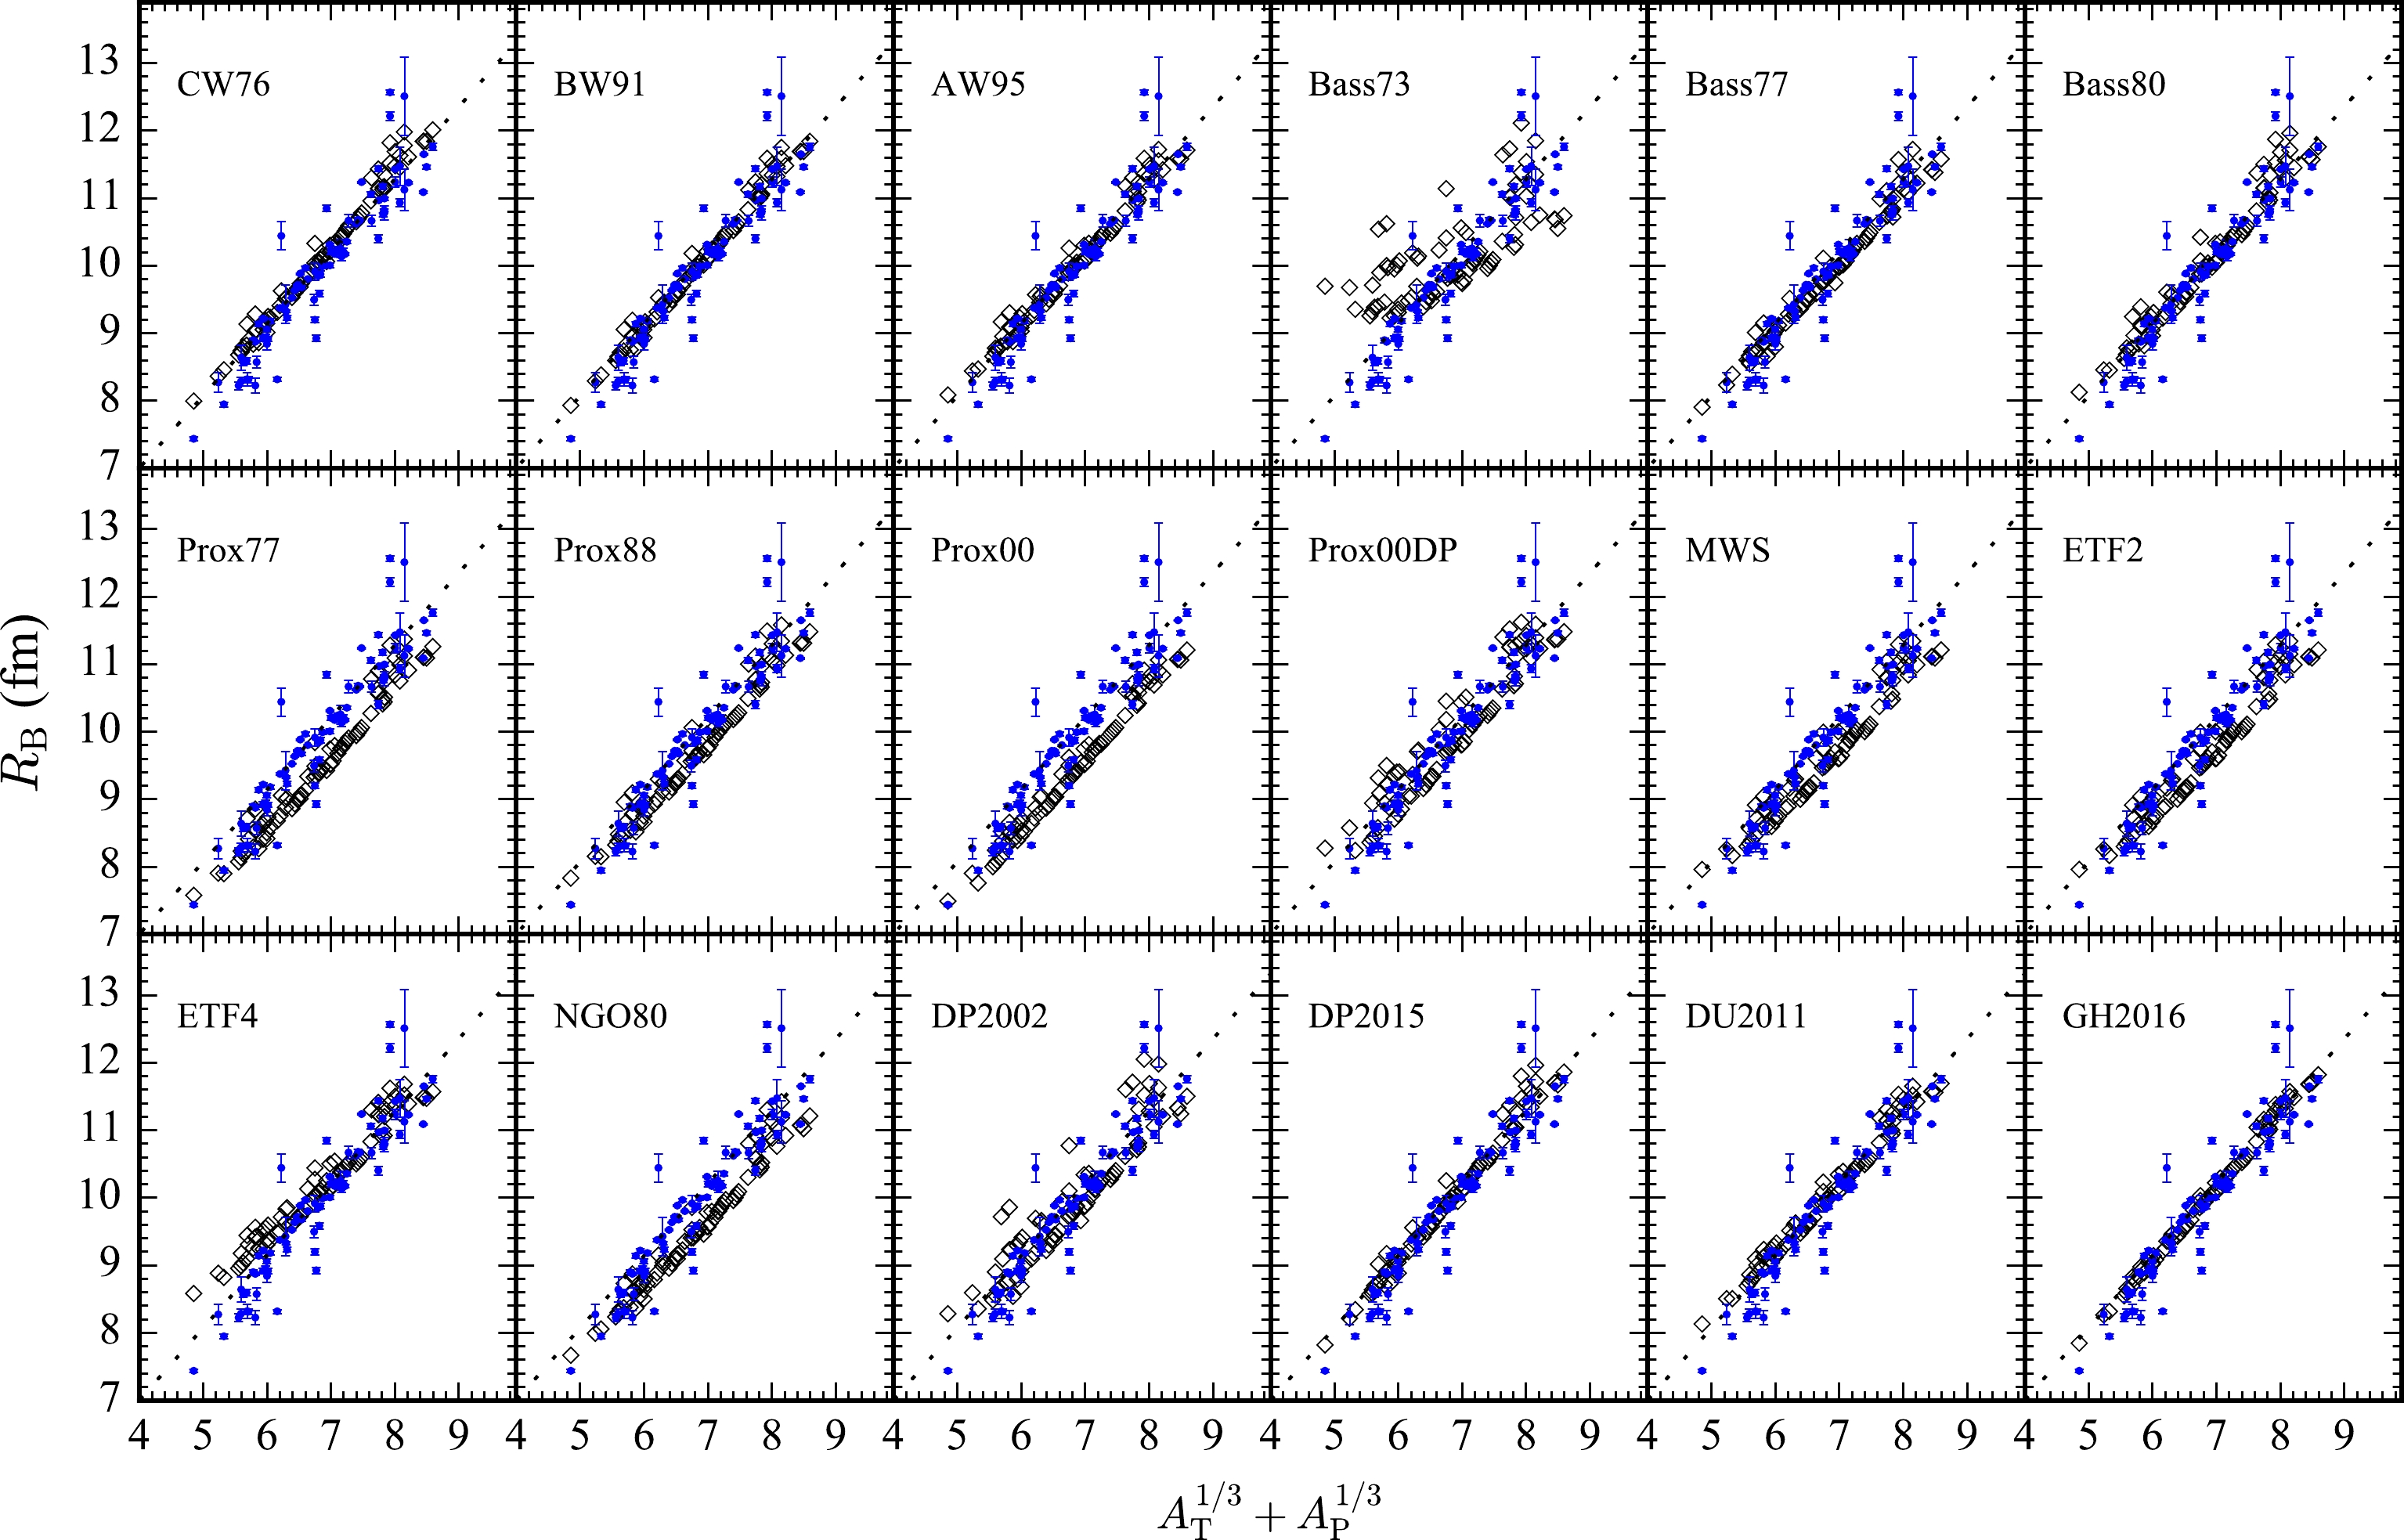
Figure 5. (color online) Coulomb barrier radius as a function of system size
$A_\mathrm{T}^{1/3}+A_\mathrm{P}^{1/3}$ . The theoretical results are presented as open diamonds from 18 potential models. The results of$R_{\rm B}^{\rm Emp}$ in Eq. (7) and$R_{\rm B}^{\rm CW76}$ in Eq. (6) are shown by the solid squares and dotted lines, respectively. -
Based on the formulas in Refs. [19, 25, 28, 29], we can estimate the Coulomb barrier from the quarter-point recipe, which is
$ \begin{align} V_\mathrm{B} = \frac{2E_\mathrm{cm}}{1+\mathrm{csc} (\theta_{{1/4}}/2)}, \end{align} $

(8) where
$ \theta_{\mathrm{1/4}} $ is the quarter-point angle extracted from the elastic scattering experiment. Figure 6 shows the empirical Coulomb barrier height obtained using the above formula with respect to the Coulomb parameter ($ z={Z_{\mathrm{P}} Z_{\mathrm{T}} }/ {(A_\mathrm{P}^{1/3} +A_\mathrm{T}^{1/3})} $ ). The fitting result of the scatter points is shown by the solid line, which is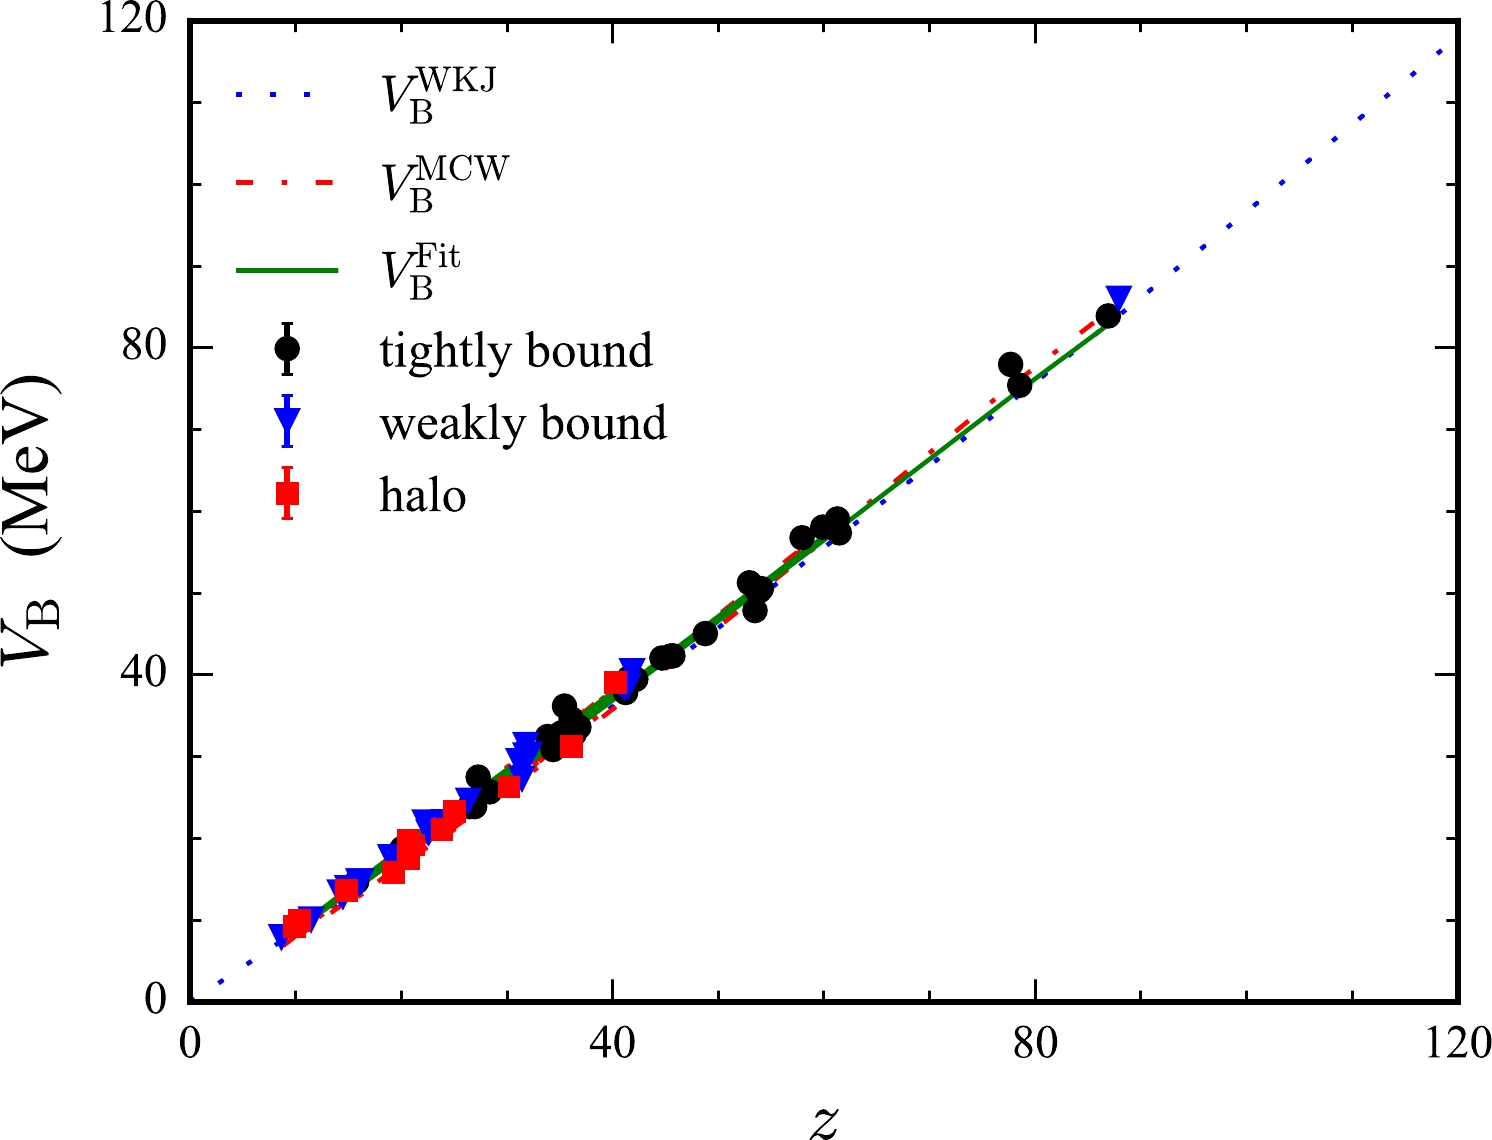
Figure 6. (color online) Coulomb barrier height
$ V_\mathrm{B} $ with respect to the Coulomb parameter z. The solid circles, triangles, and squares represent the empirical results based on Eq. (8) for the indicated groups. The fitting result of the scatters is shown by a solid line. The predictions of the WKJ and MCW formulas are shown by the dotted and dashed lines, respectively.$ V_{\rm B}^{\rm Fit}= \frac{Z_{\rm P} Z_{\rm T} {\rm e}^2}{1.3119(A_{\rm P}^{1/3}+A_{\rm T}^{1/3})+1.6909}. $

(9) In our previous study, we extracted the Coulomb barrier height systematically from the fusion reaction [59]. This is named MCW, which is the modified version of the CW76 potential model:
$ V_{\rm B}^{\rm MCW}= \frac{Z_{\rm P} Z_{\rm T} e^2}{0.9782(A_{\rm P}^{1/3}+A_{\rm T}^{1/3})+4.2833}. $

(10) The barrier heights from the MCW formula are shown to be in good agreement with those from the CW76 potential and complex DP2015 potential. The results of
$ V_{\rm B}^{\rm MCW} $ and$ V_{\rm B}^{\rm WKJ} $ given in Ref. [61] are shown in Fig. 6 for comparison. Although the coefficients in Eqs. (9) and (10) are different, their results are difficult distinguish in this figure. It is remarkable to note that the barrier height based on fusion reactions and the scatter points extracted from the elastic scatterings agree well, which verifies the credibility of these barrier laws when$ z<90 $ . z of fusion reactions used to extract the barrier law reaches 170 in Ref. [59]. More elastic scattering data are needed to determine the laws when$ z\ge 90 $ . This would be critical to verify the barrier law based on quasielastic scattering, which could provide important reference for the syntheses of superheavy nuclei. Additionally, there is an apparent strong linear relationship between$ V_{\rm B} $ and z, accompanied by small fluctuations.Questions arise naturally, namely, why do we obtain similar laws between
$ V_{\rm B} $ from fusion reactions and elastic scatterings, and why do exotic structures such as halos, clusters, and the large deformations brought on by weak binding energies have only a slight influence on this linear relationship? Figure 7 shows the results for the Coulomb barrier height$ V_\mathrm{B} $ (a) and$ V_\mathrm{B}/z $ (b) as a function of the Coulomb parameter$ z={Z_{\mathrm{P}} Z_{\mathrm{T}} }/ {(A_\mathrm{P}^{1/3} +A_\mathrm{T}^{1/3})} $ . The solid circles, triangles, and squares represent the results based on Eq. (8) for tightly bound, weakly bound, and halo projectiles. In Fig. 7 (b), we try to answer the questions by showing the plot of$ V_\mathrm{B}/z $ as a function of the Coulomb parameter z. Large fluctuations in$ V_\mathrm{B}/z $ can be observed from this figure, ranging from approximately 0.8 to 1.0, which is approximately 20% of itself at$ z=0 $ . The area between the approximate lower boundary$ V_\mathrm{L} $ and upper boundary$ V_\mathrm{U} $ of the scatter region is shadowed, and the formulas of the boundaries are shown in the labels. Reflecting on this shadowed region in$ V_\mathrm{B} $ , the large triangle in Fig. 7 (b) becomes a narrow and linear strip in Fig. 7 (a). The comparison illustrates the reduction in other factors such as nuclear structure on the relationship between$ V_{\rm B} $ and z. This can be understood by a transformation of Eq. (10) as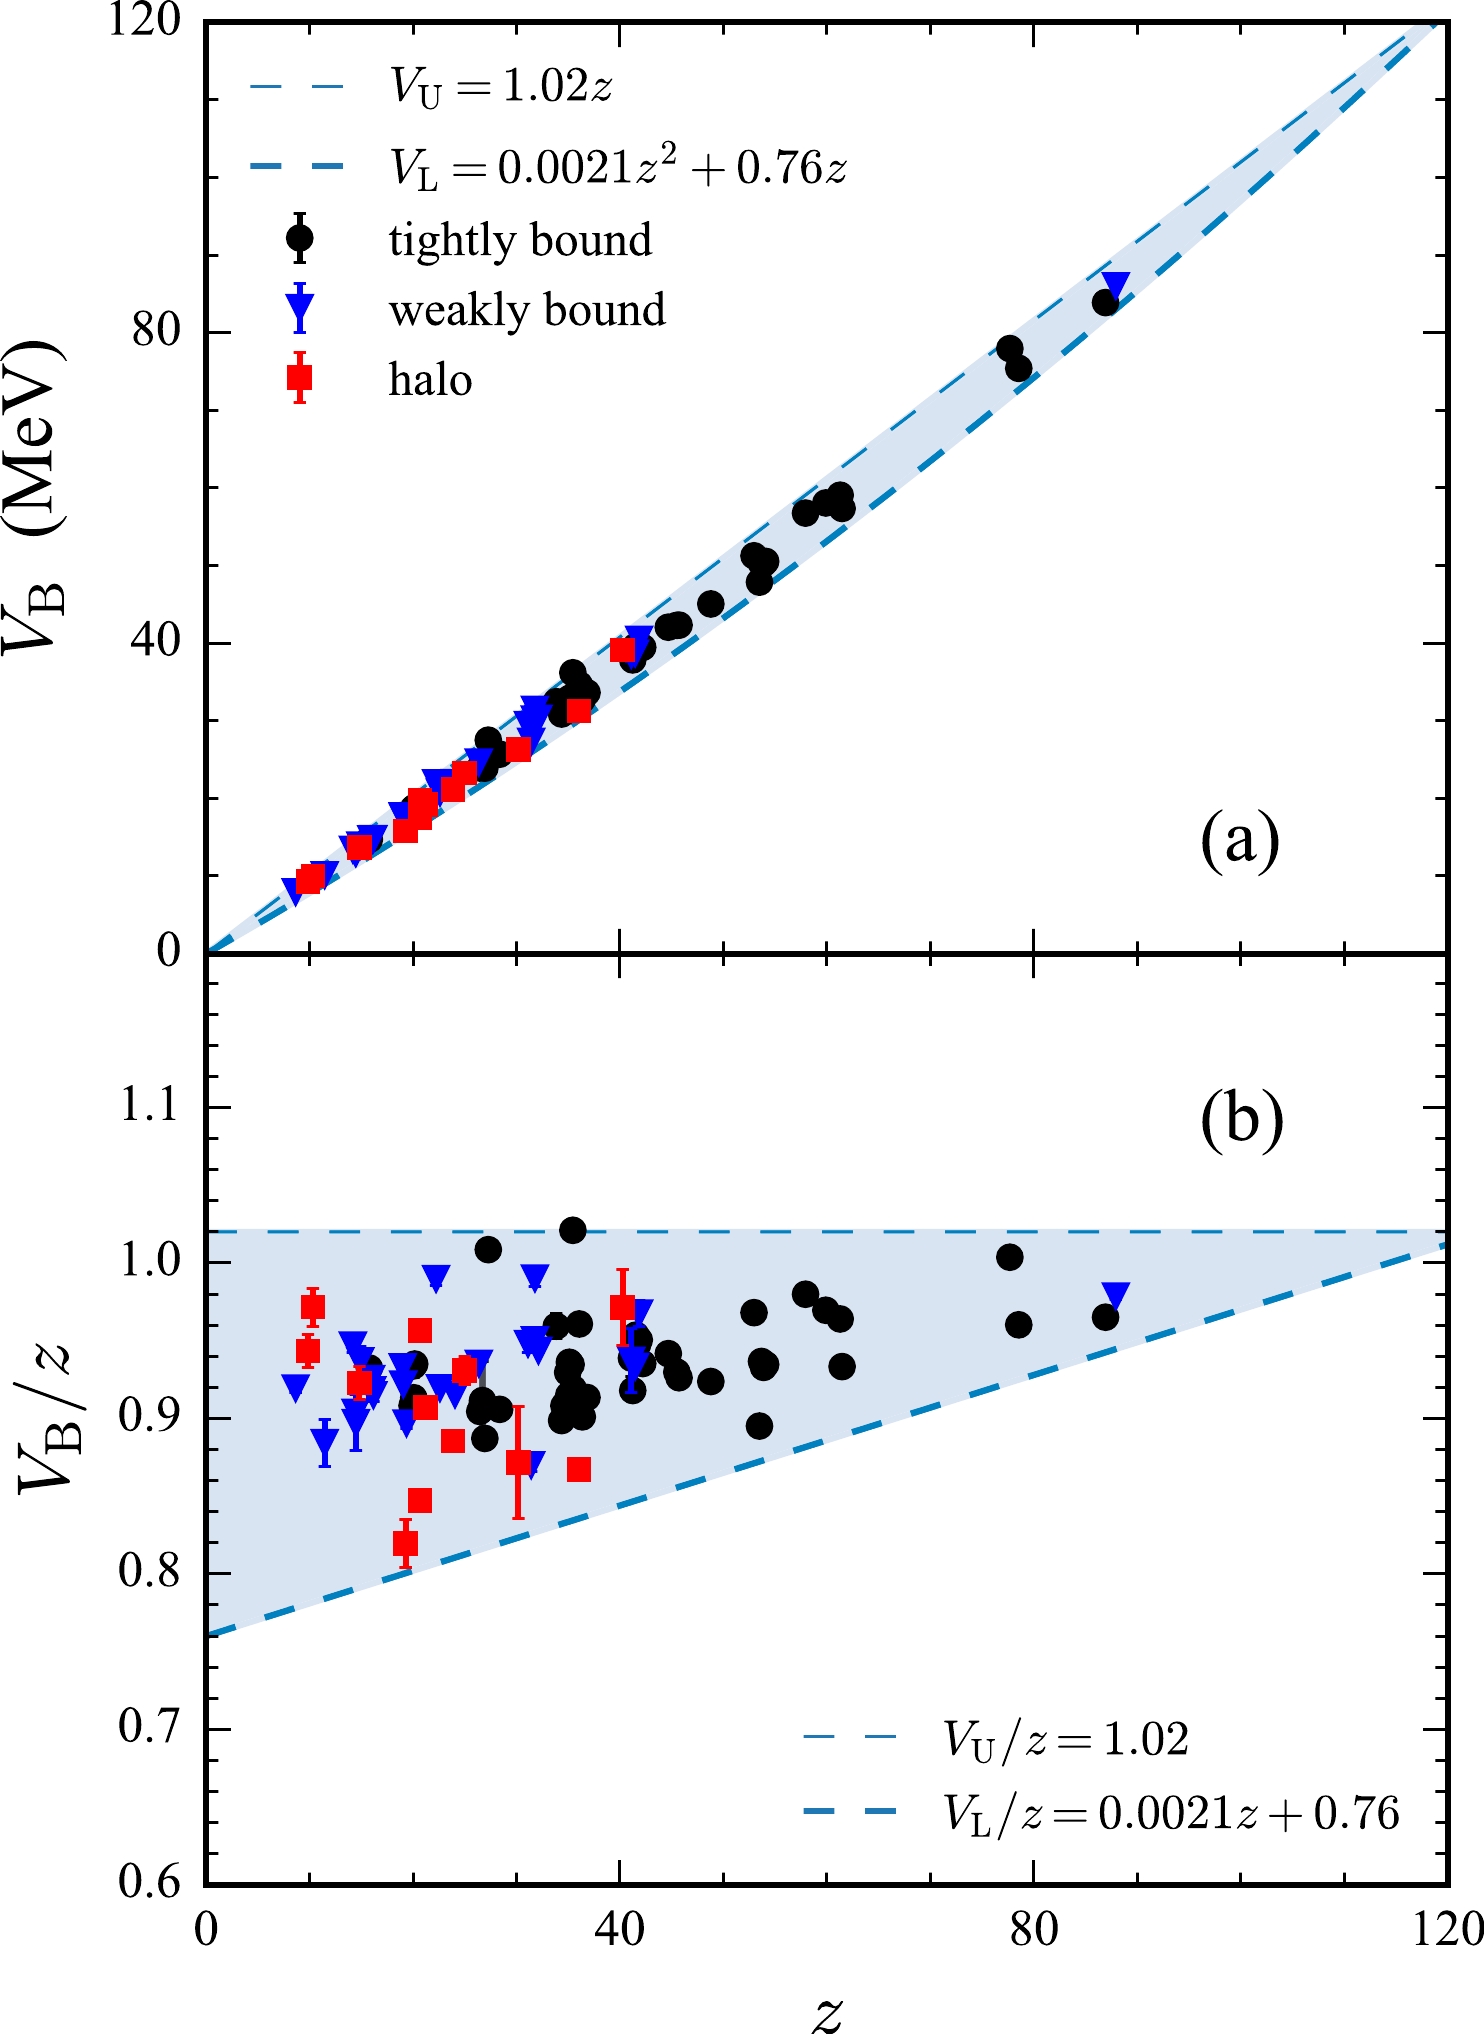
Figure 7. (color online) Coulomb barrier height
$ V_\mathrm{B} $ (a) and$ V_\mathrm{B}/z $ (b) with respect to the Coulomb parameter z. The solid circles, triangles, and squares represent the results based on Eq. (8) for three groups of reactions: tightly bound, weakly bound, and halo projectiles, respectively. The thick and thin dashed lines are the approximate lower$ V_\mathrm{L} $ and upper boundaries$ V_\mathrm{U} $ of the scatter region, the formulas of which are shown in the legends.$ V_{\rm B}^{\rm MCW}/z= \frac{{\rm e}^2}{0.9782+4.2833/(A_{\rm P}^{1/3}+A_{\rm T}^{1/3})}. $

(11) The second term in the denominator on the right side of the above equation may be affected by the system size; for example, by the exotic structures of weakly bound or halo nuclei, or the large deformations of heavy nuclei. When z is small, the changes in
$ V_\mathrm{B} $ with z are also small in the current plot scale. As the system size increases, the second term in the denominator will decrease. This results in a narrow strip at large z. Finally, the shadowed area depicted in Fig. 7 (a) resembles the shape of a slender boat, with narrow ends and a relatively wide middle. -
In summary, based on the quarter-point recipe, we systematically compare the reduced strong absorption distance
$ d_\mathrm{S} $ of tightly bound, weakly bound, and halo nuclei from elastic scattering experimental data. The following three conclusions are obtained: (1) The correlations between the strong absorption distance and binding energy are shown, that is,$ d_\mathrm{S} $ of halo nuclei$ > $ weakly bound nuclei$ > $ tightly bound nuclei. It is found that$ d_\mathrm{S} $ of reactions involving halo projectiles depends not only on binding energy but also on the properties of the target. (2) The extracted strong absorption distance$ R_\mathrm{S} $ exhibits an evident linear relationship with the system size$ (A_{\rm P}^{1/3}+A_{\rm T}^{1/3}) $ . Because it is difficult to extract laws of$ R_\mathrm{B} $ from fusion reactions owing to the interference of reaction channels such as quasi-fission or fission, and elastic scatterings are less affected by other reaction channels, we propose obtaining$ R_\mathrm{B} $ from$ R_\mathrm{S} $ based on a simple transformation. (3) The extracted$ V_\mathrm{B} $ from elastic scattering is proportional to the Coulomb parameter z, which is close to that extracted from fusion reactions. We also find that exotic structures, such as large deformations, have little influence on this linear relationship.
Systematic extraction of the strong absorption distance and Coulomb barrier from elastic scattering
- Received Date: 2023-06-19
- Available Online: 2023-12-15
Abstract: The reduced strong absorption distance


 Abstract
 HTML
HTML Reference
 Related
 PDF
PDF




 DownLoad: