-
According to the Standard Solar Model (SSM) [1−3], approximately 99% of solar power is obtained from a series of reactions wherein hydrogen is fused into helium. Neutrinos emitted during the initial fusion of two protons into a deuteron constitute approximately 91% of the total solar neutrino flux. These neutrinos are commonly referred to as
$ pp $ neutrinos, with a theoretical flux uncertainty at the sub-percent level. The sub-dominant neutrinos from the electron capture of$ ^7 $ Be account for an additional 7% of flux. The precise measurement of solar neutrino flux is essential for verifying the SSM and solving the solar metallicity puzzle [4]. Furthermore, solar neutrinos are crucial for neutrino physics, especially for understanding the matter effect of neutrino oscillation [5]. The first observation of$ pp $ neutrino flux was realized using gallium, a radiochemical material, via GALLEX/GNO [6] and SAGE [7]. The first real-time detection was performed by Borexino with a state-of-the-art precision of$ {\cal{O}} $ (10%) and an electron recoil energy threshold of 165 keV [8, 9]. In this study, we measure$ pp $ neutrino flux in real-time via PandaX-4T within a previously unaccessible recoil energy window between 24 to 144 keV. Additionally, it is the first such measurement using a detector primarily designed for direct dark matter detection.A number of multi-tonne-scale liquid xenon (LXe) experiments, including PandaX-4T [10], LZ [11], and XENONnT [12], are under operation to search for dark matter particles, coherent scattering of solar neutrinos on xenon nuclei [13, 14], and potential abnormal magnetic moments of neutrinos [15−17] in the few or few-tens of keV-scale electron or nuclear recoil energy. Furthermore, by design, these detectors effectively cover an electron recoil energy up to several hundred keV, spanning over most of the energy region of
$ pp $ neutrino.Solar
$ pp $ neutrinos exhibit a continuous energy spectrum with an endpoint at 420 keV. Furthermore,$ ^{7} $ Be neutrinos are mono-energetic at 384 keV (approximately 10%) and 862 keV (90%). The neutrino and electron interact via the electroweak force through the exchange of a Z or W boson, the latter of which is only possible for an electron neutrino. The expected electron recoil event rate per unit recoil energy is$ \begin{align} \begin{aligned} \frac{{\rm d} R}{{\rm d} E_r} &=N \sum_j \int \phi(E_\nu) P_{e j} \frac{{\rm d} \sigma_j(E_\nu,E_r)}{{\rm d} E_r} {\rm d} E_\nu \,, \end{aligned} \end{align} $

(1) where N denotes the number of target electrons,
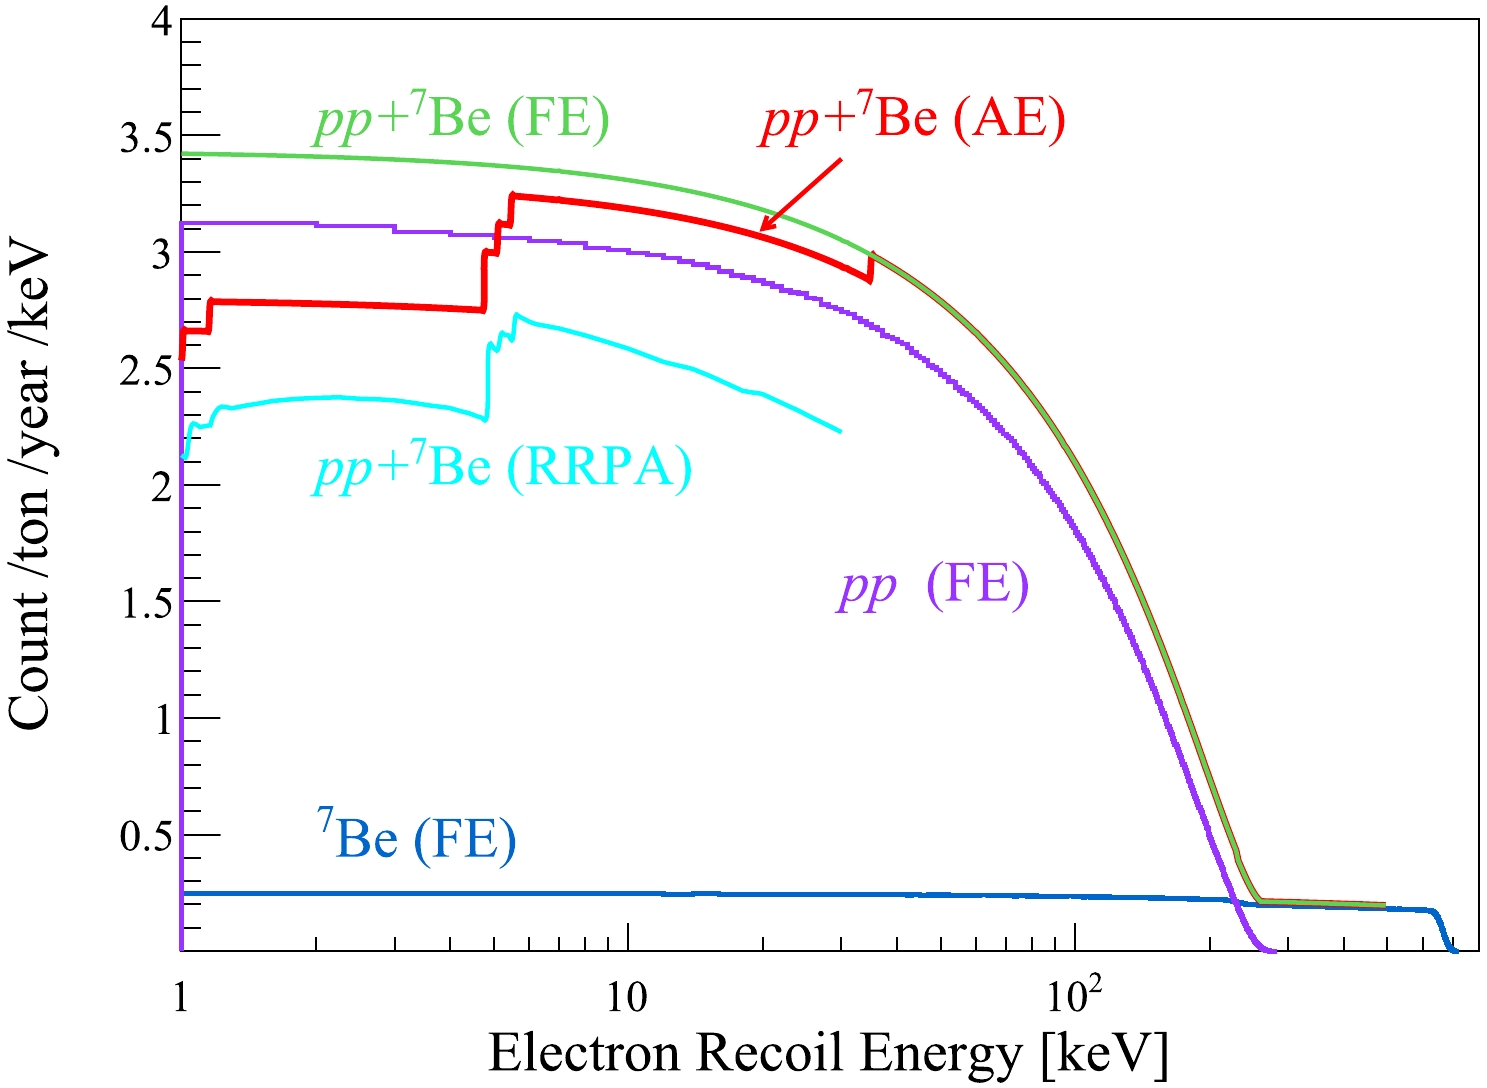
$ \phi(E_\nu) $ denotes the neutrino flux as a function of neutrino energy,$ P_{ej} $ ($ j=e,\mu,\tau $ ) denotes the oscillation probabilities of$ \nu_e $ into flavor j, and$ d \sigma_j $ denotes the differential cross-section. Figure 1 shows the electron recoil energy spectrum of solar$ pp $ and$ ^7 $ Be neutrinos in a LXe detector, as shown in Ref. [18]. When the xenon atomic effects are considered (adopted in this study), the rate in the region of interest (ROI) is suppressed by a few percent when compared to that in the free electron scenario.
Figure 1. (color online) Neutrino-electron elastic scattering spectrum of solar neutrinos with liquid xenon. If the binding energy of atomic electrons (AE) is considered [18] (red curve), the scattering event rate in our region of interest is lower than the free electron (FE) scenario (green curve). A complete treatment using the relativistic random phase approximation (RRPA) is shown in cyan, but only for a recoil energy of less than 30 keV.
PandaX-4T detector is located in B2 hall of the China Jinping Underground Laboratory [19, 20]. The sensitive target of PandaX-4T contains 3.69 tonne of liquid xenon in a cylindrical dual-phase xenon time projection chamber (TPC). Specifically, the chamber is 118.5 cm in diameter and 116.8 cm in height [21]. The prompt scintillation photons (
$ S1 $ ) and delayed electroluminescence photons ($ S2 $ ) are generated when a given energy is deposited in the sensitive volume. Furthermore,$ S1 $ and$ S2 $ signals are recorded by the top and bottom photomultipliers (PMT) arrays, which are equipped with 169 and 199 Hamamatsu 3-inch PMTs. Detailed discussions of the PandaX-4T detector can be found in Ref. [10].This analysis selects different data samples when compared to existing analyses of the commissioning data release [10, 13, 22]. The energy ROI ranges from 24 keV to 144 keV wherein more than 60% of the solar
$ pp $ neutrino events are included. The lower boundary is selected above the dark matter particle search region, and the upper boundary is selected to avoid the prominent 163.9 keV peak from$ ^{\rm{131m}} $ Xe produced in the neutron calibration runs. In the ROI, the detector noise has a negligible effect on both$ S1 $ and$ S2 $ signals. Therefore, we can recover approximately 9.5% of exposure previously excluded in the dark matter analysis due to elevated detector noise [10]. In addition, data of 8.4 days following a neutron calibration run are removed because of a high concentration of activated$ ^{133} $ Xe and$ ^{125} $ I. Finally, a total data set of 86.5 days is used for this analysis.The PMT gains are calibrated using a newly implemented "rolling gain" approach, which fits single photoelectron (SPE) spectra for individual PMTs on a run by run basis, as adopted in a recent study [21]. Our previous analyses calculated PMT gains with weekly light-emitting-diode (LED) calibration. To avoid biases in our data selections, selection cuts are first determined with LED-gain calibration data, validated with approximately 13.5 days of rolling gain physics data, and finally applied to the entire data set.
The quality cut variables are inherited from the dark matter analysis [10], but cut parameters are modified to suit the differing energy window. The main difference is the relaxation of the top and bottom PMT charge ratio requirements in the
$ S2 $ signal selection to accommodate the top$ S2 $ saturation. The total quality cut efficiency is$ (99.1 \pm 0.1) $ %. The scattering of solar$ pp $ neutrinos on electrons is primarily single-site (SS). The identification of SS events follows the same procedure as in Ref. [10]. The SS efficiency is$ (99.7 \pm 0.1) $ %, which is calculated using$ ^{220} $ Rn calibration, and is consistent with simulation.The horizontal position reconstruction follows the same procedure as that in Ref. [21], where de-saturated waveforms and improved optical Monte Carlo simulation are used. The reconstruction uniformity is confirmed with a diffusive
$ ^{83\rm m} $ Kr calibration source injected into the TPC [23]. Furthermore, a mono-energetic peak of$ ^{83\rm m} $ Kr is used to generate an energy response map. The corresponding correction procedure follows that in Ref. [10].The energy in LXe TPC is reconstructed as in Refs. [24, 25]. The energy spectrum is further corrected using a quadratic function between the reconstructed energy and true energy of characteristic peaks at 41.6 keV (
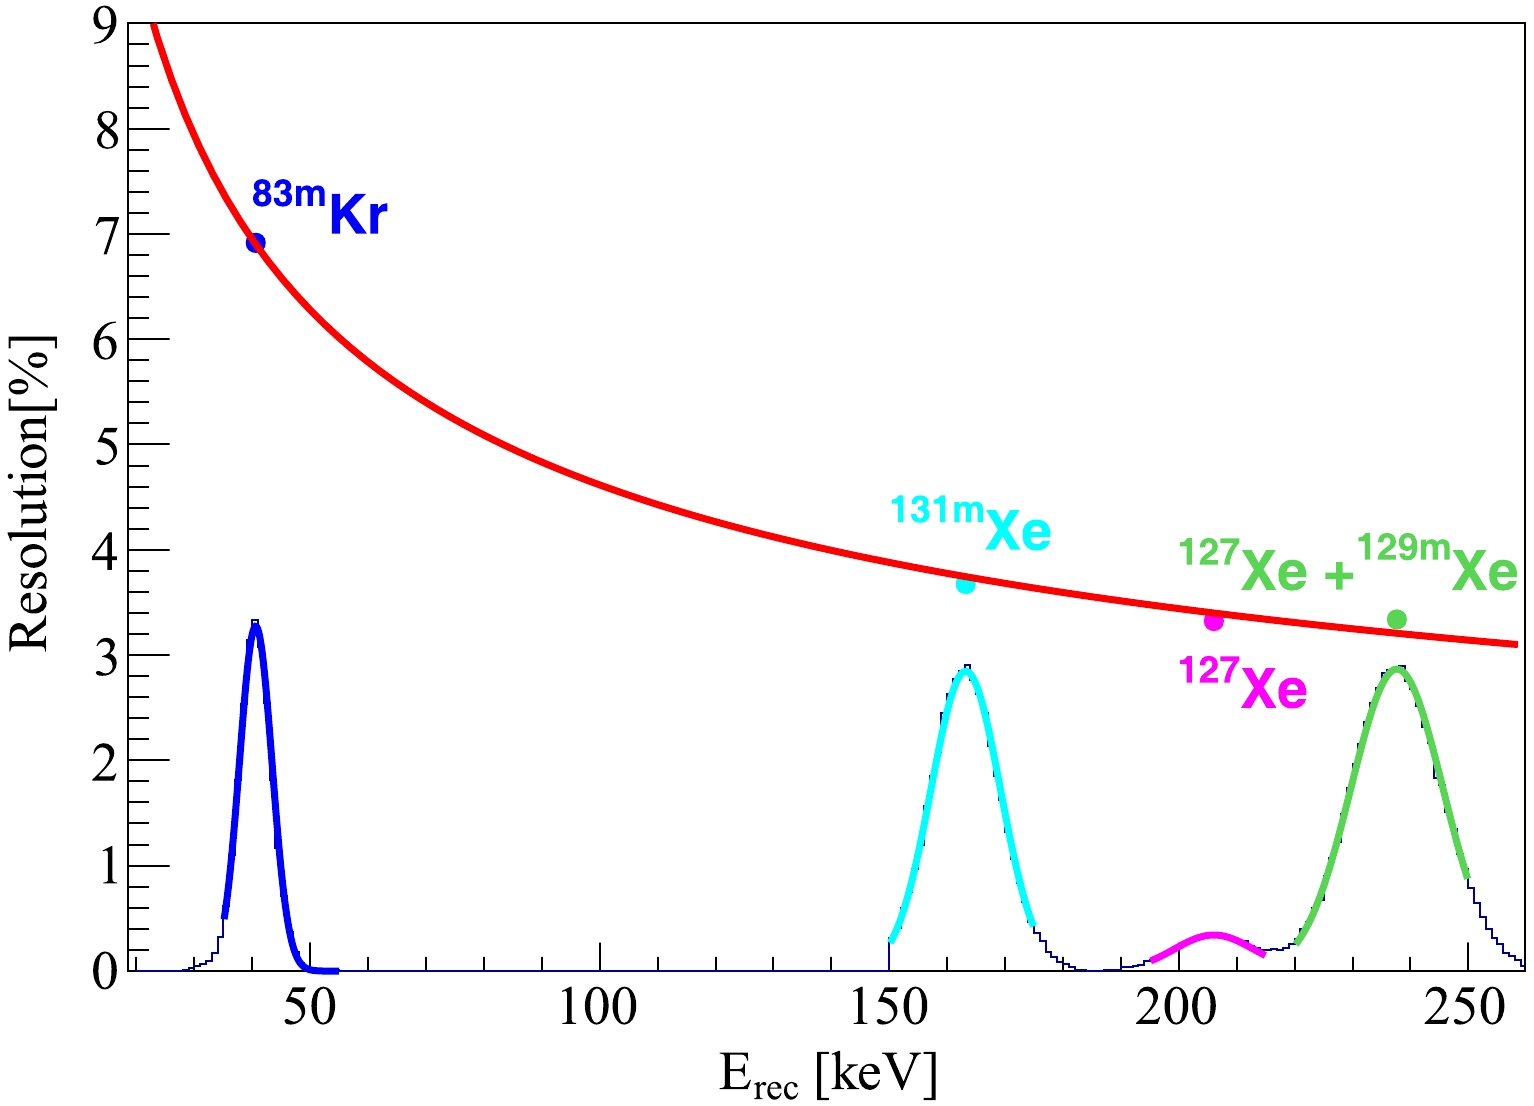
$ \mathrm{^{83m}Kr} $ ), 163.9 keV ($ \mathrm{^{131m}Xe} $ ), 208.1 keV ($ \mathrm{^{127}Xe} $ ), and 236.1 keV ($ \mathrm{^{129m}Xe} $ and$ \mathrm{^{127}Xe} $ ). After the correction, the residual offset of energy peaks in the ROI is smaller than 1 keV, which is considered as the systematic uncertainty of the energy reconstruction. The relative$ 1\sigma $ energy resolution at 24 keV (144 keV) is 8.8% (3.9%), as shown in Fig. 2.
Figure 2. (color online) Energy resolution using characteristic peaks at 41.6 keV, 163.9 keV, 208.1 keV, and 236.1 keV. The red curve shows the fit function
$ \sigma/E = 0.40/\sqrt{E\,[\mathrm{keV}]} $ + 0.0061.The fiducial volume (FV) cuts and events in the ROI are shown in Fig. 3 as dashed lines and blue dots, respectively. The FV selection is the same as in dark matter analysis geometrically, and a total of
$ 2.66\pm0.02 $ tonnes of LXe is used in the center of the TPC. The slight difference with respect to the values in Ref. [10] is from the event position reconstruction.
Figure 3. (color online) Spatial distributions of the selected physics events in
$ \mathrm Z $ vs.$R^2$ (top) and$Y$ vs.$X$ (bottom). The dashed lines show the boundary of the fiducial volume, and blue (gray) dots represent events inside (outside) the fiducial volume.The primary challenge in this analysis lies in the accurate rate estimation of various background components with smooth energy spectra that resemble the shape of solar
$ pp $ signals. The background sources in the ROI include radon and krypton impurities in liquid xenon, detector materials, and radioactive xenon isotopes. The expected background sources are listed in Table 1 and described below.Components Expected events Fitted events $ ^{214} $ Pb

1865 $ \pm $ 110

1849 $ \pm $ 113

$ ^{212} $ Pb

276 $ \pm $ 71

271 $ \pm $ 80

$ ^{85} $ Kr

489 $ \pm $ 254

423 $ \pm $ 249

Materials 683 $ \pm $ 27

682 $ \pm $ 27

$ ^{136} $ Xe

1009 $ \pm $ 46

1002 $ \pm $ 47

$ ^{133} $ Xe

free 4767 $ \pm $ 135

$ ^{124} $ Xe

free 317 $ \pm $ 63

$ ^{125} $ I

free 31 $ \pm $ 57

$ ^{127} $ Xe

free 59 $ \pm $ 23

$ pp $ +

$ ^{7} $ Be neutrino

− 231 $ \pm $ 257

Table 1. Expected and fitted background and signal events in the ROI. Note that fitted uncertainties contain the statistical and some systematic components. See text for details.
One major background in the ROI arises from the progeny of internal
$ ^{222} $ Rn – the β decay of$ ^{214} $ Pb to the ground state of$ ^{214} $ Bi [21]. The ratio of events in the ROI to the full SS energy spectrum of$ ^{214} $ Pb β decay is determined by a dedicated$ ^{222} $ Rn injection calibration run, with$ 3.5\times 10^5 $ $ ^{214} $ Pb SS events accumulated over approximately 11 days. The event ratio is measured as$ 0.039 \pm 0.001 $ , with the uncertainty estimated based on the difference between our data and a recent theoretical prediction to accommodate the non-unique first-forbidden nature of$ \mathrm{^{214}Pb} $ decay [26]. The corresponding number of$ ^{214} $ Pb events in the ROI is$ 1865\pm110 $ , in which the uncertainty combines the fitted uncertainty of the overall$ ^{214} $ Pb decay rate in the physics data [21] and the uncertainty of the event ratio within our ROI. Furthermore, along the decay chain of$ ^{222} $ Rn, β decay of$ ^{214} $ Bi can be identified effectively using$ ^{214} $ Bi–$ ^{214} $ Po coincidence, as the half-life of$ ^{214} $ Po is 164 μs. In our analysis, when a$ ^{214} $ Bi-like event is determined, we reject the event if an α event is found within the following 5 ms window. The residual$ ^{214} $ Bi is no longer included in the spectrum fit. The loss of live time due to random coincidence is negligible.The expected contribution from β decay of
$ ^{212} $ Pb in the$ ^{220} $ Rn decay chain follows the approach in Ref. [21]. The ratio between$ ^{212} $ Pb and subsequent$ ^{212} $ Po α events is determined using a$ ^{220} $ Rn injection calibration run. Then, using the$ ^{212} $ Po α events identified in the physics data, the number of$ ^{212} $ Pb events in the ROI is estimated as$ 276 \pm 71 $ , where the uncertainty is dominated by the variation in$ ^{212} $ Pb/$ ^{212} $ Po ratio during the$ ^{220} $ Rn injection run.The concentration of
$ ^{85} $ Kr is estimated as 0.52$ \pm $ 0.27 parts per trillion [21], leading to 489$ \pm $ 254 events in the ROI. The levels of radioactivity from PMTs and detector vessels have been determined from the wide energy spectrum fit in Ref. [22], resulting in$ 683 \pm 27 $ events. The expected background from$ ^{136} $ Xe$ 2\nu\beta\beta $ is$ 1009 \pm 46 $ in the ROI, obtained from the half-life measured by the PandaX-4T experiment with an exposure of 15.5 kg$ \times $ year of the$ ^{136} $ Xe isotope [22].The contributions of
$ ^{133} $ Xe,$ ^{127} $ Xe,$ ^{125} $ I, and$ ^{124} $ Xe are free and fitted in the final spectral analysis, as they cannot be constrained by our data outside the ROI. The energy spectrum of$ ^{133} $ Xe, activated during a neutron calibration run, has a distinctive rising slope starting at 81 keV. Cosmogenic$ ^{127} $ Xe is introduced when some xenon exposed to the Earth's surface is filled into the detector, thereby contributing to the background with K-shell electron capture around 33.2 keV. Neutron-activated$ ^{125} $ Xe decays quickly when compared to the relatively long-lived$ ^{125} $ I with a half-life of 59.4 days.$ ^{125} $ I electron capture can release a total energy of 67.3 keV (K-shell), 40.4 keV (L-shell), and 36.5 keV (M-shell) [27]. The reduction rate of$ ^{125} $ I observed in the TPC is significantly more rapid than the natural lifetime of$ ^{125} $ I, likely due to the removal by the xenon circulation and purification system. Two-neutrino double-electron capture of$ ^{124} $ Xe (abundance η= 0.095%, Q = 2857 keV) deposits energy within our ROI at 64.3 keV (KK-shell) and 32.3−37.3 keV (KL, KM, and KN-shells) [27, 28]. Therefore,$ ^{125} $ I ($ ^{124} $ Xe) events in the data are modeled as three (four) Gaussian peaks with relative areas fixed by the capture fractions and widths fixed by the resolution function (Fig. 2). However, the overall normalization corresponds to a free fit parameter.The spectrum fit is based on a binned likelihood procedure using the RooFit package [29]. Each background component is simulated using BambooMC [30], a Monte Carlo simulation package based on the Geant4 framework [31]. The contributions from
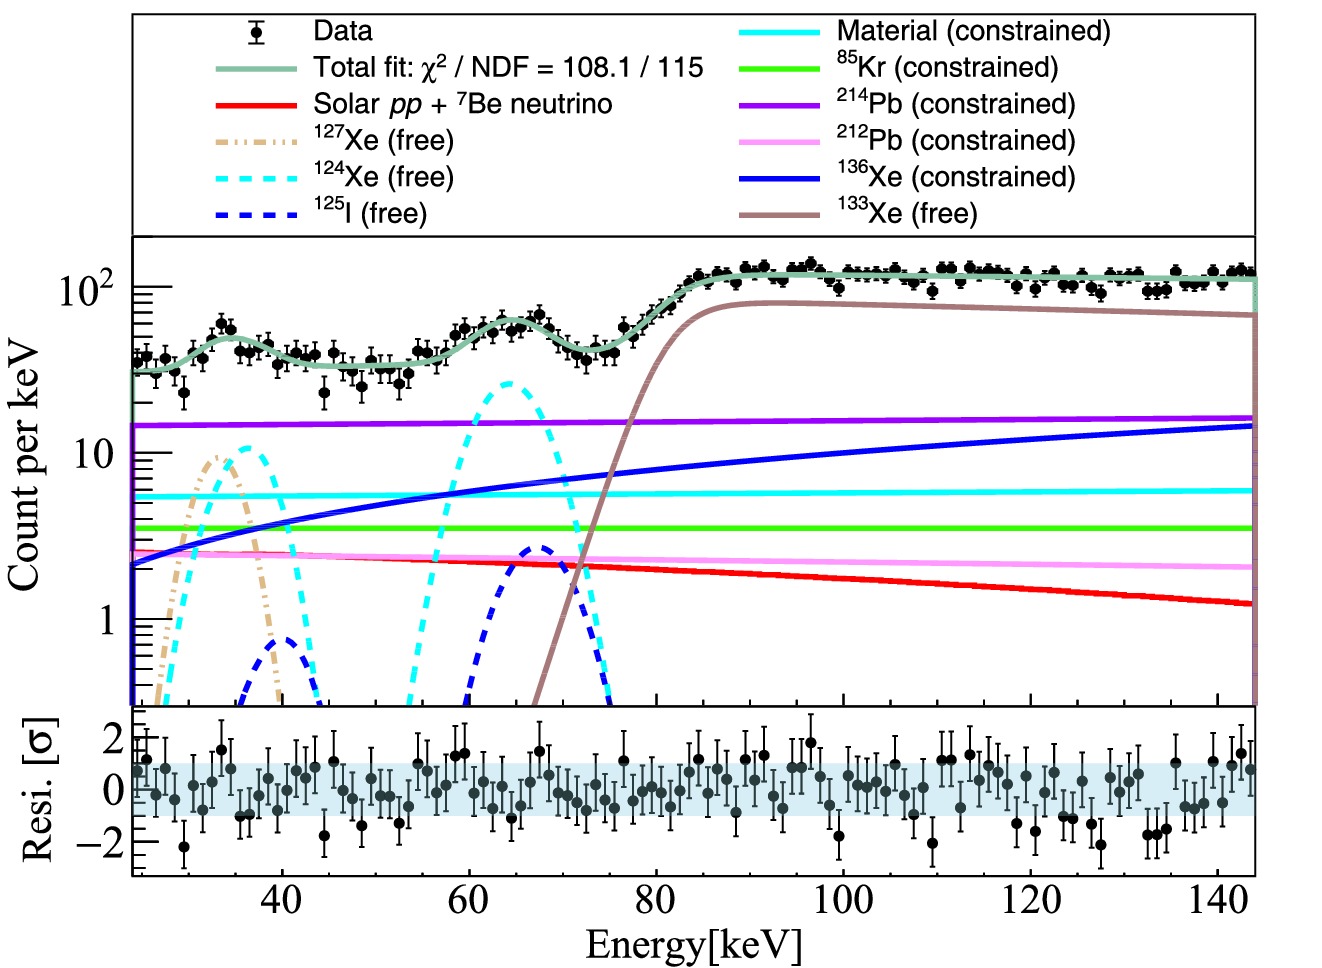
$ ^{214} $ Pb,$ ^{212} $ Pb,$ ^{85} $ Kr, detector materials, and$ ^{136} $ Xe are constrained using the uncertainties described earlier and listed in Table 1. The normalizations of$ ^{133} $ Xe,$ ^{127} $ Xe,$ ^{125} $ I, and$ ^{124} $ Xe are maintained free in the fit. The solar$ pp $ and$ ^7 $ Be neutrino signals are combined into a single fit component.The result of the spectrum fit is shown in Fig. 4. The solar
$ pp $ +$ ^7 $ Be neutrino signals correspond to 231$ \pm $ 257 events. Consistent results are obtained with a binned likelihood fit similar to that implemented in Ref. [22]. The fitted results of each background are listed in Table 1. The best-fit background contributions from detector materials,$ ^{85} $ Kr,$ ^{214} $ Pb, and$ ^{212} $ Pb, are very close to the input nominal values, indicating that the spectrum fit does not try to increase or decrease background levels because their shape characters are similar.
Figure 4. (color online) Result of the spectrum fit and the corresponding residual plot in the bottom panel. The solar
$ pp $ +$ ^{7} $ Be neutrino is represented by the red line. The constrained and free-floating backgrounds are represented by solid and dashed lines, respectively.The total uncertainty of the
$ pp $ +$ ^7 $ Be neutrino signals is broken down into three terms (Table 2): statistical uncertainty ($ \sigma_{\rm{stat}} $ ), systematic uncertainty incorporated in the likelihood fit with nuisance parameters ($ \sigma_{\rm{sys1}} $ ), and additional systematic uncertainty evaluated by hand ($ \sigma_{\rm{sys2}} $ ). We discuss them in turn below.Components Counts $ \sigma_{\rm{stat}} $ 

− 113 $ ^{85} $ Kr

202 $ ^{214} $ Pb

87 $ ^{212} $ Pb

69 $ \sigma_{\rm{sys1}} $ 

Material 21 $ ^{136} $ Xe

19 Data selection 29 Subtotal 231 Energy scale 142 Energy resolution 19 Fit range 29 $ \sigma_{\rm{sys2}} $ 

$ ^{214} $ Pb spectrum

84 $ ^{212} $ Pb spectrum

18 $ ^{85} $ Kr spectrum

5 $ ^{136} $ Xe

$ 2\nu\beta\beta $ half-life

16 Subtotal 170 Total 287 Table 2. Summary of contributions to
$ pp $ +$ ^7 $ Be neutrino signal uncertainties. The contribution of each constrained parameter is extracted by turning on/off the corresponding penalty term in the fitter, assuming no correlation with other constraints. Hence, the quadrature combination of those rows differs slightly from the subtotal$ \sigma_{\rm{sys1}} $ obtained directly by the fitter, which accounts for all correlations accurately.The statistical uncertainty
$ \sigma_{\rm{stat}} $ is determined as 113 events by re-fitting the data with all constrained parameters fixed to their best-fit values without the penalty terms. The overall size of$ \sigma_{\rm{sys1}} $ is then evaluated to be 231 events using$ \sqrt{\sigma^2-\sigma_{\rm{stat}}^2} $ , representing the residual component of the fit uncertainty. To quantify the contribution to$ \sigma_{\rm{sys1}} $ due to a given component (assuming that it is uncorrelated with the rest), we use a similar approach by refitting the data by only "tuning on" the nuisance parameter of this component. Furthermore, all other nuisance parameters were fixed to their best-fit values.$ \sigma_{\rm{stat}} $ is then subtracted from the resulting fit uncertainty in quadrature. Moreover, the evaluated individual contributions are summarized in Table 2. Among all constrained backgrounds,$ ^{85} $ Kr,$ ^{214} $ Pb, and$ ^{212} $ Pb dominate the contribution to$ \sigma_{\rm{sys1}} $ with uncertainties of 202, 87, and 69 events, respectively. The uncertainties of data selection, including the FV, quality cuts, and SS fraction, affect the signal number proportionally with an estimated uncertainty of 29 events.Additional systematic uncertainties
$ \sigma_{\rm{sys2}} $ are evaluated manually. The uncertainty from the reconstructed energy scale is determined by comparing the baseline fit result with new fit results, obtained by shifting the data energy spectrum by$ \pm1 $ keV. The larger difference caused by the shifts is 142, which is used as the uncertainty. To evaluate the contribution due to the energy resolution uncertainty, we perform the fit by imposing different background spectra with different energy resolutions. A$ \pm 1\sigma $ difference in the energy resolution function propagates to an uncertainty of 19 events. The fit range uncertainty is evaluated to be 29 events by varying the ROI to 25–143 keV and 23–145 keV. The uncertainty introduced by the$ ^{214} $ Pb spectrum shape was estimated as 84 events by comparing the theoretical spectrum in the baseline fit to the shape directly measured in the calibration data. Similarly, the spectral shape differences between the Geant4 [30] prediction and a recent theoretical calculation of$ ^{212} $ Pb and$ ^{85} $ Kr [26] are also considered, and the systematic uncertainties are found to be 18 and 5, respectively. We also fit the data by taking the half-life of$ ^{136} $ Xe$ 2\nu\beta\beta $ from EXO-200 [32], the most precise result to date, as the input value. This results in a difference of 16 events when compared to our baseline fit, which is also considered a component of systematic uncertainty. In total,$ \sigma_{\rm{sys2}} $ corresponds to 170 events.Therefore, the final detected number of
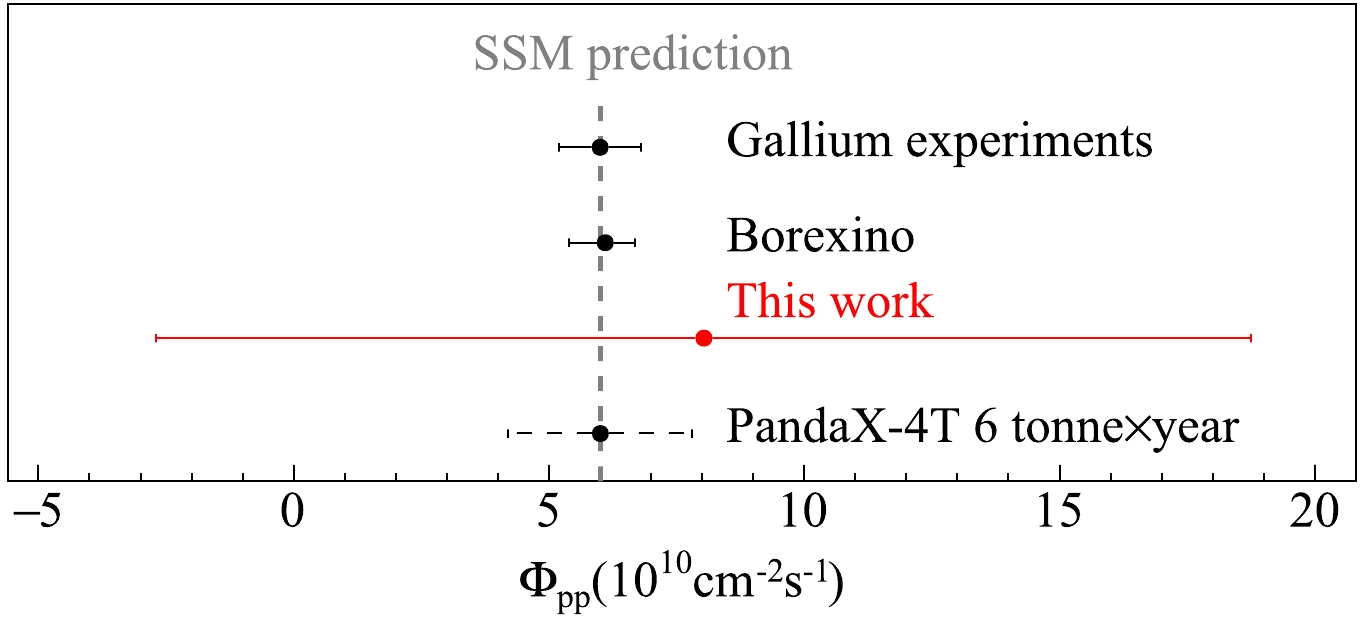
$ pp $ +$ ^{7} $ Be neutrinos is$ 231 \pm 113\,(\rm{stat}) \pm 287\,(\rm{syst}) $ events from our analysis. The corresponding solar$ pp $ neutrino flux is$ (8.0 \pm 3.9\,(\rm{stat}) \pm 10.0\,(\rm{syst})) \times 10^{10}\, \rm{s}^{-1} \rm{cm}^{-2} $ , based on the expected ratio of$ pp $ to$ ^{7} $ Be fluxes from the SSM and their contributions to the ROI. The result is consistent with the SSM expectation [4] and Borexino measurement [9], as shown in Fig. 5. Based on this, we obtain a$ pp $ neutrino flux upper limit of$ 23.3\times 10^{10}\, $ $ \rm{s}^{-1} \rm{cm}^{-2} $ at 90% C.L..
Figure 5. (color online) Solar
$ pp $ neutrino flux measured by PandaX-4T (red), compared with gallium experiments [34] and Borexino [9]. The vertical dashed line indicates the average$ pp $ neutrino flux from the high-metallicity and low-metallicity SSMs [4]. The PandaX-4T projection with 6 tonne$ \times $ year exposure is indicated at the bottom (centered at the SSM).The results of the analysis in this study represent the first attempt to directly measure solar
$ pp $ neutrinos at an electron recoil energy below 150 keV using Liquid xenon. The analysis demonstrates the potential of multi-tonne-scale LXe detectors for solar neutrino studies in a completely new energy window. With an optimized online cryogenic distillation system, we expect to reduce the radon and krypton concentration by a factor of 1.8 or more [33]. Additional efforts, such as replacing TPC materials and circulation pumps, are being implemented for background reduction. Additional$ ^{222} $ Rn calibration data and improved detector response with upgraded PMT readout circuit boards are expected to significantly reduce systematic uncertainties. Assuming a$ ^{222} $ Rn level of 3.5 μBq/kg, a krypton-to-xenon mole concentration of 0.25 ppt, and the absence of any activated short-lived xenon isotopes and imposing a 5% constraint on all backgrounds, PandaX-4T can measure the solar$ pp $ neutrinos with an uncertainty of 30% with 6 tonne$ \times $ year exposure.
HTML
-
We thank the CJPL administration and Yalong River Hydropower Development Company Ltd. for all their help, including indispensable logistical support.


 Abstract
 HTML
HTML Reference
 Related
 PDF
PDF


 DownLoad: