-
The detection of high-energy astrophysical neutrinos needs a large amount of media as a neutrino interaction target. An ideal detection approach is to deploy thousands of photon sensors in a vast space filled with water or ice to capture the Cherenkov light generated by neutrino interactions. IceCube, a telescope in the Antarctic ice with a depth of over 2000 m and a volume of 1 km3 [1], has achieved many inspiring results that confirmed the existence of astrophysical neutrinos [2]. Telescopes with similar scale in water are also under construction, such as KM3NeT, a submarine telescope in the Mediterranean [3], and Baikal-GVD, located in Lake Baikal [4]. To better explore astrophysical neutrinos in the future, it is necessary for astrophysical neutrino telescopes to be large enough to improve the significance of the signal from hotspot regions identified by multi-messenger observations or to make breakthrough discoveries using neutrino-only observations. IceCube has released an upgrade plan named IceCube-Gen2 project [5] that will include a 7.9 km3 optical array for astrophysical neutrino detection. Simultaneously, neutrino telescopes such as P-ONE [6] in the eastern Pacific, and TRIDENT [7] and NEON [8] in the South China Sea, are proposed as next-generation neutrino telescopes. Additionally, the High-energy Underwater Neutrino Telescope (HUNT) project has been proposed by the LHAASO collaboration [9], with an instrumented volume of water of 30 km3 [10]. With the development of computer power, it is possible to build a full GEANT4 [11] simulation toolkit to explore the performance and optimize the design for HUNT. This simulation toolkit makes use of the Cosmic Ray Monte Carlo package (CRMC), a software developed by Karlsruhe Institute of Technology, to provide an extended model for hadrons with energy higher than 100 TeV [12].
Baikal-GVD has been under construction since 2016 [13]. The telescope is divided into multiple clusters, each consisting of eight strings anchored on the lakebed with a horizontal distance of 60 m. Seven strings surround a center one, and each string is equipped with 36 optical modules (OMs) spaced at 15 m intervals vertically. By 2023, the Baikal-GVD collaboration had completed the construction of 11 clusters and part of the 12th cluster, and had established an experimental cluster to test new equipment [14]. The telescope has successfully detected Cherenkov light from leptons and hadrons generated by neutrinos interacting with water nuclei in the energy range from hundreds of GeV to PeV. Baikal-GVD has already published the results of diffuse neutrino flux measurements [15], including 16 high-energy and 11 under-horizon cascade events and their reconstructed parameters. Given that Lake Baikal is one of the candidate sites for HUNT, the simulation toolkit needs to be tested using high-energy neutrino event data collected by a detector in operation. Baikal-GVD provided the data of 15 high-energy cascade events; however, owing to the computational cost of GEANT4, two events with energy higher than 300 TeV were excluded. Consequently, only 13 high-energy events, listed in Table 1, were selected for the study. The data collected from each neutrino event includes channel-by-channel signals and reconstruction results from Baikal-GVD. These signals were obtained from detections of neutrino interaction and background noise within the event time window. Additionally, each channel-by-channel signal, referred to as a hit in this study, includes an integrated charge corresponding to the expected number of photo-electrons (NPE) detected in that signal, a timestamp derived from half of the waveform's rising edge including the ID number of the related OM. In addition, the real-time calibrated positions of all OMs were recorded. The reconstruction results provide the estimated energy, incident position in cluster-local coordinates, and direction of the cascades.
Event ID Energy/TeV Phi/(°) Theta/(°) x/m y/m z/m GVD181010CA 105 331 37 70 −8 −164 GVD181024CA 115 112 73 −48 76 4 GVD190523CA 91 93 109 −227 40 15 GVD190604CA 129 321 50 34 −39 232 GVD200117CA 83 276 50 26 −67 −242 GVD200826CA 110 185 71 −77 33 211 GVD201222CA 74 9 92 −4 18 −253 GVD210117CA 246 49 57 75 28 −249 GVD210409CA 263 284 60 76 3 −234 GVD210515CA 120 31 80 −19 65 21 GVD210716CA 110 15 59 90 −23 −19 GVD210906CA 138 151 68 −74 65 −155 GVD220221CA 120 267 68 62 −3 9 Table 1. Thirteen Baikal-GVD high-energy cascade events involved in this study. The theta and phi angles correspond to the zenith and azimuth angles, respectively, from which the cascade is expected to originate in the local coordinate system. Additionally, the x, y, and z values indicate the reconstructed shower position within the local coordinate system of the observing cluster.
According to the reconstruction conducted by the Baikal-GVD collaboration, these events are of cascade type induced by the charged particles produced in the collision of the incident neutrinos with nuclei in water. Depending on the flavor of the incident neutrino, which is unknown, the cascade could be initiated by multiple hadrons or dominated by an electron generated in the
$ \nu_e $ 's charge current interaction. In our simulations, we used the reconstructed parameters as input, and a single particle was assumed to be the initial particle. The Cherenkov photons were traced until they hit an OM. Both the arrival time since the shower was initiated and NPE were generated for comparison OM by OM with those recorded in real observed events in GVD. In Section II, we present the details of our simulations, including the software, detector geometry, water properties, and incident particles. Section III comprehensively analyzes the results obtained. Finally, in Section IV, we explore potential approaches to enhance the accuracy and robustness of the simulation toolkit. -
The simulation toolkit includes a program that simulates the propagation of secondary particles and response of OMs. It focuses on the propagation of secondary particles from the neutrino interaction for each event, including Cherenkov photons. The simulation begins when the secondary particle from the neutrino interaction emerges in the telescope and ends when all Cherenkov photons are fully simulated. The NPE recorded by each OM is then stored and timed at the over-threshold time. It is important to note that the time of recorded photo-electrons is adjusted by a Gaussian distribution with a sigma of 2.5 ns to represent the transit time spread (TTS) of the photomultiplier tube (PMT). Noise was not considered in this study.
GEANT4 is utilized to track all particles that enter the instrumented volume of the telescope until they either deposit all their energy or escape from the telescope. The CRMC package provides an external hadronic physics library for the GEANT4 physics process.
-
Within the GEANT4-based simulation toolkit, the Baikal-GVD OM, illustrated in Fig. 1, consists of a 17-inch glass sphere, a part of the 10-inch sphere representing the 10-inch PMT’s photocathode, a black disc to block the light that hits the PMT non-sensitive region, and the remaining area filled with optical gel. The program sets the OMs to their real-time positions calibrated by the acoustic positioning system and simulates the geometric optical effects along with the Cherenkov light propagation, recording photons that hit the PMT’s sensitive area. Photo-electrons are sampled according to the distribution of quantum efficiency of R7081-100, which is provided by Hamamatsu equipment [16], and recorded. During the signal processing, we just count the number of photo-electrons; then, a long enough time window of 5,000 ns is used to guarantee that all physically relevant signals in Monte Carlo (MC) are collected.
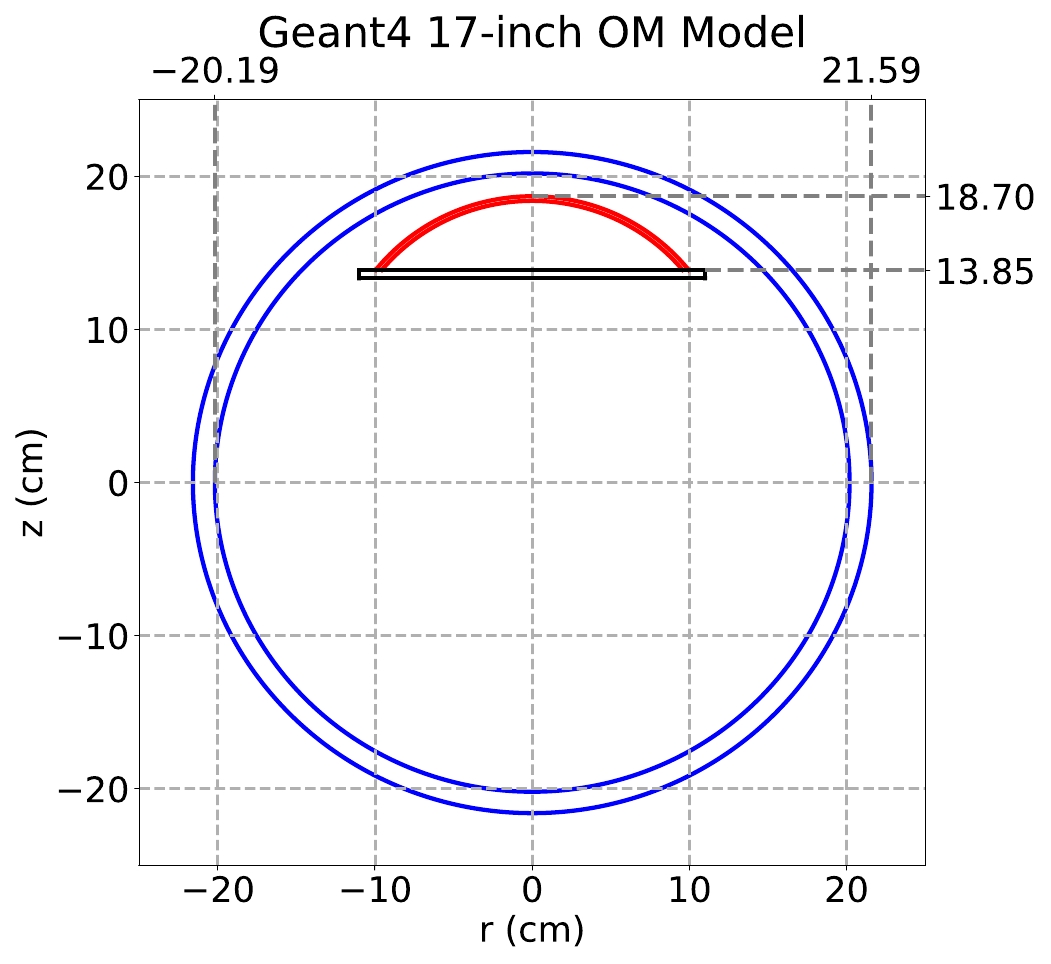
Figure 1. (color online) Schematic of an OM in GEANT4. The blue double-circle represents the 17-inch glass sphere. The red arc represents the sensitive area of the 10-inch PMT. The black disc serves as light barrier.
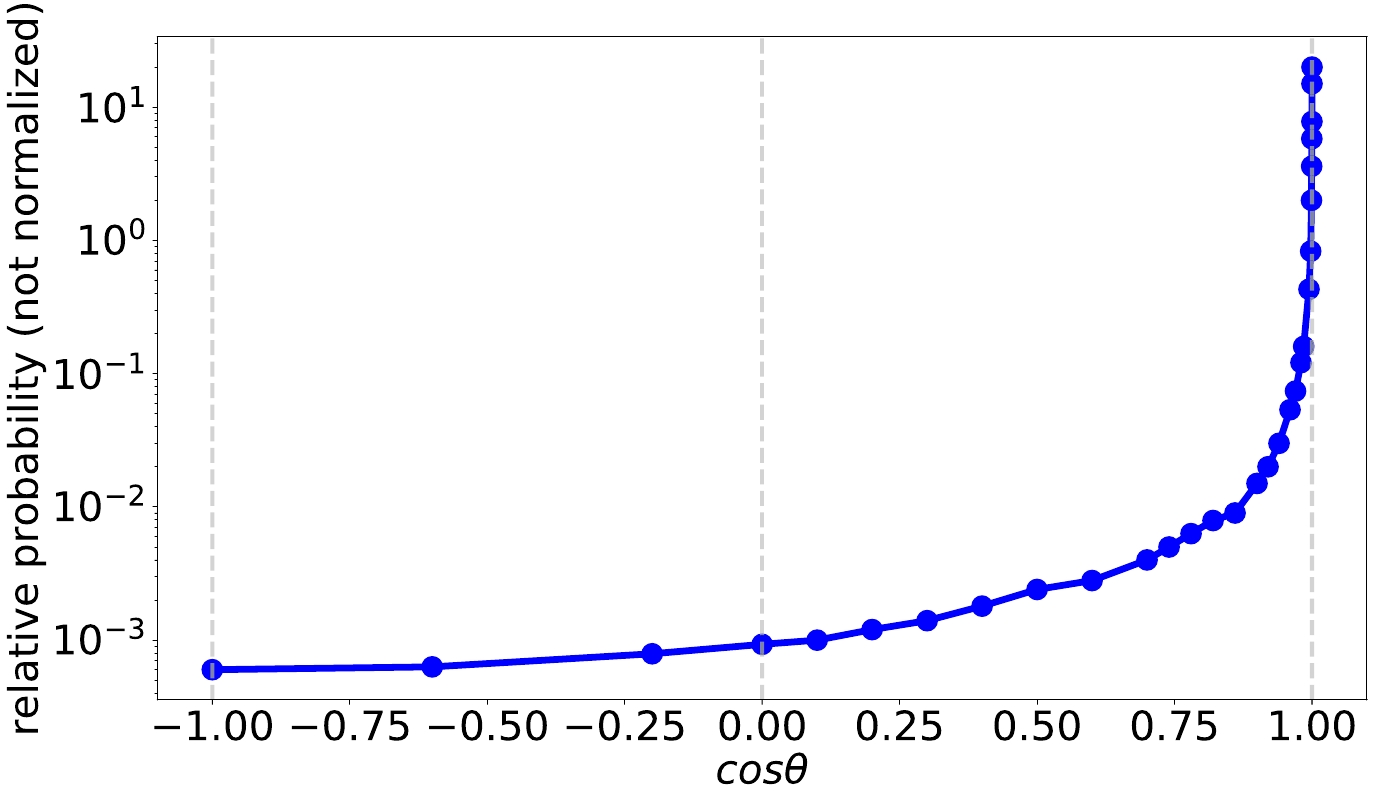
The optical properties of water in Lake Baikal were derived from the measurement results reported by the Baikal-GVD group [17, 18]. Seasonal variations in water properties are induced by the water flow. However, this study utilizes the averaged values of absorption and scattering lengths obtained from long-term measurements. Scattering parameters were set according to the Baikal-GVD's measurements shown in Fig. 2, which illustrates the probability of photon scattering into a given direction.
-
The high-energy cascade events detected by the Baikal-GVD involve different processes. These include the charged current (CC) interactions of (anti-) electron neutrinos resulting in an electromagnetic dominant cascade, CC interactions of (anti-) muon and (anti-) tau neutrinos leading to a track lepton and a hadronic cascade at the vertex, the hadronic decays of tau, and all neutral current (NC) interactions giving rise to a hadronic cascade. In the simulations performed in this study, the CC interaction case of (anti-) electron neutrino was treated as a pure electron-induced cascade. In contrast, other cases were proton-induced hadronic cascades. We used an electron or proton to represent electromagnetic-dominant or pure hadronic cascade for simplicity, given that it does not affect the purpose of this study. The diversity of hadrons can cause uncertainties of several tens of centimeters in the maximum shower distance and of ten to twenty percent in the number of photons emitted by a hadronic cascade. The distance uncertainty is close to the position searching step when adjusting the vertex as described in Section III. This stride is worse than the precision of position resolution in this study; consequently, it can be disregarded. The second uncertainty affects the number of photons emitted in a shower and is similar to the uncertainty of the cascade energy. Additionally, the reconstructed energy listed in Table 1 is indeed the total energy of a shower, rather than that of the neutrino. Therefore, in the simulations, we just assigned the energy value to the incident particle (electron or proton).
-
The charged secondaries from a cascade in water can scatter in a backward direction, resulting in a significant generation of Cherenkov photons with opposite direction with respect to that of the neutrino. These photons are approximately three orders of magnitude smaller than those emitted in the forward direction. The point-like light source assumption, which suggests that the shower could be considered as a single point source with an anisotropic intensity of Cherenkov light, was employed in the shower position reconstruction process [19] when using time-of-flight detection information. This can lead to a systematic offset from the reconstructed shower position to the real neutrino interaction vertex in the momentum direction. The rotational symmetry eliminates this offset at the transverse plane, leaving only uncertainty arising from light yield fluctuations and propagation effects. Generally, the position of the reconstructed shower vertex depends on the shower's spatial location and orientation relative to the detectors. This implies that the reconstructed shower vertex is naturally expected to be located in the vicinity of the shower maximum. For an electromagnetic shower in water, the distance between the shower vertex and shower maximum can be estimated as follows [20, 21]:
$ \begin{aligned}[b]& x_{\text{max}}(E) = \lambda \cdot \left[\ln \left(\frac{E}{E_c}\right)-0.5\right] \text{m},\ E_c=75.5 \; \text{MeV,}\\ & \lambda\approx0.36 \;\text{m}, \end{aligned} $

(1) where E is the energy of the primary particle,
$ E_c $ is the critical energy of that particle, and λ denotes the interaction length of the primary particle in water. For a hadronic shower from protons:$ \begin{align} x_{\text{max}}(E) = \lambda \cdot \ln \left(\frac{E}{E_c}\right)\ \text{m},\ E_c=170\ \text{MeV,}\ \lambda\approx0.39\ \text{m}. \end{align} $

(2) The sparse distribution of detector units across a large volume of water results in the Cherenkov light having a longer path than one absorption length. As a result, most photons, including those emitted along the Cherenkov angle, will not reach the detectors. This inherent effect leads to statistical fluctuations when reconstructing the direction and energy of cascade-like events.
To achieve precise simulation results, it is necessary to test different incident vertex parameters with six dimensions, including position, direction, and energy, to approach the real vertex. The vertex position determines the light path from the cascade to the detector and mainly influences the expected arrival time of photons. The direction will move the generating position of photons around the vertex and shift the brightest direction relative to the shower axis, which may change the number of photons arriving at an OM. The energy uncertainty will only result in a global increment or decrement to a total NPE ratio between the MC annd GVD data. The uncertainty of energy reconstruction precision could be conducted if all other settings are correct. Thus, the energy offset was not considered in this study.
-
If the simulation toolkit is assumed to simulate the physical world accurately, it is reasonable to expect that multiple simulations will yield fluctuations around the expected detection value for a given set of incident particle parameters. Therefore, we performed 20 simulations for each try of cascade vertex and compared the average values obtained with the detection results from Baikal-GVD.
A chi-square fit was performed to compare the time residual values for each event, calculated as the difference between the expected (MC average) and observed (GVD data) hit arrival times in each channel. The width of the time residual distribution depends on many factors, such as the intrinsic fluctuations in the particle cascade development, light propagation effects, precision of hit arrival measurements by the detector electronics, and accuracy of detector calibration. Typically, the sigma is approximately 5 ns for Baikal-GVD. It is evident that there is an extra variation for low photo-electron hits owing to the survival probability caused by the quantum effect of the PMT and photon propagation in the water. To deal with this, an NPE weight was introduced. The temporal chi-square is expressed as follows:
$ \chi^2_{\Delta{t}}=\sum_{i}{w_i}\frac{(t_{i,mc}-t_{i,gvd})^2}{{\sigma_{i,mc}}^2+{\sigma_{i,gvd}}^2}, $

(3) $ w_i=\frac{Q_i}{\sum_j{Q_j}}. $

(4) Here, i and j indicate the indexes of an OM with non-zero signal,
$ t_{i,mc} $ represents the arrival time of the first detected photon in each hit,$ t_{i,gvd} $ denotes the time of the half-height of the amplitude of the waveform in each hit, as measured by Baikal-GVD,$ \sigma_{i,mc} $ denotes the expected error of the fluctuation of$ t_{i,mc} $ ,$ \sigma_{i,gvd} $ is approximately 5 ns, and$ Q_i $ is the NPE of each hit. Furthermore, the time of the first trigger hit was set to zero, making all times in the chi-square relative to the first trigger. Consequently, all systematic time errors during the detection process, such as the mean transit time of the PMT, were eliminated here.The distribution of NPE in hits, along with the light anisotropy in a shower, play a crucial role in direction reconstruction. To estimate the impact of NPE information, an NPE chi-square function is formulated as follows:
$ \begin{align} \chi^2_{\Delta{Q}}=\sum_{i}\frac{(Q_{i,mc}-Q_{i,gvd})^2}{{\sigma_{i,mc}}^2+{\sigma_{i,gvd}}^2} . \end{align} $

(5) Here, i indicates the index of an OM with non-zero signal,
$ Q_{i,mc} $ represents the NPE in each channel of the simulation,$ Q_{i,gvd} $ denotes the NPE of GVD data, and σ denotes the statistical error for the MC calculated from 20 repetitions with different random seeds and the same given incident conditions. Poisson error was assumed for the GVD data and calculated as$\sigma_{i,gvd}= \sqrt{Q_{i,gvd}}$ . During this process, only those channels with non-zero Q in at least one of the MC and GVD signals were taken into account.The time and NPE chi-square functions can evaluate the overall goodness of fit as well as the tendency to overestimate or underestimate signals. Ideally, the detected NPE should be within the range of fluctuations. In other words, all data points should be distributed in a linear proportional relationship. Therefore, the fit was performed in a logarithmic space to mitigate the influence of large hits; the fit function employed is expressed as follows:
$ \begin{align} \log_{10}y=a\cdot (\log_{10}x-1)+b . \end{align} $

(6) Here, x represents the NPE of hits in Baikal-GVD and y denotes the simulated NPE. By setting the zero point at x=10, the parameter b represents the expected NPE offset in a MC channel for a given set of incident parameters, assuming that an NPE value of 10 is obtained from this channel in Baikal-GVD. If those cascades detected by Baikal-GVD were perfectly generated, both 'a' and 'b' should be equal to 1.
-
Here, we illustrate the vertex correction with the example of GVD210515CA, as referenced in Section III.A. In this instance, the incident particle is assumed to be an electron, representing a classical interaction channel of cascade-like neutrino events.
Figure 3 shows simulation results of GVD210515CA. The simulation program with Baikal-GVD geometry yielded a footprint of hit time and NPE very close to the real data. Despite the occurrence of missing hits in either the MC simulation or the detection process, it can be reliably concluded that this simulation toolkit is capable of generating the signal morphology including similar timestamps and NPE counting. These factors are crucial for identifying physical events in the data and reconstructing the direction of neutrinos.
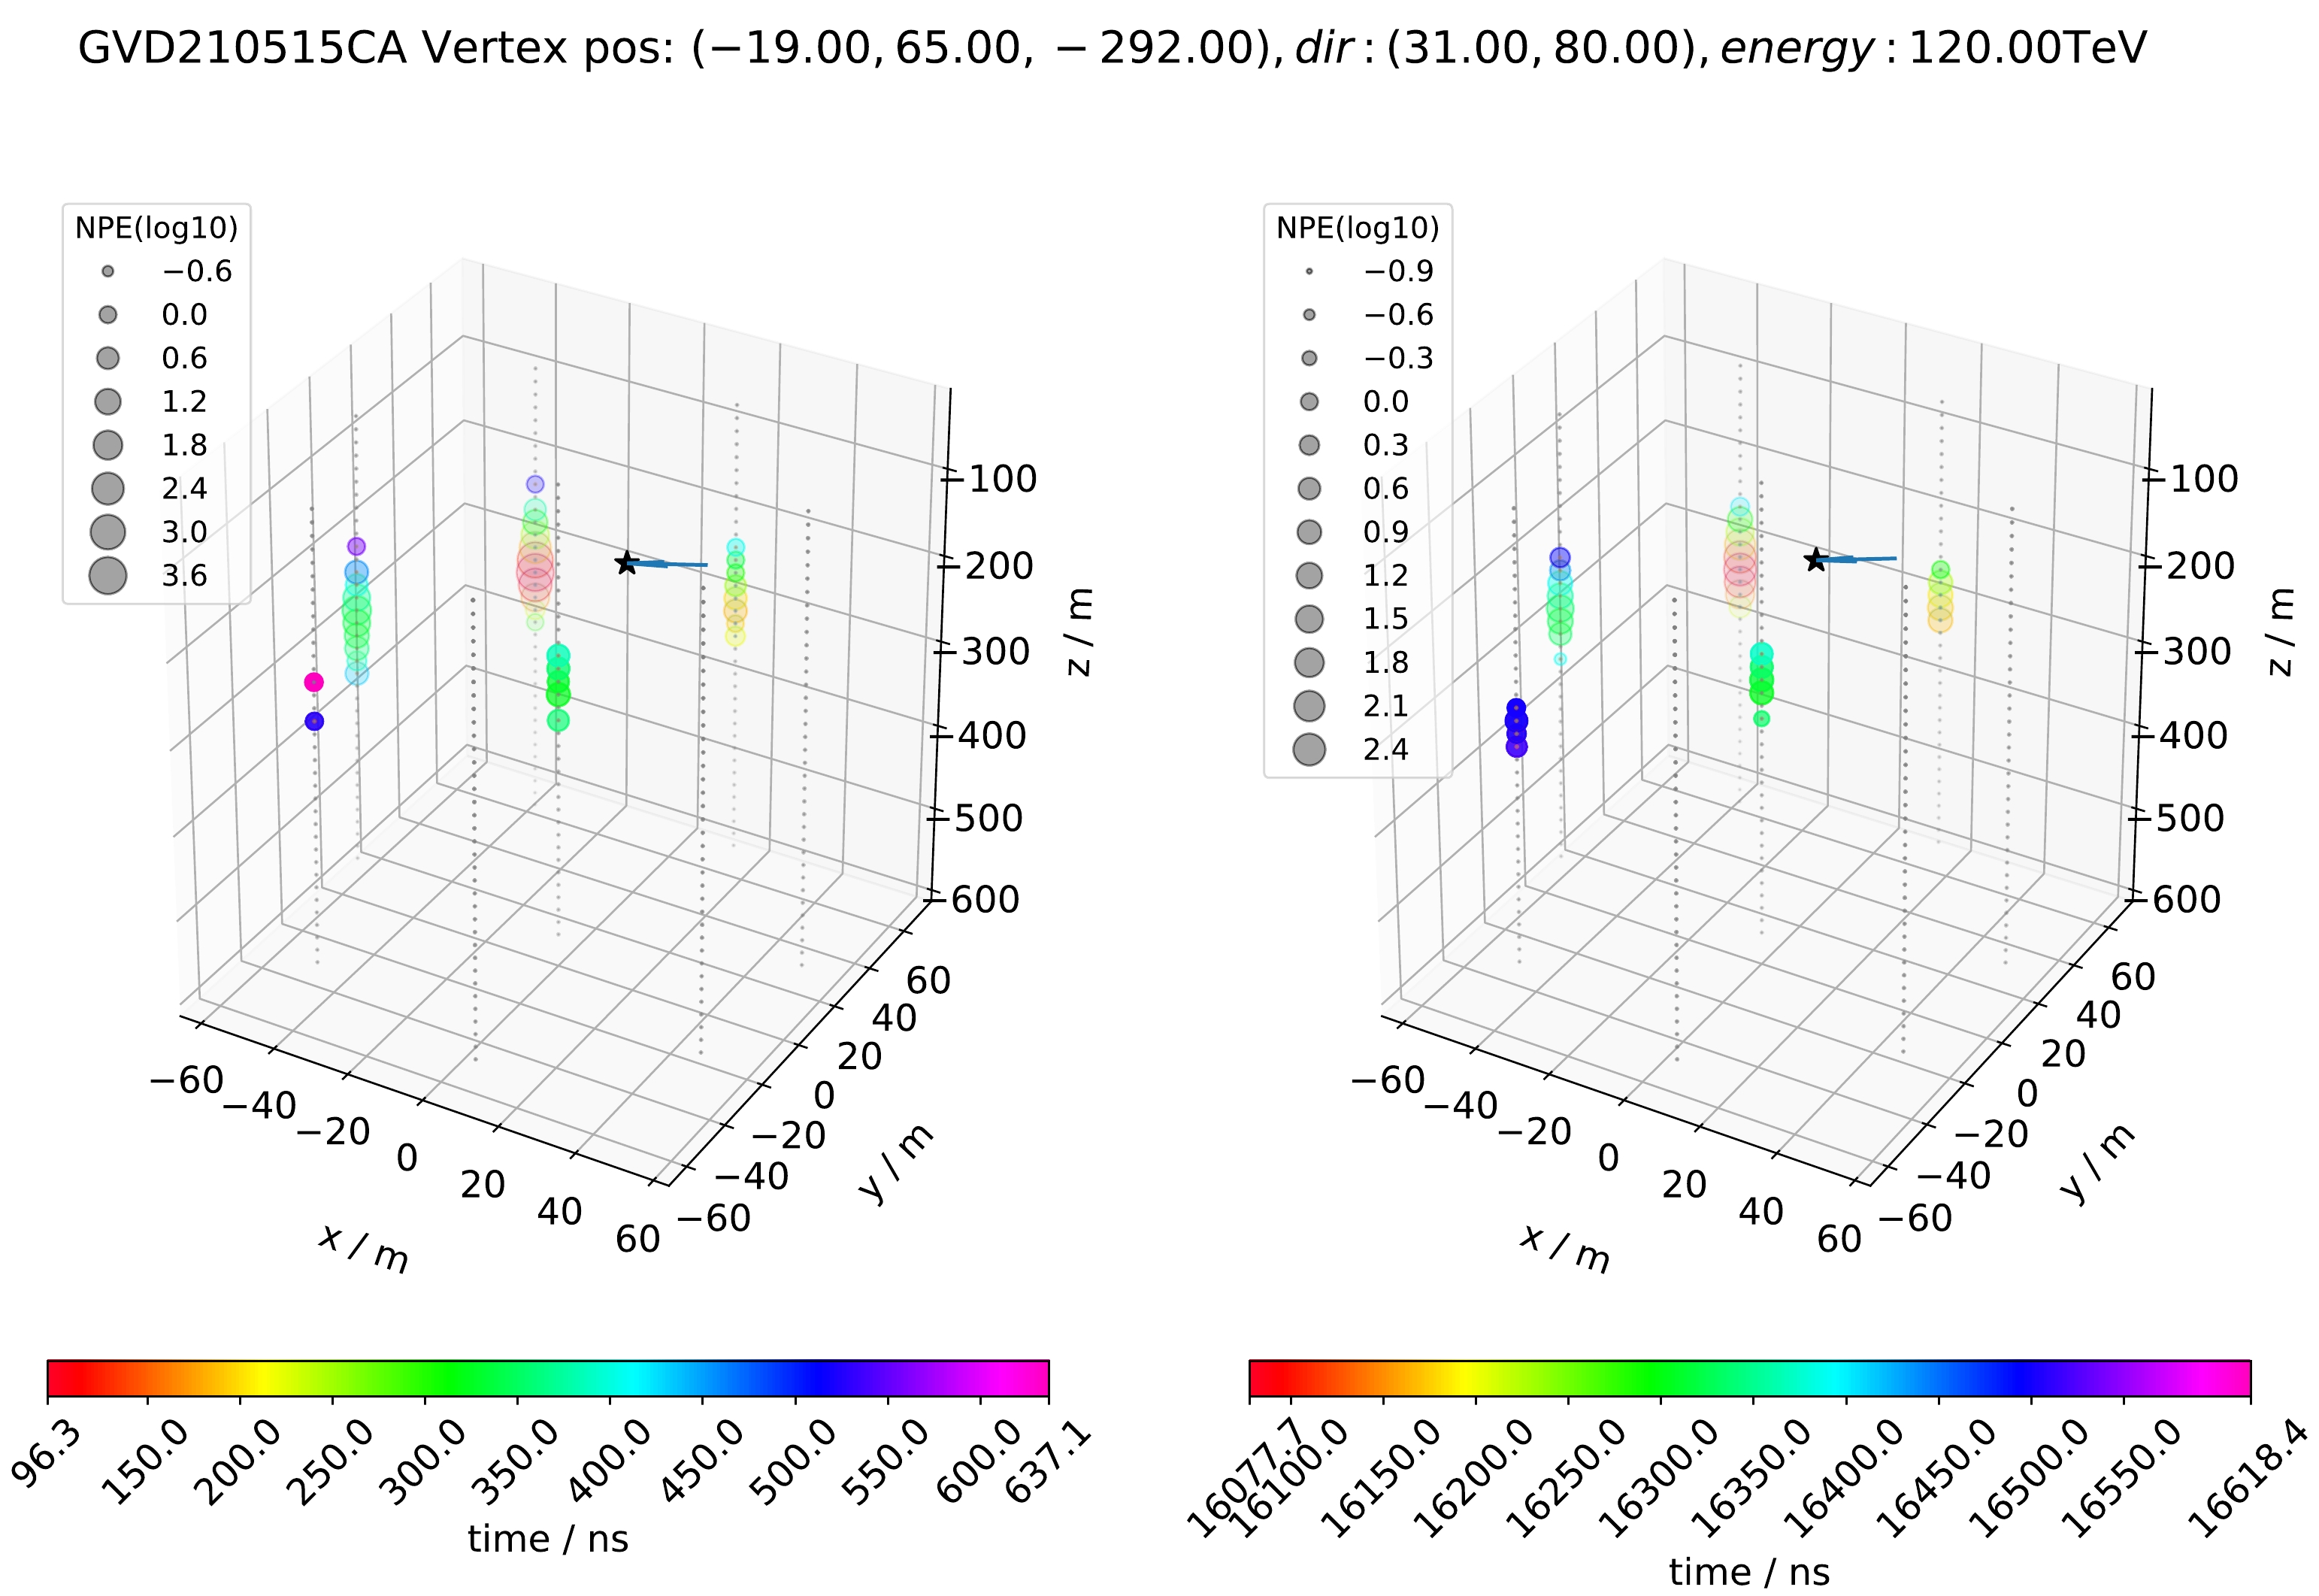
Figure 3. (color online) Comparison between the view of GVD210515CA and the simulated results. The left panel displays the simulation results, while the right panel represents real Baikal-GVD events. The size of each dot corresponds to the logarithm of NPE. The color of the dots represents the time. The time windows have been standardized in length, and the initial point of each dot corresponds to the time of the first triggered OM in the hits data.
For further understanding of neutrino detection, it is important to adjust the parameters of incident particles around the reconstructed values. A study conducted at Baikal-GVD demonstrated that the directional uncertainty can reach several degrees for cascade events at an energy level of 100 TeV [4]. Simulation results show that the NPE chi-squares exhibit a wide valley within a range of 10 degrees, which is consistent with the Baikal-GVD directional resolution.
Conversely, when adjusting the incident position along the direction in the plane perpendicular to the shower axis, experimental results indicate that it is feasible to precisely determine the transverse position of the shower with an accuracy of approximately 1 m. However, there is a noticeable increasing trend when the offset distance exceeds 1 m. This is reasonable considering the characteristic size of approximately 1−2 m for the transverse development of an electromagnetic cascade in water. For example, in simulation, light of 470 nm takes approximately 4.61 ns to traverse a distance of 1 m in water. If the light originates from a point located more than 1 meter away from the reconstructed point, a systematic error of more than 4.61 ns is expected, which can be readily identified by the facility and algorithm.
Figure 4 illustrates the behaviour of the time and NPE chi-squares as a function of the longitudinal offset; the vertex moves along the shower axis from
$ -20$ m to +20 m. It is evident that the best fit in the time chi-square plots occurs at 4.5 m, which is very close to the expected position of the shower maximum at 4.9 m. In the physical progression of cascade development, the vertex of the primary particle was initially invisible owing to insufficient amount of Cherenkov light, and then became bright enough for detection at a later stage. When reconstructing the point light source and assigning equal weights to each channel, the shower maximum contributes the most to the photons detected by OMs, consequently dominating the reconstruction result. Therefore, a systematic deviation between the vertex and reconstructed shower source significantly affects the hit time. However, for NPE, a two-meter deviation resulted in only a 10% variation, approximately, which is within the range of measurement error and therefore cannot be distinguished.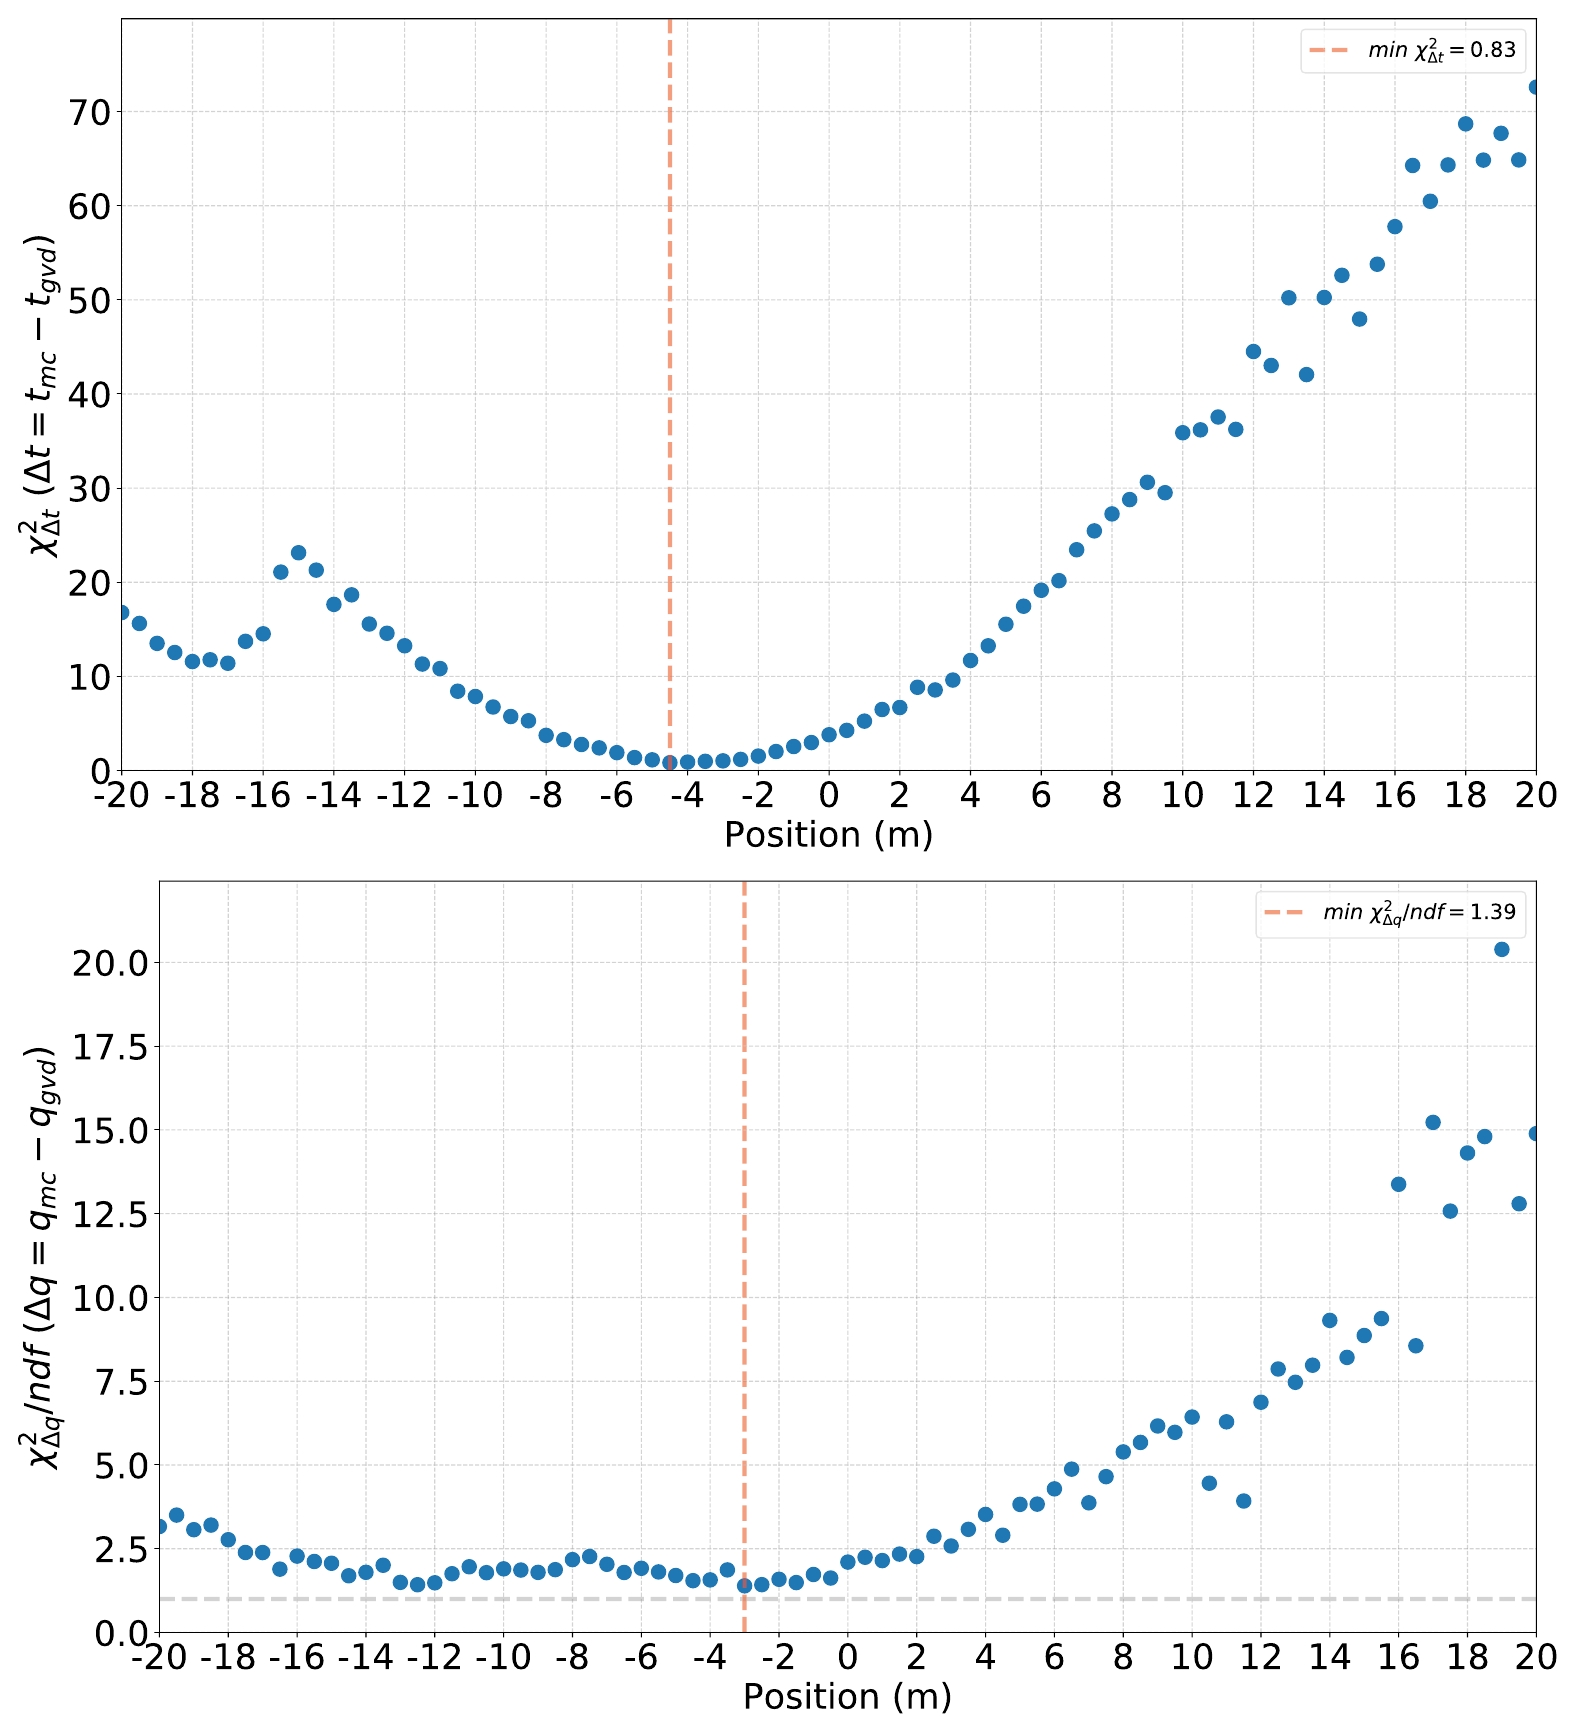
Figure 4. (color online) Dependence of the time chi-square (top) and NPE chi-square divided by the number of degrees of freedom (bottom) as functions of the longitudinal offset in the case of GVD210515CA.
Based on the results obtained for GVD210515CA, a fundamental conclusion can be derived. The primary discrepancy between the reconstructed and true vertex predominantly arises from the longitudinal extent of the shower. When appropriately adjusting for the shower extent, the uncertainty in the direction deviation of the cascade and transverse positional deviation would be ignored in the simulations of other events.
-
Following the findings presented in Section III.C, we performed a scan of the longitudinal offsets for all the events listed in Table 1. During this process, both the electromagnetic and hadronic cascade hypotheses were tested, as shown in Fig. 5. Then, a linear fit to these data was applied; the results are displayed in Tables 2 and 3. The average deviation from the best fit to the theoretic shower maximum in the electron case is
$ -0.54\ \text{m} $ , with a standard error of$ 1.29\ \text{m} $ . The average deviation in the proton case is$ -0.33\ \text{m} $ , with a standard error of$ 2.47\ \text{m} $ . The parameter$ a $ of linear fit, which is smaller than 1 for most events, could indicate the presence of an effect currently unaccounted for in the MC. This effect may suppress the signals from channels far from the vertex in real data, or make the large hits in real data appear even larger than MC expectation. However, the latter should be excluded because no non-linearity and saturation in detector-level simulations only make a larger hit in real data, rather than the opposite. The parameter b , which is larger than 1, means that the detector model employed for simulation might have a higher detection efficiency. After deducting the uncertainty of 30% from the energy reconstruction, the values of b indicate that the detector efficiency could be underestimated in the MC by 17%−25%.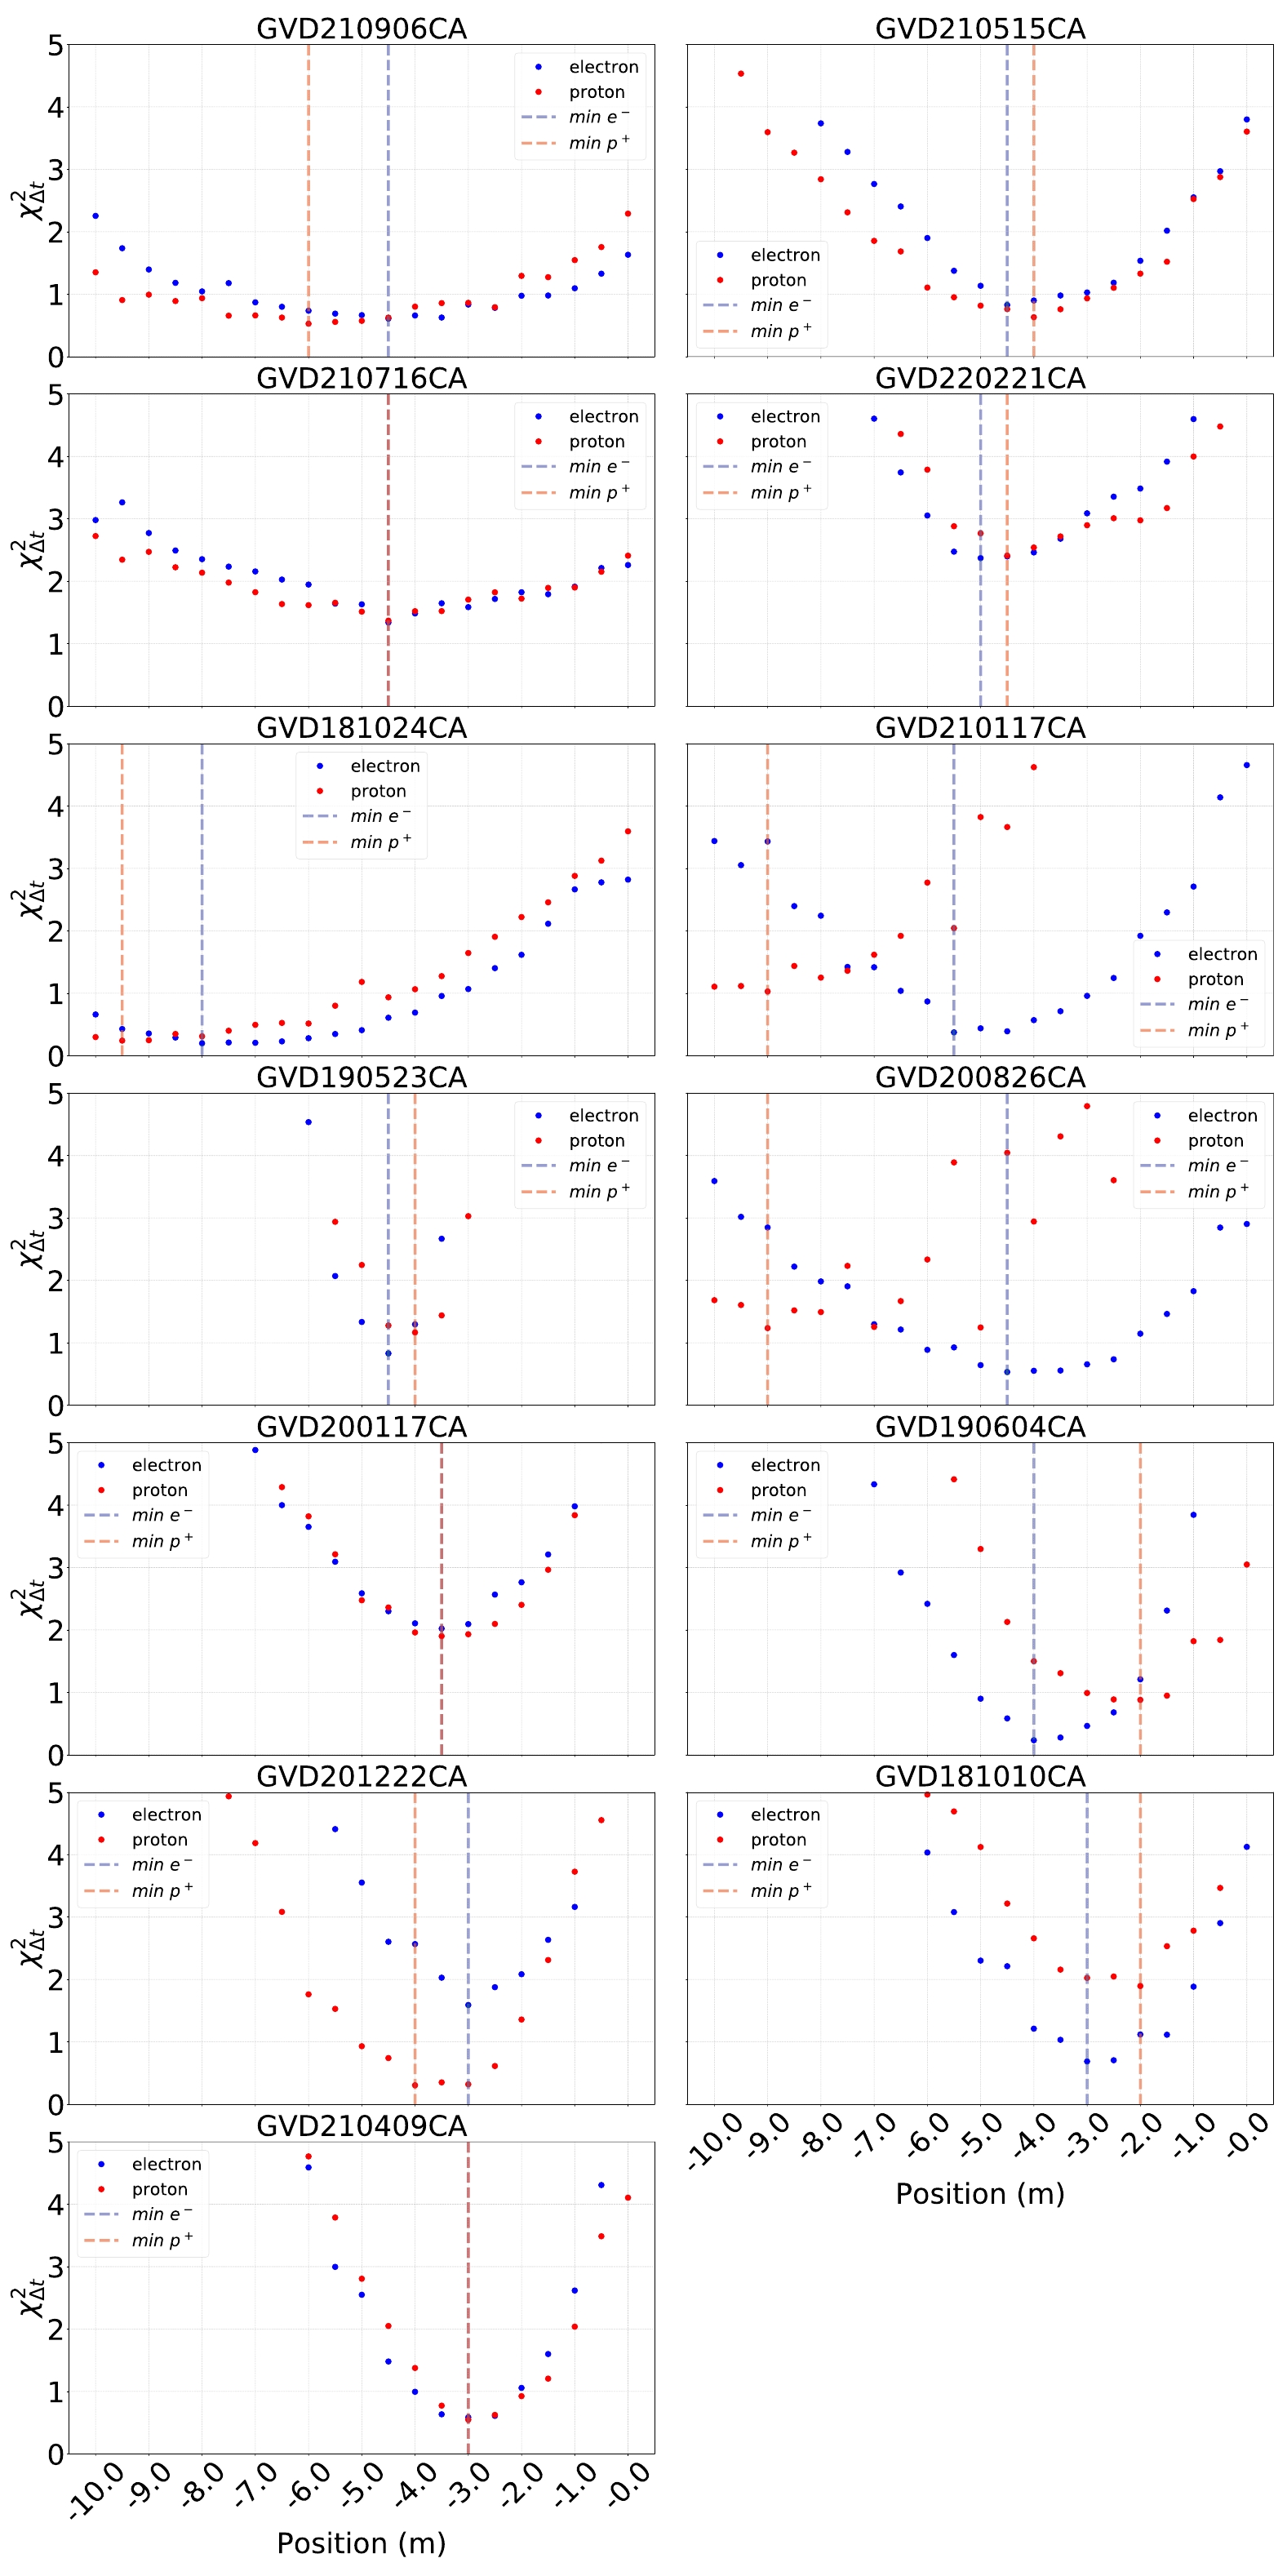
Figure 5. (color online) Dependence of the time chi-square as a function of the longitudinal offset (ranging from 0 to –10 m) for 13 Baikal-GVD events. The red and blue dots represent the values obtained for the hadronic (proton-induced) and electromagnetic (electron-induced) shower hypotheses, respectively, while the dashed lines indicate the respective chi-square minima.
eventID Best fit/m xmax/m a b GVD210906CA 4.50 5.01 1.03 1.18 GVD210515CA 4.50 4.96 1.10 1.03 GVD210716CA 4.50 4.93 0.90 1.14 GVD220221CA 5.00 4.96 1.13 1.03 GVD181024CA 8.00 4.95 1.14 1.06 GVD210117CA 5.50 5.22 0.91 1.13 GVD190523CA 4.50 4.86 0.90 1.05 GVD200826CA 4.50 4.93 0.96 1.18 GVD200117CA 3.50 4.83 0.82 1.08 GVD201222CA 4.00 4.79 0.72 1.25 GVD181010CA 3.00 4.91 0.93 1.06 GVD190604CA 3.00 4.99 0.91 1.04 GVD210409CA 3.00 5.24 0.96 1.09 Table 2. Results of electron-induced cascades. Best fit denotes the optimal longitudinal offset, along with the parameters of the linear fit, where a and b represent the linear fit parameter values in Eq. (6) at the best offset, and xmax refers to the theoretical position of the shower maximum for the specific particle and energy.
eventID Best fit/m $ x_{\max} $ /m

a b GVD210906CA 6.00 5.38 0.96 1.14 GVD210515CA 4.00 5.33 1.08 1.00 GVD210716CA 4.50 5.29 0.91 1.13 GVD220221CA 4.50 5.33 1.09 1.03 GVD181024CA 9.50 5.31 1.05 1.04 GVD210117CA 9.00 5.61 0.85 1.11 GVD190523CA 4.00 5.14 0.87 1.05 GVD200826CA 9.00 5.29 0.92 1.06 GVD200117CA 3.50 5.18 0.84 1.05 GVD201222CA 4.00 5.14 0.77 1.20 GVD181010CA 2.00 5.27 1.00 1.07 GVD190604CA 2.00 5.36 0.89 1.05 GVD210409CA 3.00 5.64 0.98 1.09 Table 3. Results of proton-induced cascades. Best fit denotes the optimal longitudinal offset, along with the parameters of the linear fit, where a and b represent the linear fit parameter values in Eq. (6) at the best offset;
$x_{\max}$ refers to the theoretical position of the shower maximum for the specific particle and energy.Once the longitudinal shower range is taken into account, the simulation toolkit with the Baikal detector geometry and water properties is able to generate the detection outcomes of high-energy cascade events in Baikal-GVD.
For further optimization in the future, it should be noticed that two aspects not mentioned in this study can be explored. First, the fluctuation in seasonal water properties, out of consideration to date, will have to be considered in the future. The variance of absorption length over a year is approximately 10%, potentially resulting in an absorption ratio exceeding 30% at most at a 60 m level, which is the characteristic scale of inter-string distance. Second, accurately modeling the non-linearity and saturation effects for large hits could provide essential weighting for the NPE estimators.
-
Our study involved the development of a simulation toolkit for high-energy neutrino detection based on the GEANT4 program. The toolkit has been validated through generation of individual events in a sample of high-energy cascade events above 100 TeV detected by the Baikal-GVD experiment. We found that the match between the simulated and recorded data is reasonably good, and the goodness of fitting is insensitive to the neutrino incident direction and location of the shower initial point in the plane perpendicular to the incident direction. However, it is sensitive to the longitudinal location along the incident direction. Therefore, we searched for the longitudinal position by maximizing the goodness of the matching between OM signals in terms of both timing and number of photoelectrons. A systematic offset in the longitudinal location, ranging from
$ (x_{\text{max}}(E)-0.54)\pm 1.29\ \text{m} $ for showers initiated by electrons, was found to be well related to the distance between the initial point and shower maximum of the cascade. As we were uncertain about the flavor of incident neutrinos, we also explored the use of protons as initial particles for cascade events (as shown in red dashed lines in Fig. 5). It seems that rather large offsets in longitudinal position were favored for some events. Based on these results, it is difficult to determine whether an electromagnetic-dominant or pure hadronic shower is favorable for a given event. In future studies, if we could reduce uncertainties from the environment to a level below fluctuations arising from the diversity of hadrons generated in neutrino interactions, we may be able to further explore individual types of cascade-like neutrino events.Generally, the toolkit was validated for further use in simulating similar underwater neutrino detections. In March 2024, a prototype string of optical modules equipped with 20-inch PMTs within one of Baikal-GVD clusters was deployed. Data of high-energy neutrino events collected in the new experiment with the mixed detector modules will be used to further tune the simulation program, which will serve as a reliable input for the development of a simulation toolkit for the HUNT project. The toolkit will be used to estimate the performance and optimize the design of the HUNT experiment.
-
The authors gratefully acknowledge the hardware and software technical support provided by the LHAASO group, as well as the computational support from the Institute of High Energy Physics, Chinese Academy of Sciences. Additionally, we extend our appreciation for the data shared by the Baikal-GVD group and the Institute for Nuclear Research of the Russian Academy of Sciences.
Generating Baikal-GVD high energy cascade-like neutrino events with a GEANT4-based simulation toolkit
- Received Date: 2024-03-01
- Available Online: 2024-10-15
Abstract: Using the GEANT4 and Cosmic Ray Monte Carlo (CRMC) software packages, we developed a new simulation toolkit for astrophysical neutrino telescopes. By configuring the Baikal-GVD detector and comparing the vertex position and direction of incident particles, as well as the channel-by-channel signals, to the events detected by Baikal-GVD, we successfully generated 13 high-energy cascade neutrino events with the toolkit. Our analysis revealed a systematic offset between the reconstructed shower position and the true interaction position, with a distance close to the scale of the shower maximum of −0.54±1.29 m. We achieved a good linear relationship between the photoelectron number of neutrino events obtained by simulation and the real data measured by Baikal-GVD. The simulation toolkit could serve as a reliable basis for studying the performance of astrophysical neutrino telescopes.


 Abstract
 HTML
HTML Reference
 Related
 PDF
PDF




 DownLoad: