-
In nuclear reactions, the cross section data for residual nuclei states are vital [1−3]. Important parameters and test models for nuclear reactions can be derived from the data collected in previous studies [4, 5]. The large cross sections of the (n, 2n) reactions of different elements facilitate experimental measurements in the 14-MeV neutron energy region [6−9]. In addition, the spin cut-off factor can be determined using the (n, 2n) isomeric cross section ratio (a crucial approach) [10, 11]. However, measuring cross sections for the remaining nucleus states is challenging for a finite number of (n, 2n) reactions. For example, in the nuclear reaction 128Te(n, 2n), the daughter nucleus decays, as shown in Fig. 1. The half-life (T1/2=106.1 d) of the excited state (11/2−) is much longer than that of the ground state (3/2+, T1/2=9.35 h), and it has no proper γ-ray with sufficient intensity. The characteristic rays have low energies and very weak intensities. Determining the efficiency of high-purity germanium (HPGe) detectors is challenging in regions of lower energy (Eγ<80 keV), as the absolute intensity is too small to count or measure. The results of the cross-sectional measurements of the 128Te(n, 2n)127mTe reaction are inconsistent and scarce because of the abovementioned reasons. Only four labs [12−15] have produced measurements from 630 to 949 mb, with a 50% difference. The ground states of the residual nucleus have characteristic rays at 417 and 360.3 keV, and using these values, researchers [12, 15] have determined the cross sections of the excited state (see Table 1). Other researchers have utilized both lines to determine the cross sections of the ground state [12, 13, 16−19]. Still other researchers [14, 20] have used beta counting or have discovered minimal information [21−23]. Various circumstances cause the cross sections of the nuclear reaction 128Te(n, 2n)127gTe to vary more than four times from 230 to 840 mb. The differences are mostly caused by three factors in the extensively researched 14-MeV neutron energy region, which are described as follows:
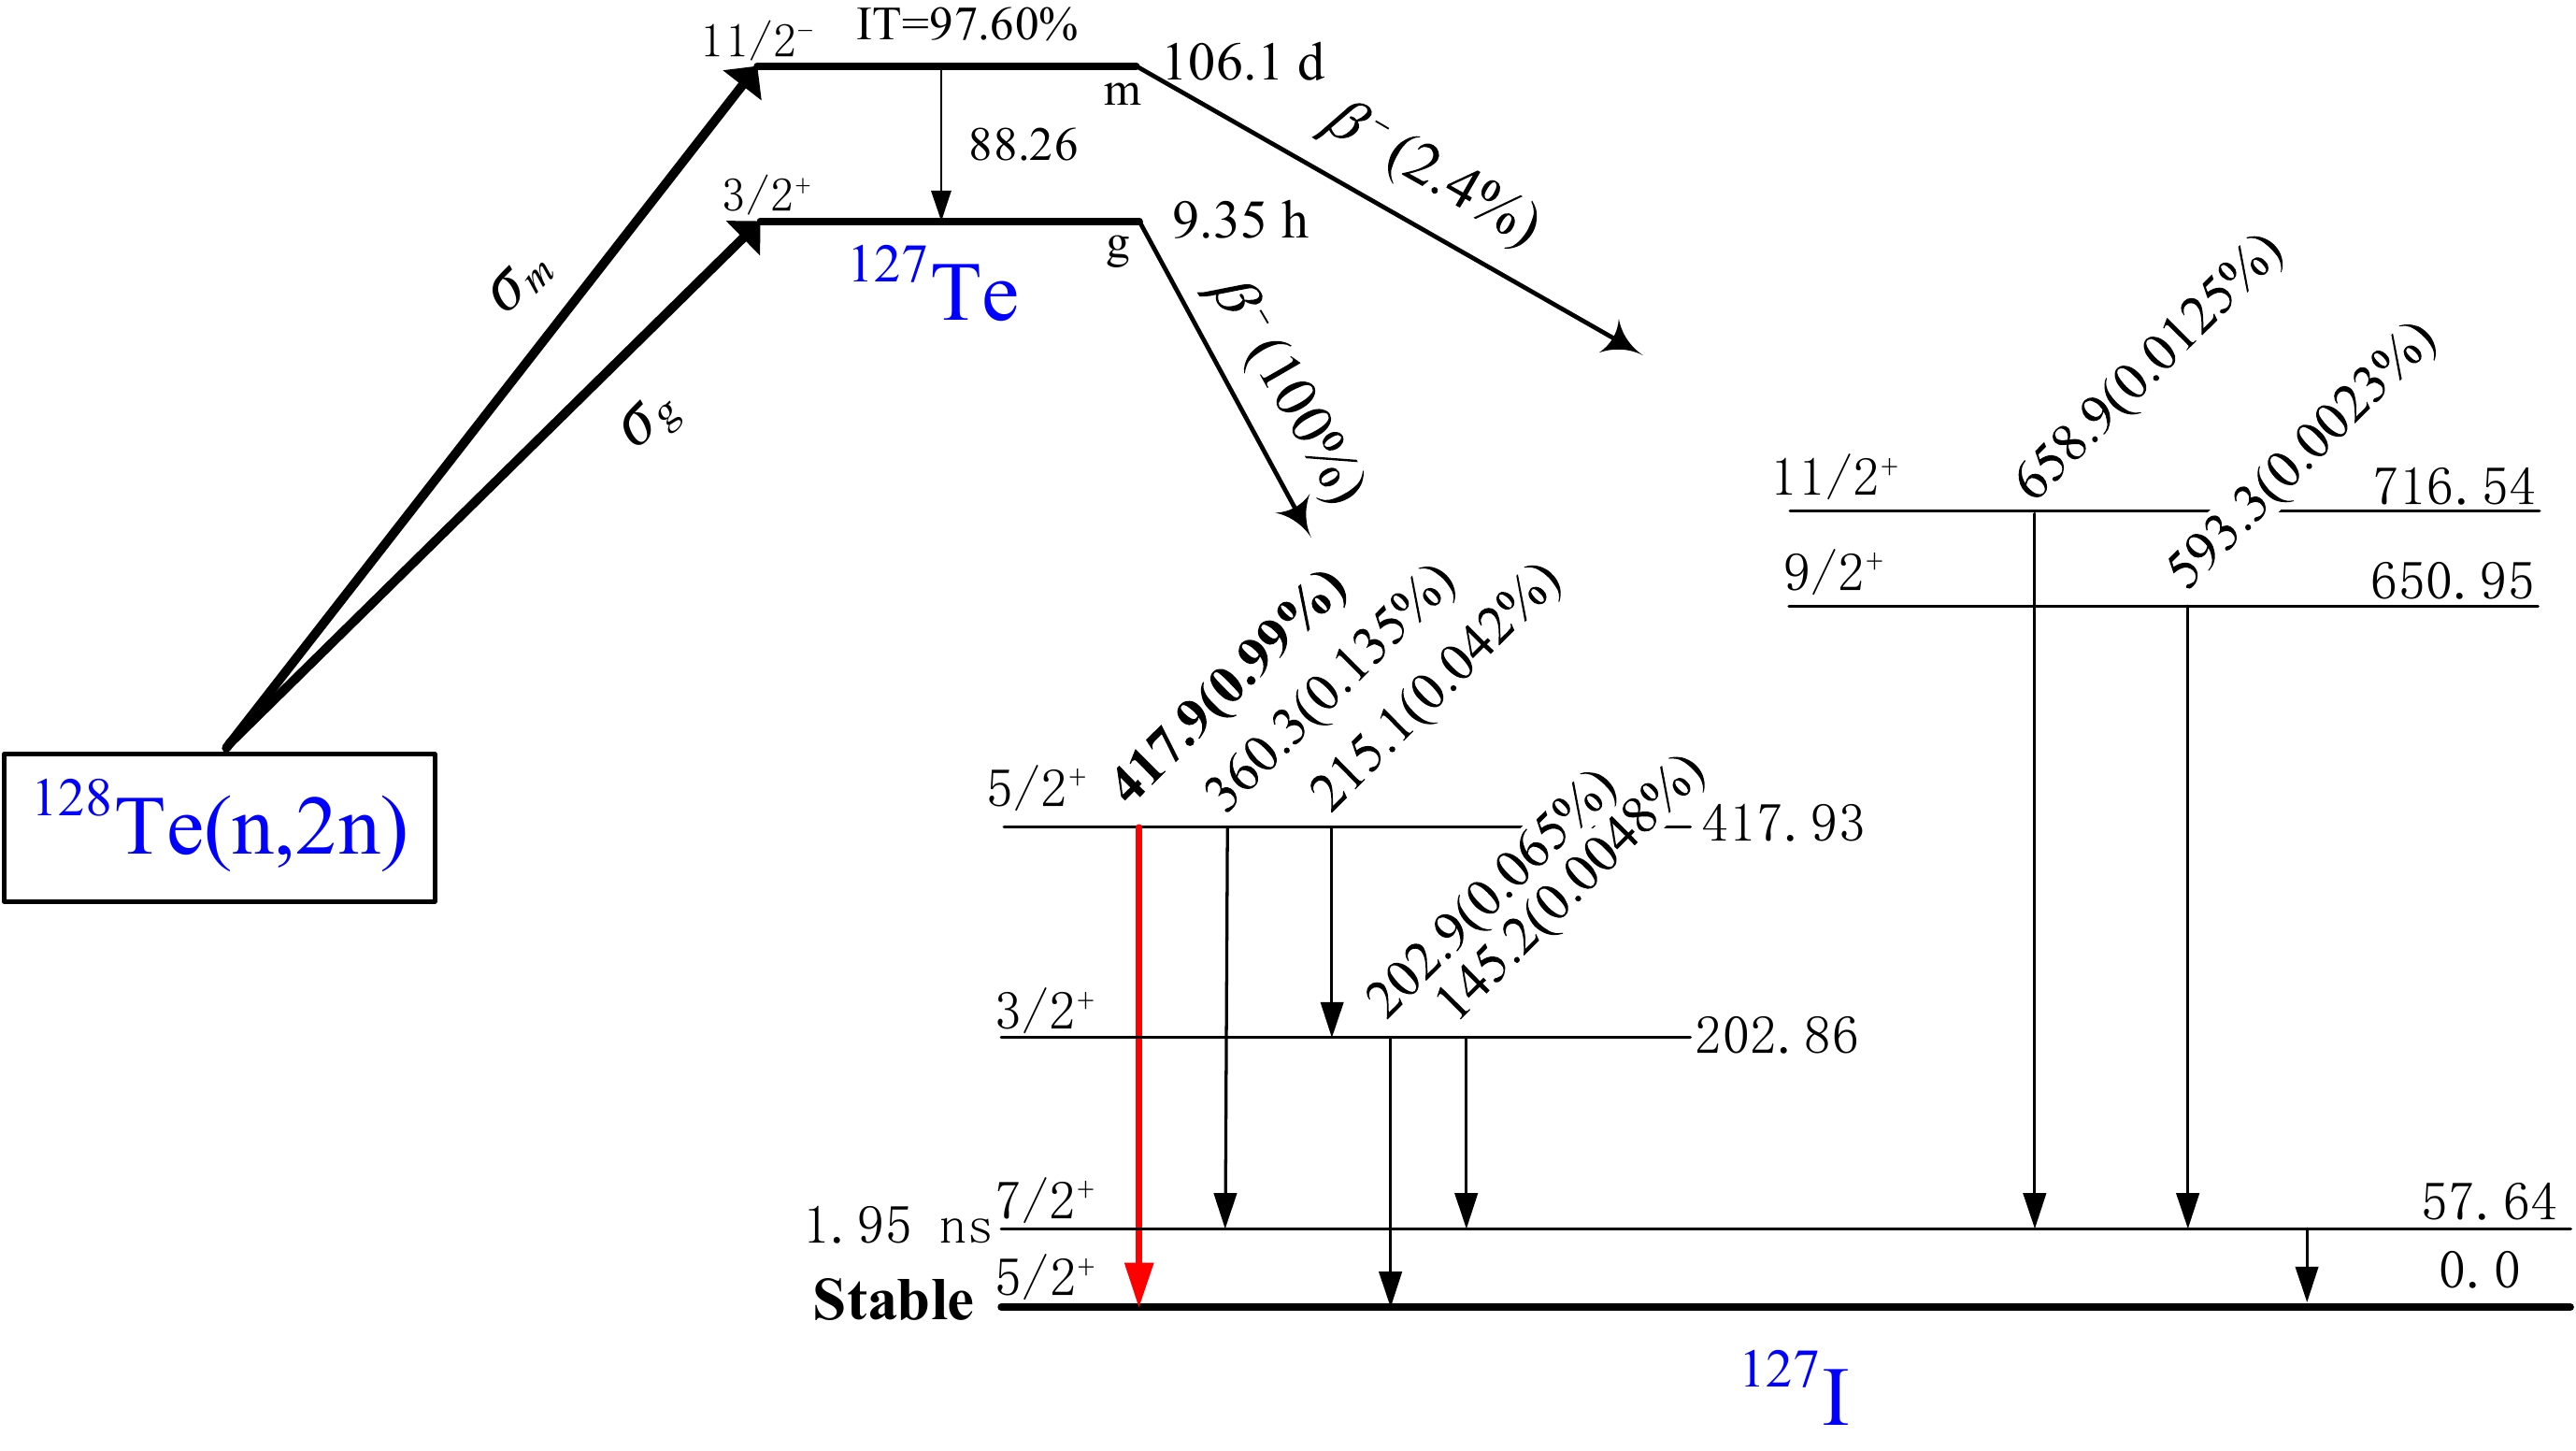
Figure 1. (color online) The metastable and ground states formed by the 128Te(n, 2n)127m,gTe reaction [24].
Reaction Decay data Detector Monitor
reactionReference 128Te(n, 2n)127mTe T1/2=109 d, Eγ=417 keV, Iγ=82% GeLi 56Fe(n,p)56Mn [12] T1/2=105 d, decay data: no information NaI No information [13] T1/2=109 d, β counts GEMUC 1H(n,el)1H [14] T1/2=109 d, Eγ=360.3 keV, Iγ=0.13464 %; HPGe 93Nb(n, 2n)92mNb [15] 128Te(n, 2n)127gTe T1/2=9.4 h, Eγ=417 keV, Iγ= 0.83% GeLi 56Fe(n,p)56Mn [12] T1/2=9.3 h, Eγ=420 keV, Iγ= 0.83% NaI No information [13] T1/2=9.48 h, β counts GEMUC 1H(n,el)1H [14] T1/2=9.35 h, Eγ=418.0 keV (Iγ=0.993%), Eγ=360.3 keV (Iγ=0.135%) HPGe 27Al(n,α)24Na [16] T1/2=9.35 h, Eγ=417.9 keV, Iγ= 0.99% HPGe 93Nb(n, 2n)92mNb [17] T1/2=9.35 h, Eγ=417.9 keV, Iγ= 0.99% 93Nb(n, 2n)92mNb [18] T1/2=9.35 h, Eγ=417.9 keV (Iγ=0.99%), Eγ=360.3 keV (Iγ=0.135%) GeLi 93Nb(n, 2n)92mNb [19] T1/2=9.3 h, β counts GeLi No information [20] T1/2=9.3 h, decay data: no information NaI 27Al(n,α)24Na [21] T1/2=9.3 h, enriched to 94.4 % of 128Te, decay data: No information 130Te(n, 2n)129gTe [22] T1/2=9.5 h, decay data: no information GEMUC 3H(d,n)4He [23] Table 1. Cross-sectional measurements of the 128Te(n, 2n)127m,gTe reactions from reported measurements.
i. Issues with decay data (half-life and γ-ray intensity). The cross sections for the 128Te(n, 2n)127mTe reaction have been obtained by Lu et al. [12], Bormann et al. [14], and Zhou et al. [15] using a half-life of 109 d (see Table 1), and by Husain and Kuroda [13] using a half-life of 105 d. Recent measurements were performed for data using a half-life of 106.1 d [24]. Lu et al. [12], Husain and Kuroda [13], Schnabel et al. [16], Zhou et al. [17], Filatenkov et al. [18], and Filatenkov [19] determined cross sections of the 128Te(n, 2n)127gTe reaction using γ-ray intensities of 0.83%, 0.83%, 0.993%, 0.99%, 0.99%, and 0.99%, respectively, for the same γ-ray energy of 417.9 keV. Recent measurements have used a γ-ray intensity of 0.99% [24].
ii. A variety of calculations. Previous researchers [12, 15] used the 417-keV and 306.3-keV gamma rays released in the 127gTe decay to evaluate the reaction cross section of 128Te(n, 2n)127mTe [β–(2.4%), IT(97.6%), T1/2=106.1 d]. These two studies inconsistently calculated the cross sections of the excited state using the characteristic rays of the ground state (i.e., a secondary nuclear decay approach).
iii. Interfering reactions. For the 128Te(n, 2n)127gTe reaction, the characteristic rays are generated by the product nucleus 127gTe and the 128Te(n, 2n)127mTe reaction via
$\rm {}^{127m}Te\xrightarrow{{IT(97.6{\text{%}} )}} \rm {}^{127g}Te$ (see Fig. 1). The interference of the excited state can be deduced through the isomeric transition. This is not discussed in detail in the early literature.In this study, nuclear reaction cross section measurements were obtained via secondary nuclear decay for the 128Te(n, 2n)127mTe reactions. When the Te samples and Nb-based monitor foils were activated, the neutron flux and reaction cross section were measured. The remaining nuclear ground state characteristic rays (instead of low-energy rays) were used to quantify the nuclear reaction cross section σm of the excited states. The results indicated that the cross section σg of the pure ground state can be estimated using the residual nuclear decay technique. In addition, the isomeric cross section ratio of 127m,gTe in the 128Te(n, 2n) reaction was calculated. The uncertainty was carefully assessed based on the measurements. Finally, comparisons were made between the results obtained in this study and the early experimental and theoretical calculations that were derived from the TALYS-1.96 [25], ENDF/B-VIII.0 [26], BROND-3.1 [27], JEFF-3.3[28], JENDL-5[29], and TENDL-2021[30] assessment data.
-
When the cooling time (t1, see Fig. 2) is significantly longer than the half-life of the ground state (127gTe) (typically greater than six half-lives), the characteristic rays of the ground state can be considered to originate entirely from the isomer transition of the excited state (127mTe). This is based on the fact that the half-life of the product nucleus of the nuclear reaction 128Te(n, 2n) is as shown in Fig. 1. Directly obtaining the cross section of the excited state from the characteristic ray activity of the ground state is possible using the following method.

Figure 2. (color online) Schematic illustration of the times in which the sample is irradiated, cooled, and measured.
The formula for the excited state cross section is [31]
$ \begin{aligned}[b] {\sigma _m} =\;& \frac{{{A_m}{C_{mg}}({\lambda _g} - {\lambda _m}){\lambda _m}{\lambda _g}}}{{{I_{\gamma g}}{\varepsilon _g}{M_m}{\eta _m}{K_m}{P_{mg}}(\lambda _g^2{S_m}{D_m} - \lambda _m^2{S_g}{D_g})}} \\&\times {\left[ {\frac{{{I_\gamma }\varepsilon \eta KMSD}}{{AC\lambda }}\sigma } \right]_{Nb}} \end{aligned} ,$

(1) where the subscript Nb represents the term corresponding to the monitor reaction,
$ \begin{aligned}[b]& {S_m} = 1 - {\mathrm{e}^{ - {\lambda _m}T}},\quad {S_g} = 1 - {\mathrm{e}^{ - {\lambda _g}T}},\\&{D_m} = {\mathrm{e}^{ - {\lambda _m}{t_1}}} - {\mathrm{e}^{ - {\lambda _m}({t_1} + {t_2})}},\quad{D_g} = {\mathrm{e}^{ - {\lambda _g}{t_1}}} - {\mathrm{e}^{ - {\lambda _g}({t_1} + {t_2})}} \end{aligned} ,$

and K is the neutron fluence fluctuation factor:
$ K=\left[\sum_{i}^{L} \Phi_{i}\left(1-\mathrm{e}^{-\lambda \Delta t_{i}}\right) \mathrm{e}^{-\lambda T_{i}}\right] / \Phi S .$

(2) -
When the cooling time is less than three times the half-life of the ground state, the isomer transition of the excited state affects the ground state, and the following equation can be used to calculate the ground state formation cross sections [32, 33]:
$ {\sigma _g} = \frac{{{{[S\varepsilon {I_\gamma }\eta KMD]}_{Nb}}}}{{{{[S\varepsilon {I_\gamma }\eta KMD]}_g}}} \cdot \frac{{{{[\lambda AFC]}_g}}}{{{{[\lambda AFC]}_{Nb}}}}{\sigma _{Nb}} . $

(3) Table 2 lists the significance of each quantity displayed in Equations (1)-(3). Table 3 lists the self-absorption correction factors of the measured characteristic 417.9-keV γ-ray corresponding to the five Te samples.
Symbols Physical significance T total irradiation time t1 total cooling time t2 total measurement time A atomic weight C measured full-energy peak area Iγ gamma-ray intensity M mass of the sample L number of time intervals into which the irradiation time is divided Δti duration of the i-th time interval Ti time interval from the end of the i-th interval to the end of the irradiation time F coefficients reflecting self-absorption for the specific gamma-ray energy σ reaction cross section λ decay constant of the residual nucleus ε full-energy peak efficiency of the measured characteristic gamma ray η abundance of the target nuclide Φi neutron flux averaged over the sample during Δti Φ neutron flux averaged over the sample during the total irradiation time T Table 2. Description of the symbols displayed in Eqs. (1)–(3).
Gamma-ray
energy
(keV)μ/ρ
(cm2/g)μ
(cm−1)Sample no. Correction
factor F417.9 0.1122 0.700 1 1.069 2 1.063 3 1.067 4 1.073 5 1.074 Table 3. Self-absorption correction factors for the five Te samples at the measured characteristic 417.9-keV gamma-ray energy. The angles of the five samples toward the beam are 0º (no. 1), 45º (no. 4), 90º (no. 2), 110º (no. 5), and 135º (no. 3).
-
Tellurium samples with a natural isotopic composition weigh between 3.4 and 4.1 g and are 99.99% refined. The sample was a disc with a diameter of 20 mm. The weight and shape of the sample were the two factors that determined its thickness. For the purpose of conducting irradiation tests, five samples and 10 monitors made of 99.99% pure niobium foil and 99% pure zirconium, respectively, with the same diameter were fabricated. In forming ZrNb-Te-NbZr, the component sample (Te), monitor (Nb), and zirconium were added. Using the 90Zr(n, 2n)89m+gZr/93Nb(n, 2n)92mNb cross section ratio method, zirconium was irradiated by neutrons to determine the energy of the neutrons, while cadmium foil (with a thickness of ~1 mm) was used to absorb low-energy neutrons and prevent them from irradiating into the sample. This allowed the zirconium to be used to verify the energy of the neutrons. A reduction in the impact of the 126Te(n,γ)127m,gTe reactions on the 128Te(n, 2n)127m,gTe reactions was observed as a consequence. The data for the reaction cross section of the 93Nb(n, 2n)92mNb reaction were obtained from IRDFF-II, 2020 [34]. The details of each sample are displayed in Table 4.
Sample no. Mass
(g)Thickness
(cm)128Te isotope weight in the sample (g) Number of target atoms (1021 atoms) 1 3.7999 0.1938 1.2061 5.6743 2 3.4459 0.1758 1.0937 5.1457 3 3.6480 0.1861 1.1579 5.4474 4 3.9934 0.2037 1.2675 5.9632 5 4.0404 0.2061 1.2824 6.0334 Table 4. Details of the samples used in this study.
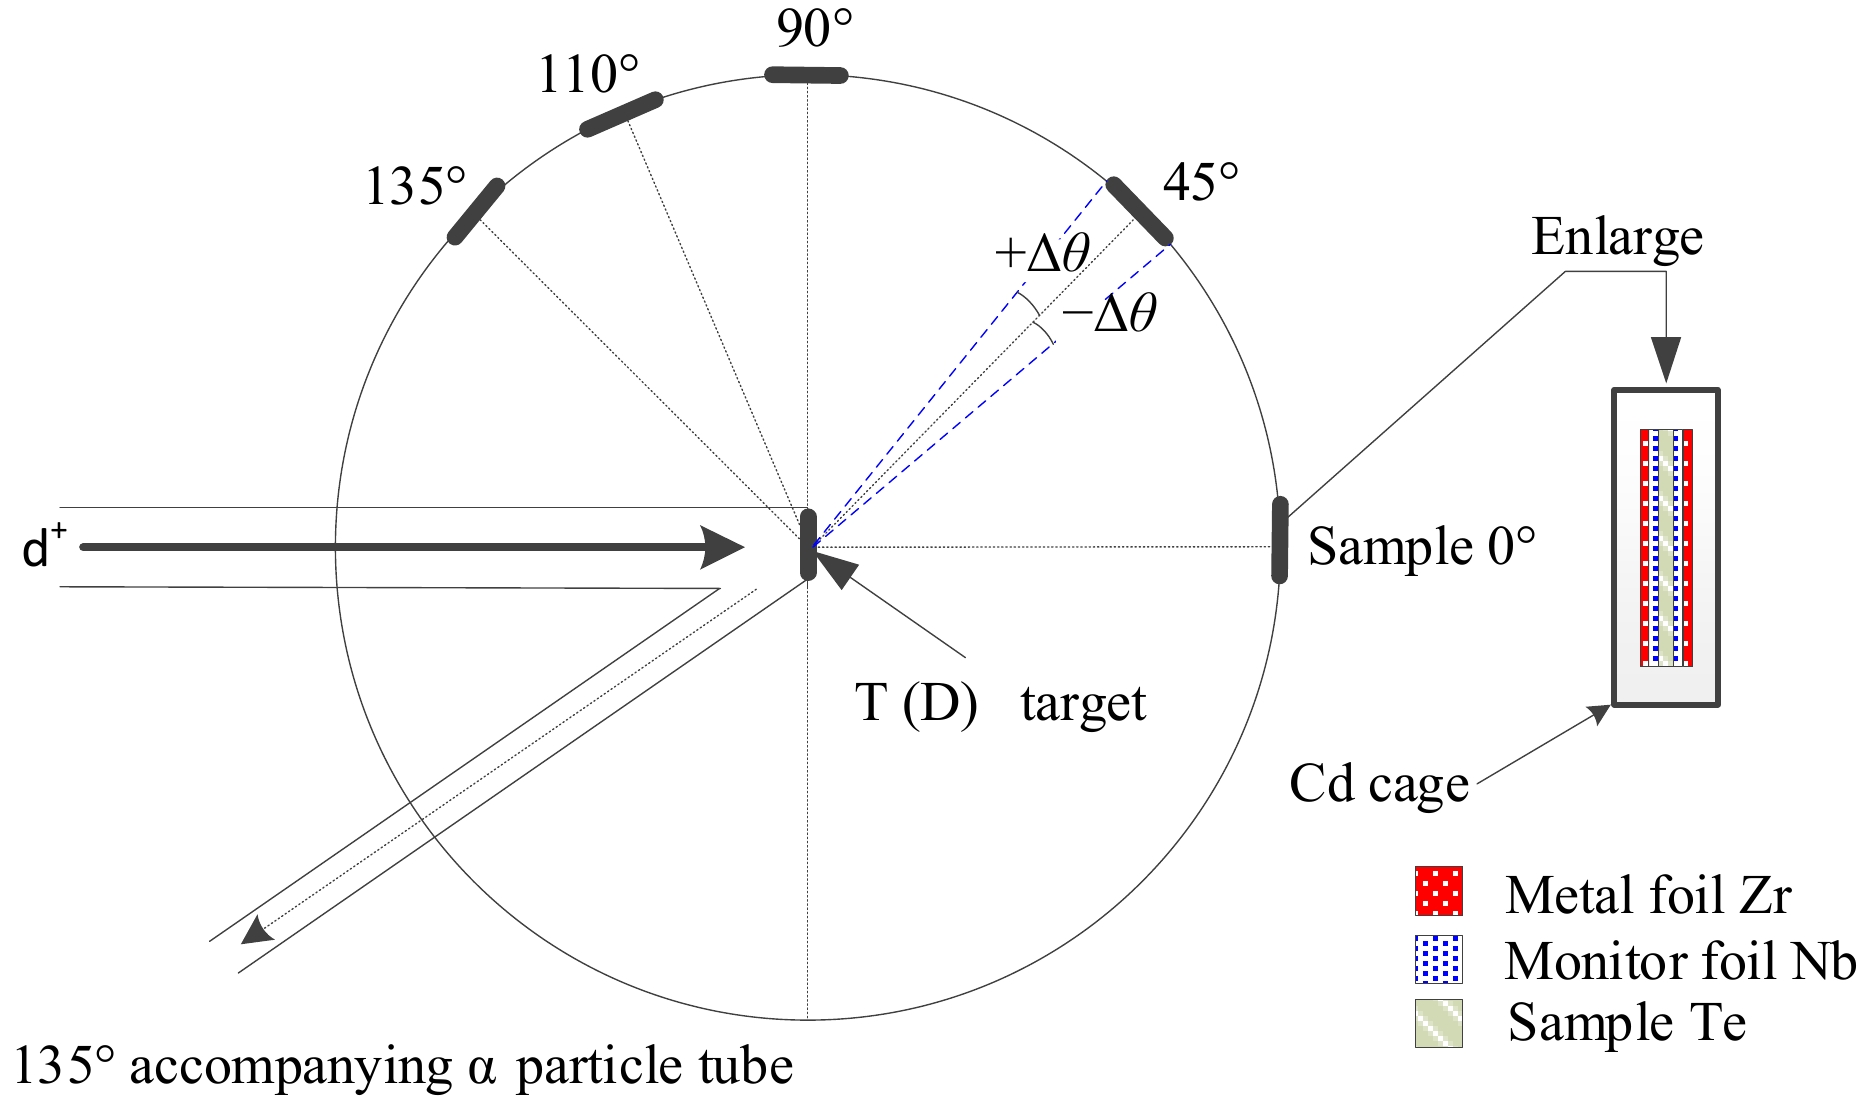
The neutron activation experiment was carried out using a K-400 neutron generator, and the radiation lasted for two to three hours. The neutron yield was calculated to be (4-5)×1010 n/s. In the case of deuterium beams, the average energy value was 135 keV, and the average intensity value was 240 μA. At a distance of 5 cm from the sample group, the thickness of the tritium–titanium (T-Ti) was 2.65 mg/cm2. The experimental setup is shown in Fig. 3. While the experiment was carried out, the fluence variations of the neutrons were monitored using accompanying particles.
-
The neutron energies were calculated using [35, 36]
$ {({E_n})^{\tfrac{1}{2}}} = \frac{{{{({M_d}{M_n}{E_d})}^{\tfrac{1}{2}}}\cos \theta \pm {{({M_d}{M_n}{E_d}{{\cos }^2}\theta + ({M_\alpha } + {M_n})[{M_\alpha }Q + {E_d}({M_\alpha } - {M_n})])}^{\tfrac{1}{2}}}}}{{{M_\alpha } + {M_n}}} , $

(4) where Ed denotes the deuteron beam energy; En is the kinetic energy of the neutrons emitted at angle θ; and Md, Mn, and Mα are the masses of the deuteron, neutron, and alpha particles, respectively. At the location of the sample, the uncertainty was calculated using the solid angle of the sample. The neutron energies and their uncertainties are given in Table 5. The results were consistent with the 90Zr(n, 2n)89m+gZr/93Nb(n, 2n)92mNb cross section ratio method (i.e., within the uncertainties).
Irradiation
angle
(°)En
(MeV)ΔEn
(MeV
@±Δθ)Neutron
energy
(MeV)Uncertainty 135 13.585 −0.094
+0.11613.59 0.12 110 13.863 −0.136
+0.14813.86 0.15 90 14.129 −0.153
+0.15514.13 0.16 45 14.696 −0.124
+0.10214.70 0.13 0 14.937 −0.016 14.94 0.02 Table 5. Neutron energies as a function of irradiation angle.
-
The activated sample was monitored using an HPGe detector (ORTEC, model GEM 60P). For 60Co, the detector's efficiency was 68%, and its energy resolution was 1.69 keV at 1.332 MeV. For this experiment, two measurements were taken from each sample. The second dataset was taken 4.7 d later, nearly 12 times the half-life of the ground state of 127gTe, and the first set was taken between 0.5 and 27 h after irradiation. Table 6 displays the specifications of the counting time factor measured in this study. In addition, typical spectra from the irradiated tellurium (Te) samples taken during isomeric and ground state observations are shown in Figs. 4 and 5, respectively. Table 7 presents the half-lives and intensities of the γ-rays used in the analysis. The energy and efficiency were checked by calibrating the detector with reference gamma-ray sources 133Ba, 137Cs, 152Eu, and 226Ra. Further details are available in our previous report [33].
Sample
no.Irradiation T First measurement Second measurement Cool t1 Measurement t2 Cool t1 Measurement t2 1 10860 11056 52526 582178 9063 2 10860 97308 50456 412814 4672 3 10860 64614 32161 417578 9959 4 7200 3618 1608 541419 48809 5 7200 1757 1627 505079 35811 Table 6. Time factor parameters (in s).
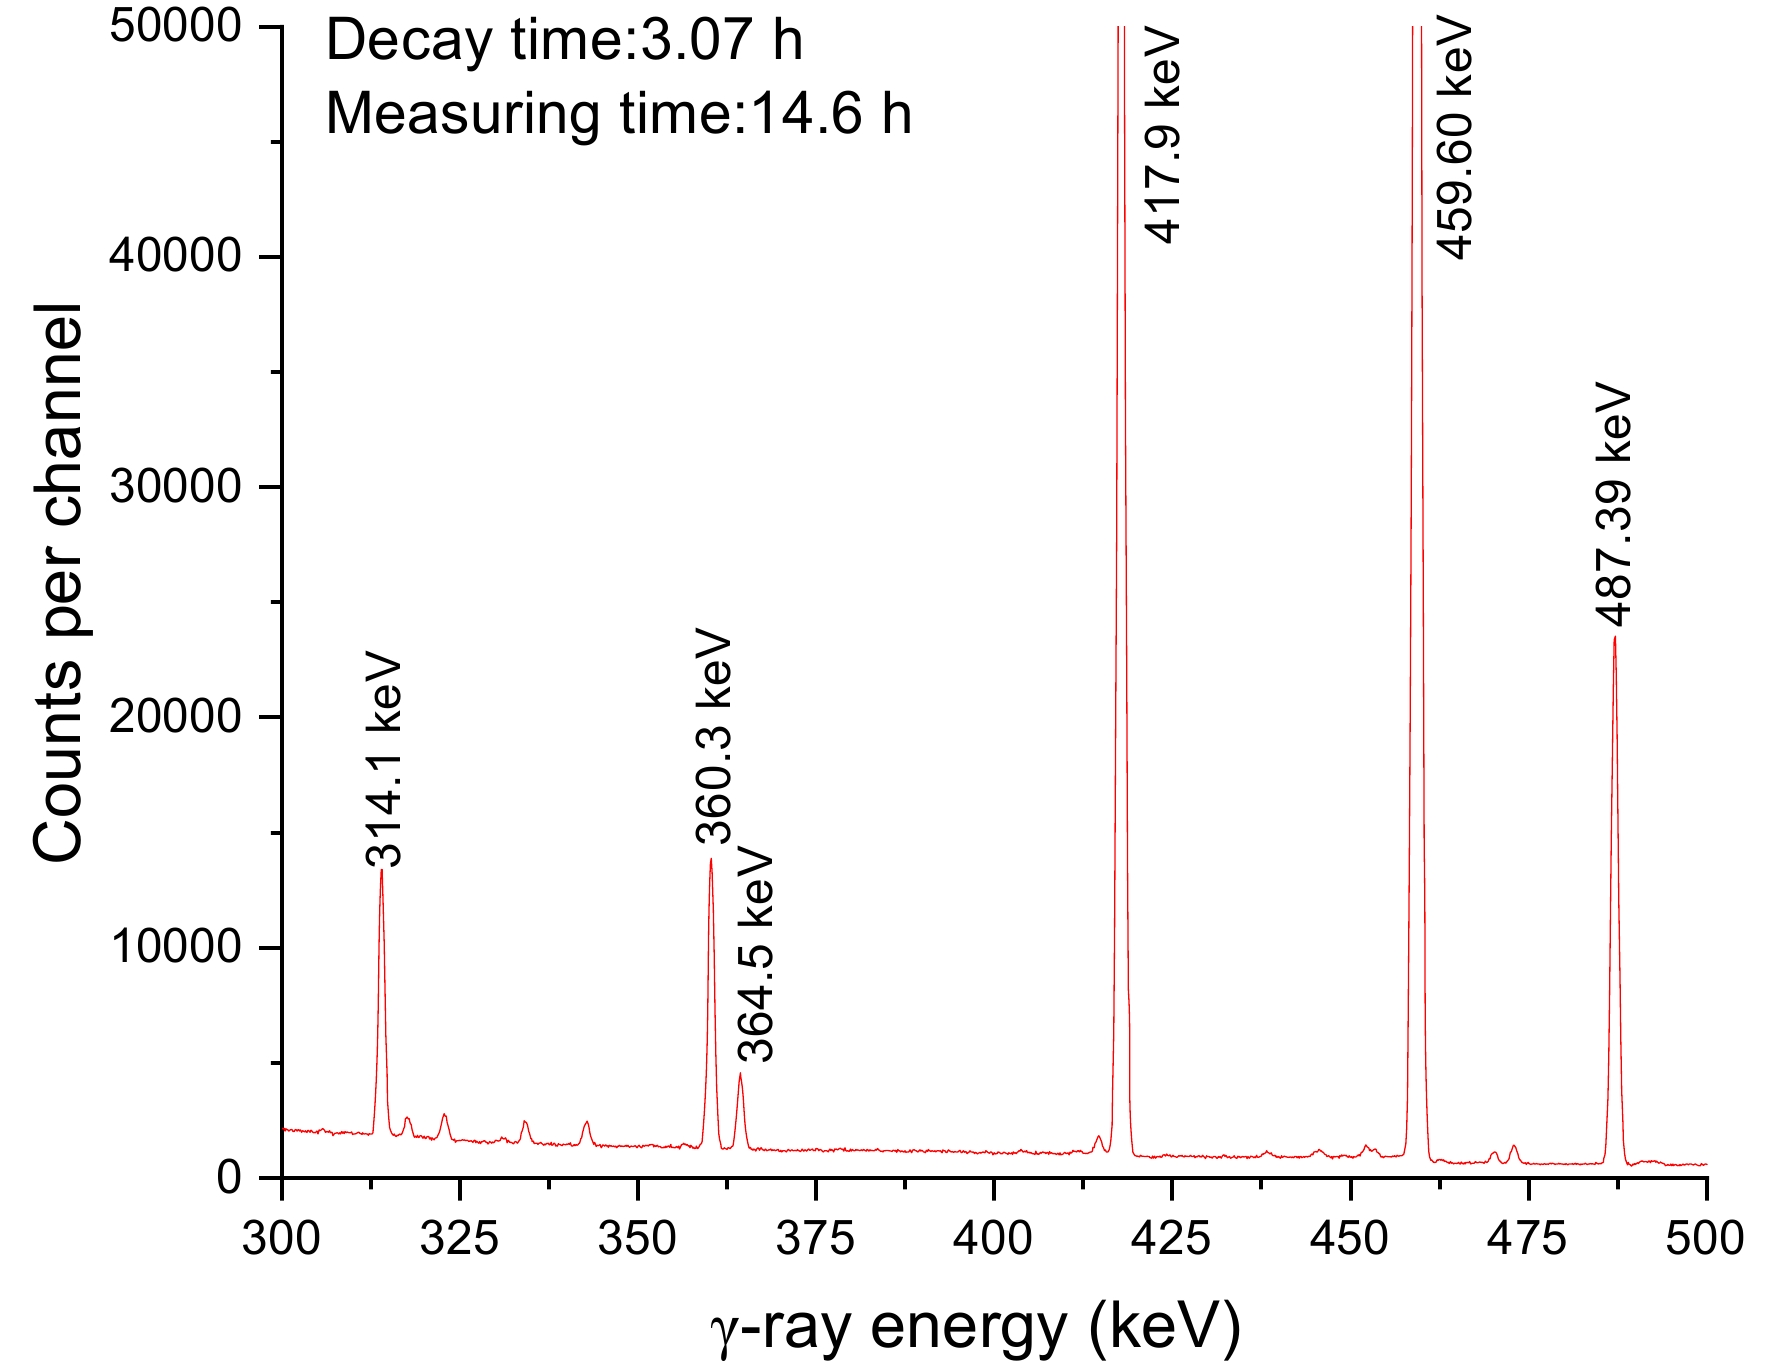
Figure 4. (color online) Gamma-ray spectrum of the irradiated Te sample approximately 3 h after irradiation.
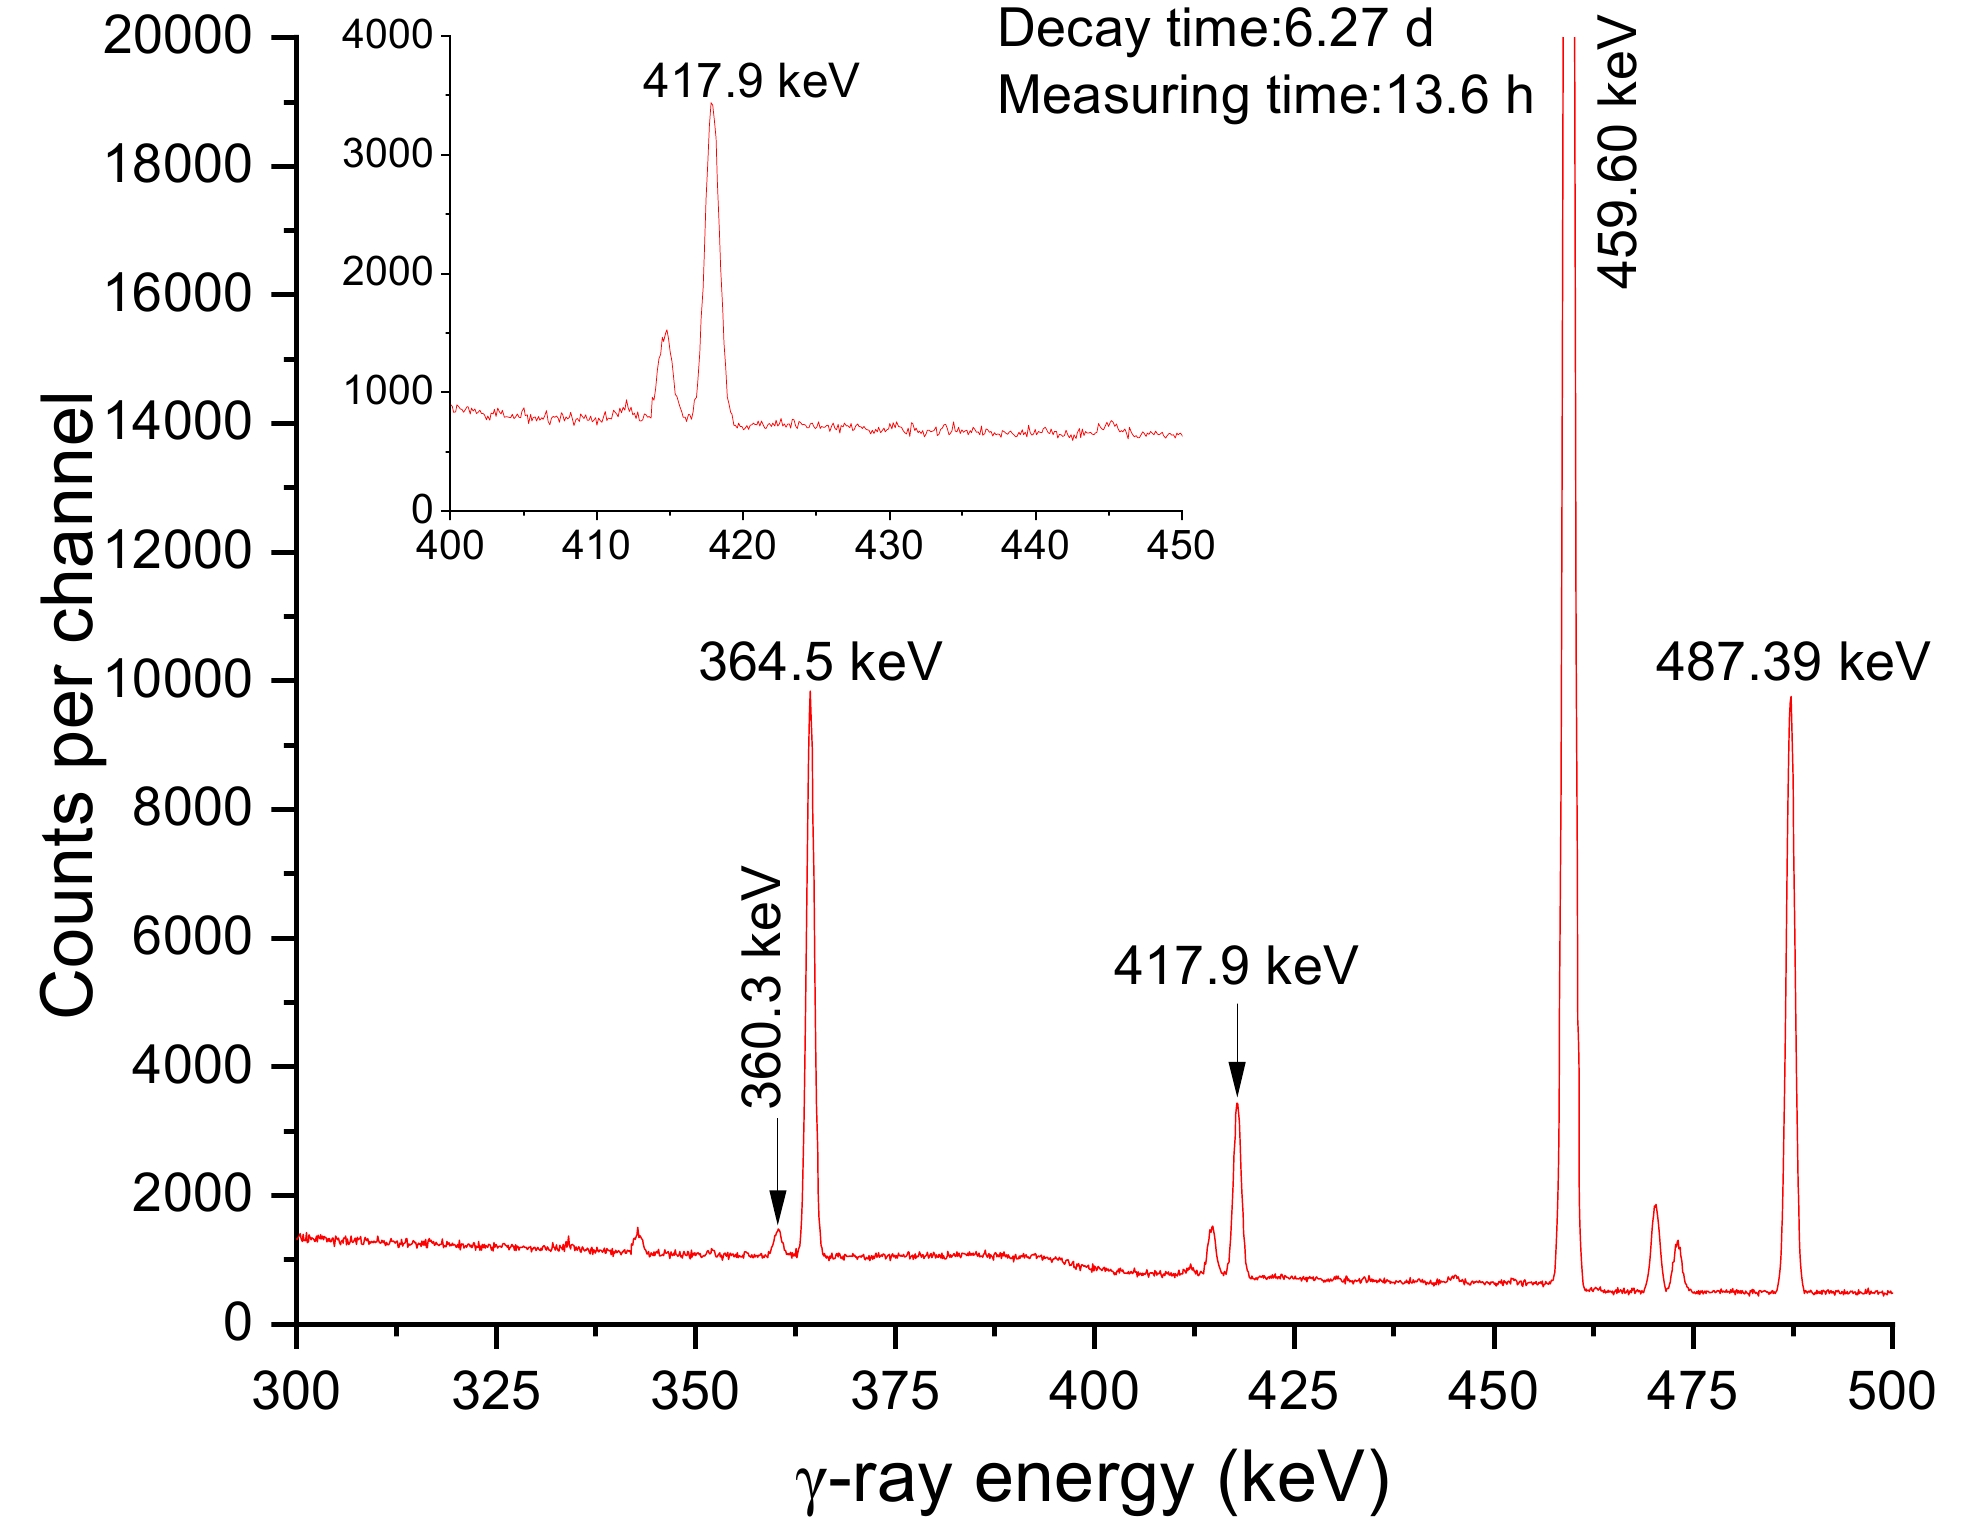
Figure 5. (color online) Gamma-ray spectrum of the irradiated Te sample approximately 6.27 d after irradiation.
Reaction Abundance of
target isotope (%)Half-life of
productE-threshold
(MeV)Mode of
decay (%)Eγ
(keV)Iγ
(%)128Te(n, 2n) 127mTe 31.748 106.1 d7 8.943 IT(97.60)
β- (2.40)88.26
57.630.084
0.518128Te(n, 2n) 127gTe 31.748 9.35 h7 8.854 β- (100) 417.9
360.30.9910
0.1351093Nb(n, 2n)92mNb 100 10.15 d2 8.972 EC (100) 934.46 99.154 Uncertainty in the numeric values refers to the last digits of the value: 31.748 % means (31.74±0.08)%, 106.1 d7 means (106.1±0.7) d. -
For the 128Te(n, 2n)127mTe reaction, the neutron-induced cross section (σm) was computed using Eq. (1) and the second measurement dataset. When calculating the cross sections for the 128Te(n, 2n)127gTe reaction, the value of Cg in Eq. (3) was determined by subtracting the contribution from 127mTe (as determined via the counting process) from the measured full-energy peak area at 417.9 keV (the
$ ^{127m}{\text{Te}}\xrightarrow{{{\text{IT}}(97.6\% )}}{}^{{\text{127}}g}{\text{Te}} $ (counting$ C_{mg}^1 $ ) process). The contributions of the 128Te(n, 2n)127mTe reaction via the isomeric transition (97.6%) were subtracted using [31]$ C_{mg}^1 = \frac{{{{[{\varepsilon _g}(\lambda _g^2{S_m}{D_m} - \lambda _m^2{S_g}{D_g})]}_{\rm First - measurement}}}}{{{{[{\varepsilon _g}(\lambda _g^2{S_m}{D_m} - \lambda _m^2{S_g}{D_g})]}_{\rm Second - measurement}}}} \cdot C_{mg}^2 ,$

(5) where counting
$ C_{mg}^1 $ had a cooling time of t1<27 h and counting$ C_{mg}^2 $ had a cooling time of t1>4.7 d.When the cross sections were determined, there were 14 main sources of uncertainty, the meanings of which are displayed in Table 2. The timing factors are Sx,Nb and Dx,Nb. Because the half-life of the daughter nucleus was relatively long, the contributions of the irradiation, cooling, and measurement times to the uncertainty were negligible. The errors of S and D were calculated using the following formulas:
$ \begin{aligned}[b]\Delta S =\;& \frac{{\mathrm{d}S}}{{\mathrm{d}{T_{1/2}}}} \times \Delta {T_{1/2}} = \frac{{\mathrm{d}S}}{{\mathrm{d}\lambda }}\frac{{\mathrm{d}\lambda }}{{\mathrm{d}}{T_{1/2}}} \times \Delta {T_{1/2}} \\=\;& \frac{{{{\rm e}^{ - \lambda T}}T\lambda }}{{{T_{1/2}}}} \times \Delta {T_{1/2}}\;, \end{aligned} $

(6) $ \begin{aligned}[b] \Delta D =\;& \frac{{\mathrm{d}D}}{{\mathrm{d}{T_{1/2}}}} \times \Delta {T_{1/2}} = \frac{{\mathrm{d}D}}{{\mathrm{d}\lambda }}\frac{{\mathrm{d}\lambda }}{{\mathrm{d}{T_{1/2}}}} \times \Delta {T_{1/2}} \\=\;& \frac{{[{\mathrm{e}^{ - \lambda {t_1}}}{t_1} - {\mathrm{e}^{ - \lambda ({t_1} + {t_2})}}({t_1} + {t_2})]\lambda }}{{{T_{1/2}}}} \times \Delta {T_{1/2}} \end{aligned} .$

(7) The total section uncertainty was calculated using the sum of squares formula [8, 38–40]. Tables 8 and 9 show the fractional uncertainties in the factors that affected the reaction cross section. The covariance matrix was dispersed between neutron energies. After calculating the fractional uncertainties, covariance analysis was used to generate correlation coefficients between the energy attributes. Table 10 presents the correlation coefficients between certain characteristics and energies, where i, j, k, l, and n indicate 13.59, 13.86, 14.13, 14.70, and 14.94 MeV, respectively. To calculate (σxi,σxj), 14 subsets (attributes) were added and used in the following equation [39]:
Attributes (x) Fractional uncertainties (%) 13.59 MeV (Δxi) 13.86 MeV (Δxj) 14.13 MeV (Δxk) 14.70 MeV (Δxl) 14.94 MeV (Δxn) Cx 3.8325 3.9749 5.4972 3.1862 3.2701 CNb 0.9932 0.9856 0.9732 0.8393 0.9720 Ix 10.1010 10.1010 10.1010 10.1010 10.1010 INb 0.0403 0.0403 0.0403 0.0403 0.0403 Mx 0.0274 0.0248 0.0290 0.0250 0.0263 MNb 0.0417 0.1882 0.0410 0.1915 0.0406 ηx 0.2520 0.2520 0.2520 0.2520 0.2520 σNb 0.5957 0.5615 0.5461 0.5645 0.5876 εx 2.5012 2.5017 2.5012 2.5017 2.5012 εNb 2.5031 2.5038 2.5031 2.5038 2.5031 Sx 0.6595 0.6596 0.6595 0.6596 0.6595 SNb 0.1962 0.1965 0.1962 0.1965 0.1962 Dx 0.6387 0.6337 0.6390 0.6315 0.6305 DNb 0.1955 0.1959 0.1955 0.1959 0.1955 Total error (%) 11.47 11.52 12.12 11.26 11.29 Table 8. Fractional uncertainties (%) of the 128Te(n, 2n)127mTe reaction.
Attributes (x) Fractional uncertainties (%) 13.59 MeV (Δxi) 13.86 MeV (Δxj) 14.13 MeV (Δxk) 14.70 MeV (Δxl) 14.94 MeV (Δxn) Cx 0.1681 2.9452 0.2126 1.5636 0.1317 CNb 0.9932 0.9856 0.9732 0.8393 0.9720 Ix 10.1010 10.1010 10.1010 10.1010 10.1010 INb 0.0403 0.0403 0.0403 0.0403 0.0403 Mx 0.0274 0.0248 0.0290 0.0250 0.0263 MNb 0.0417 0.1882 0.0410 0.1915 0.0406 ηx 0.2520 0.2520 0.2520 0.2520 0.2520 σNb 0.5957 0.5615 0.5461 0.5645 0.5876 εx 2.5012 2.5017 2.5012 2.5017 2.5012 εNb 2.5031 2.5038 2.5031 2.5038 2.5031 Sx 0.6681 0.6945 0.6681 0.6945 0.6681 SNb 0.1962 0.1965 0.1962 0.1965 0.1962 Dx 0.4682 0.7091 1.0743 0.6806 0.2449 DNb 0.1955 0.1959 0.1955 0.1959 0.1955 Total error (%) 10.80 11.21 10.84 10.92 10.79 Table 9. Fractional uncertainties (%) of the 128Te(n, 2n)127gTe reaction.
Cor(Δx, Δx) Correlation coefficient (Δx, Δx) Cx CNb Mx MNb εx Sx Dx (Δxi, Δxi) 1 1 1 1 1 1 1 (Δxi, Δxj) 0 0 0 0 0.9994 0 0 (Δxi, Δxk) 0 0 0 0 0.9994 0 0 (Δxi, Δxl) 0 0 0 0 0.9994 0 0 (Δxi, Δxn) 0 0 0 0 0.9994 0 0 (Δxj, Δxj) 1 1 1 1 1 1 1 (Δxj, Δxk) 0 0 0 0 0.9994 0 0 (Δxj, Δxl) 0 0 0 0 0.9994 0 0 (Δxj, Δxn) 0 0 0 0 0.9994 0 0 (Δxk, Δk) 1 1 1 1 1 1 1 (Δxk, Δxl) 0 0 0 0 0.9994 0 0 (Δxk, Δxn) 0 0 0 0 0.9994 0 0 (Δxl, Δxl) 1 1 1 1 1 1 1 (Δxl, Δxn) 0 0 0 0 0.9994 0 0 (Δxn, Δxn) 1 1 1 1 1 1 1 Table 10. Correlation coefficients of several parameters in the 13–15 MeV range for the 128Te(n, 2n)127m,gTe reaction cross section. At these energies, there is a full correlation between the Ix, INb, ηx, σNb, εNb, SNb, and DNb subsets.
$ \operatorname{Cov}\left(\sigma_{x i^{\prime}} \sigma_{x j}\right)=\sum_{i} \sum_{j} \Delta x_{i} \times \operatorname{Cor}\left(\Delta x_{i}, \Delta x_{j}\right) \times \Delta x_{j} .$

(8) Using Eq. (8), a [5×5] covariance matrix was created. The overall uncertainty in the measured cross section was calculated using [39]
$ \operatorname{Cov}\left(\sigma_{x i}, \sigma_{x i}\right)=\left(\Delta \sigma_{x i}\right)^{2} .$

(9) Based on the total uncertainty and covariance matrix, the correlation matrix [5×5] between neutron energies was propagated using [39]
$ \operatorname{Cor}\left(\sigma_{x i} \sigma_{x j}\right)=\frac{\operatorname{Cov}\left(\sigma_{x i} \sigma_{x j}\right)}{\left(\Delta \sigma_{x i}\right) \cdot\left(\Delta \sigma_{x j}\right)} .$

(10) Tables 11 and 12 provide the measured cross sections, uncertainties, and correlation matrices of the 128Te(n, 2n)127m,gTe reaction. Table 13 shows the experimentally observed neutron energy-dependent 128Te(n, 2n)127(m+g)Te reaction cross sections and isomeric ratios.
Neutron energy En (MeV) Cross section σx (mb) Δσx (%) Correlation matrix 13.59±0.12 887±102 11.47 1.0000 13.86±0.15 923±106 11.52 0.8707 1.0000 14.13±0.16 959±116 12.12 0.8270 0.8235 1.0000 14.70±0.13 1006±113 11.26 0.8908 0.8870 0.8425 1.0000 14.94±0.02 1028±116 11.29 0.8882 0.8844 0.8400 0.9048 1.0000 Table 11. Experimental cross sections, total uncertainties, and correlation matrices for the 128Te(n, 2n)127mTe reaction.
Neutron energy En (MeV) Cross section σx (mb) Δσx (%) Correlation matrix 13.59±0.12 579±63 10.80 1.0000 13.86±0.15 588±66 11.21 0.9497 1.0000 14.13±0.16 579±63 10.84 0.9817 0.9460 1.0000 14.70±0.13 544±59 10.92 0.9754 0.9399 0.9716 1.0000 14.94±0.02 543±59 10.79 0.9864 0.9505 0.9826 0.9763 1.0000 Table 12. Experimental cross sections, total uncertainties, and correlation matrices for the 128Te(n, 2n)127gTe reaction.
En (MeV) This study Monitor reaction 93Nb(n, 2n)92mNb CS (mb) IR (σm/σg) CS (mb) Reference 13.59±0.12 1466±119 1.53±0.24 454.55±2.71 [34] 13.86±0.15 1511±125 1.57±0.25 457.99±2.57 [34] 14.13±0.16 1538±132 1.66±0.27 459.76±2.51 [34] 14.70±0.13 1550±128 1.85±0.29 460.17±2.60 [34] 14.94±0.02 1571±130 1.89±0.30 460.28±2.70 [34] Table 13. Isomeric ratios (IRs) experimental cross sections (CSs) for the 128Te(n, 2n)127(m+g)Te reaction.
-
TALYS (version 1.96) was used to calculate the 128Te(n, 2n)127m,gTe reaction cross sections and isomeric ratio [25]. TALYS simulates nuclear reaction cross sections from the reaction threshold up to 200 MeV, and it analyzes and predicts nuclear reactions worldwide using cutting-edge nuclear structure and reaction models [41]. The reaction mechanism is described using the optical model potential (OMP), direct reactions included in the distorted wave Born approximation (DWBA), and compound nucleus model. To run the simulations, the ECIS-06 code in TALYS is used. Furthermore, pre-equilibrium reactions are modeled using both classical and quantum mechanical techniques. Masses, discrete levels, level densities, photon strength functions, and fission barriers are the most important nuclear structure models. In summary, the TALYS software is designed to provide a comprehensive description of the observables associated with nuclear reactions. It is also intended to serve as an essential link between the fundamentals of nuclear physics and its applications.
-
Tables 11–13 display the cross sections determined in this study. The characteristic ray intensity of the 127gTe daughter nucleus had an uncertainty of 10.10%, which resulted in insignificant measurements. Similarly, the excited and ground state cross sections were uncertain in a range of 10.8%-12.2%. The minimal contribution of the 126Te(n,γ) reaction products to the γ-ray activity could be disregarded because the reaction had a small cross section at the neutron energy of 14 MeV. Cadmium foil was used to decrease the heat and epithermal neutron impacts on the samples. The results for each reaction, as well as the isomeric cross section ratio, are described in the rest of this section.
-
Four previous cross-sectional experimental studies have examined the 128Te(n, 2n)127mTe reaction, in which the product has a half-life of 105–109 days. Lu and Zhou utilized typical gamma rays of 417 and 360.3 keV, respectively, while Husain and Kuroda [13] and Lu et al. [12] only gathered data at a single neutron energy point. According to the data presented in Fig. 1, the 417.9-keV and 360.3-keV lines do not correspond to the characteristic ray of 127mTe, but rather represent the characteristic γ-ray of its ground state. This experiment used the strongest characteristic ray of 127gTe (417 keV) to study the excited state cross section of the 128Te(n, 2n)127mTe reaction. We did not investigate the decay of 127gTe via 417.9-keV γ-rays for the first 4.7 days, but after the irradiation, the decay was due to interference from the 128Te(n, 2n)127gTe reaction. When the cooling time reached more than 12 times the half-life of the ground state, the ground state characteristic 417.9-keV gamma-ray count could be considered to originate entirely from the path
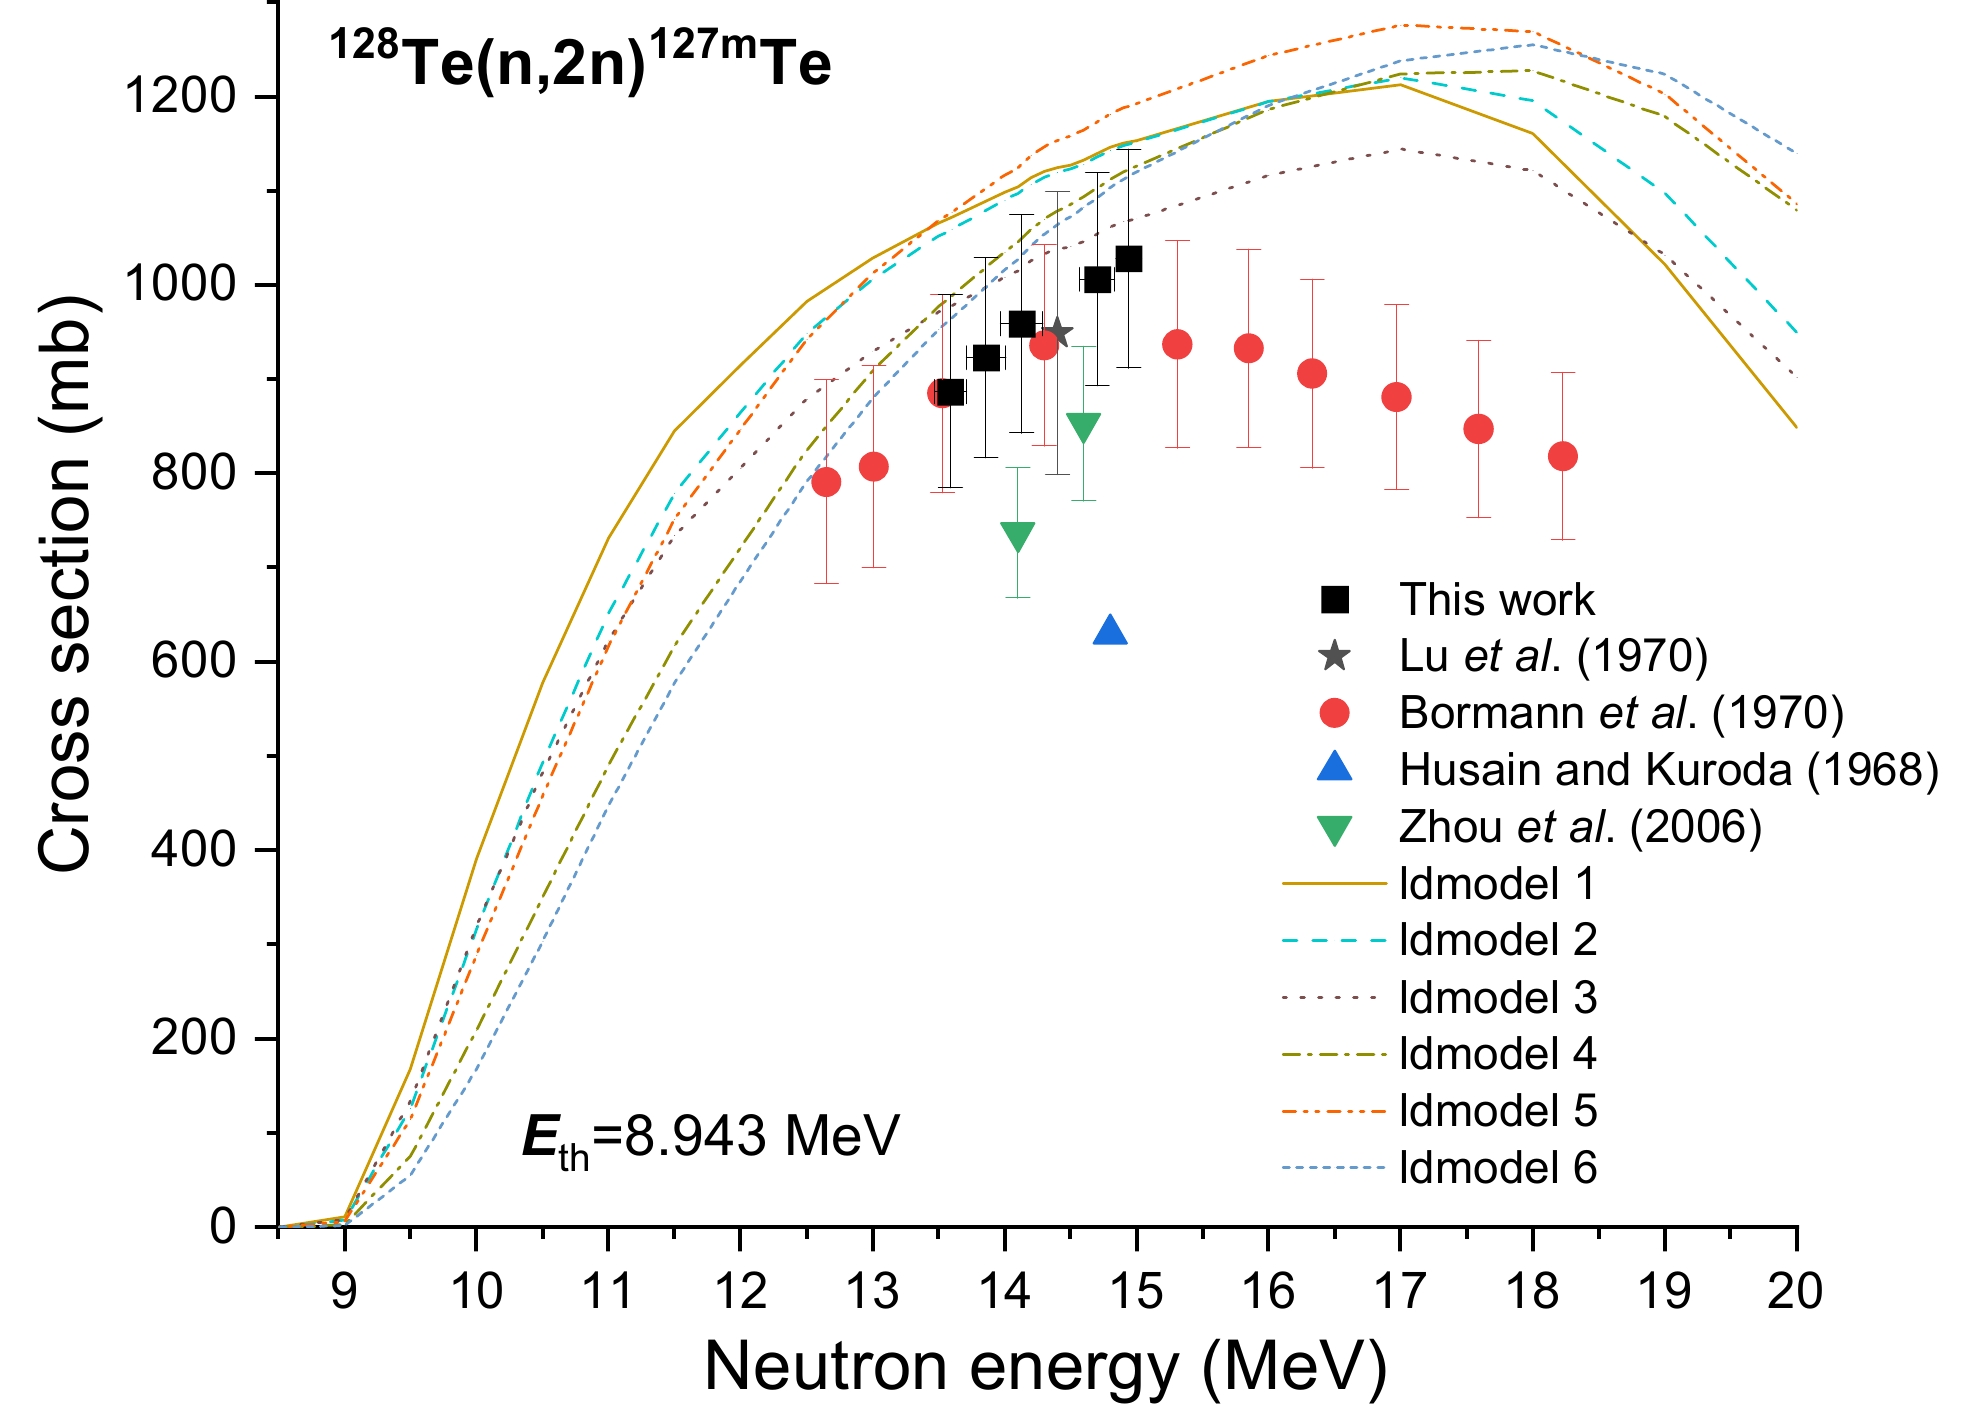
$^{128}{\text{Te}(n, 2n} {^{127\text{m}}}{\text{Te}}\xrightarrow{{{\text{IT}}(97.6\% )}} {}^{{\text{127}}g}{\text{Te(}}{\beta ^ - })$ , allowing the cross section of the nuclear reaction 128Te(n, 2n)127mTe to be calculated. Figure 6 displays the theoretical excitation function and experimental cross sections found for the 128Te(n, 2n)127mTe reaction, including the cross section derived in this study. The latter exhibited a considerable increase as the neutron energy increased. This trend matches the TALYS-1.96 theoretical results. The data produced by Lu et al. [12], Bomann et al. [14], and ldmodels 3, 4, and 6 in Talys-1.96 are in agreement with the data produced by this study between 13 and 15 MeV, but the data by Husain and Kuroda [13] are roughly 80% lower. -
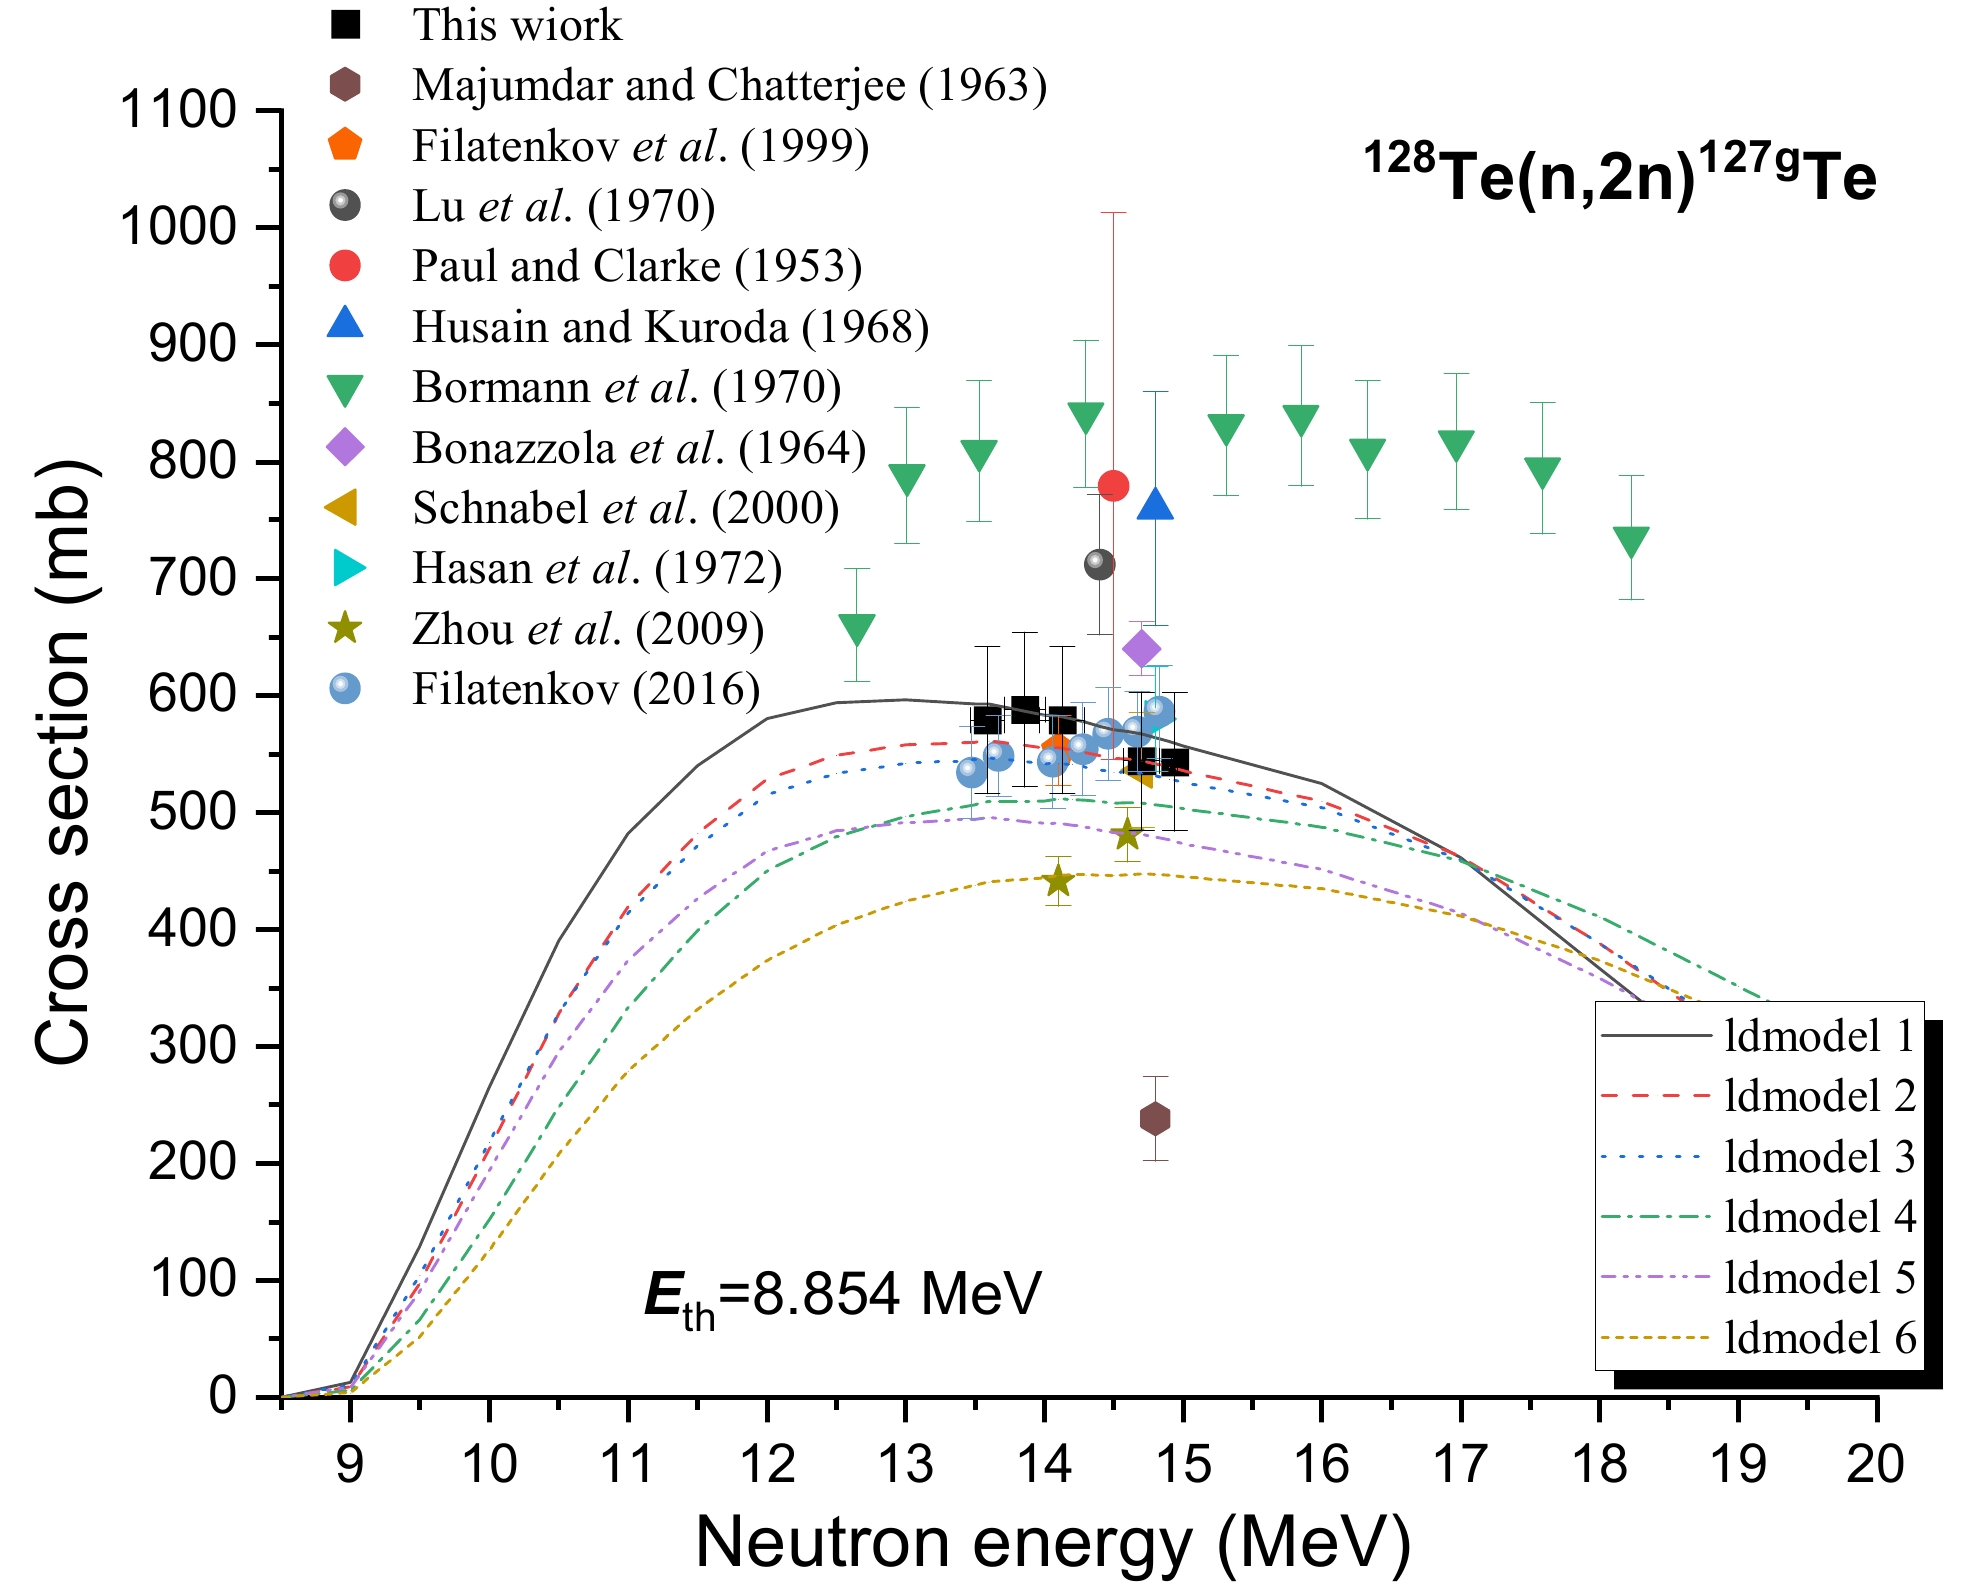
Eleven previous studies gathered cross section data for the 128Te(n, 2n)127gTe reaction [12–14,16-23]. Table 1 shows that six of these studies used gamma counting and two studies used beta counting, and the rest did not provide experimental information (see Table 1). Most early studies employed GeLi and NaI detectors with poor energy resolution. However, rays of similar energy are also influenced near the 417-keV peak based on the gamma-ray spectrum obtained (Figs. 4 and 5). Detectors with less-than-perfect resolution may be indistinguishable. Early experimental results ranged from 240 to 840 mb and were quite distinct. This study used 417.9-keV γ-rays (Iγ=0.99%) emitted during the 127gTe decay to calculate the reaction cross section of 128Te(n, 2n)127gTe. All γ-ray spectrum acquisitions were cooled within 27 h. When computing the ground state cross section using Eq. (3), Eq. (5) subtracts the excited state contribution. Figure 7 depicts the data produced by this study and those produced by the Refs. [14–22] for the 128Te(n, 2n)127gTe reactions along with the TALYS-1.96 computations generated using ldmodels 1-6 (continuous lines). The values obtained in this study are consistent with those of previous reports [16, 18, 19, 21] within the experimental uncertainties in the 13–15 MeV range. However, Majumdar and Chatterjee [22] reported data that were 100% lower than ours, while the result produced by Bormann et al. [14] was about 300 millitargets higher. Paul and Clarke [20] give a value of 779±234 mb, with an uncertainty of 30%. The substantial disparities may be due to different excited state deduction procedures. Thus far, researchers [15] have reported the formation cross sections for the excited state, but not for the ground state.
-
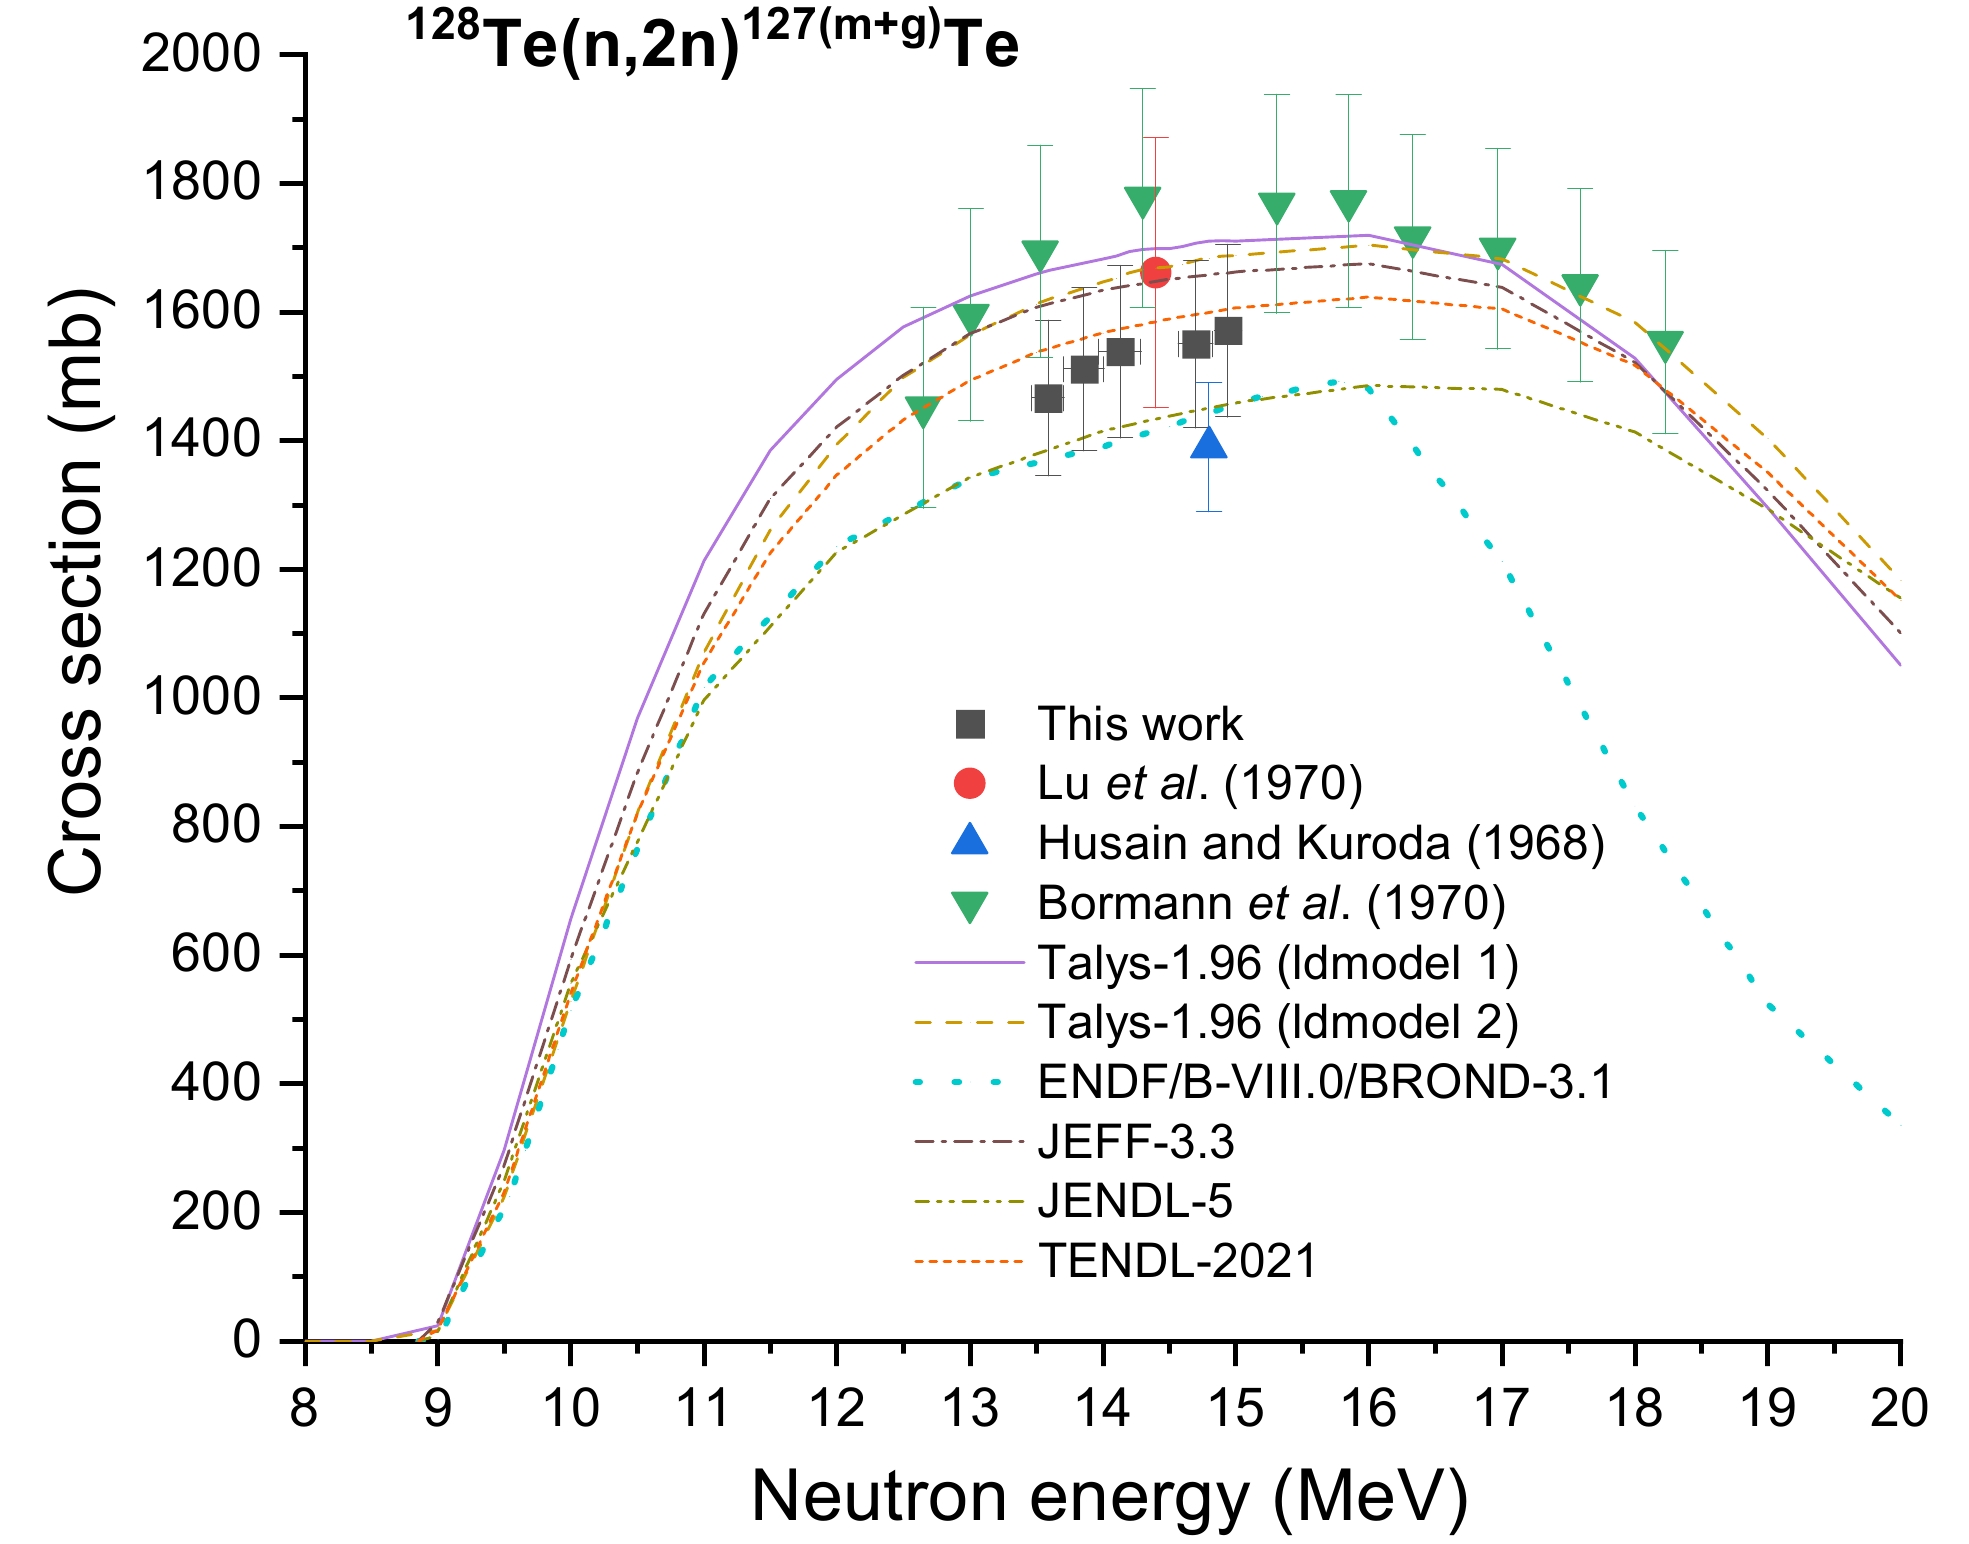
Figure 8 presents the theoretical predictions for the 128Te(n, 2n)127(m+g)Te reaction generated using statistical models and databases, as well as the cross section data produced by this study and by Refs. [12–14]. We found that within the experimental uncertainty, the results obtained in this study in the 13–15 MeV range agree well with previously reported data [12–14] and the TENDL–2021 predictions [30]. However, the findings of Bomann et al. [14], as well as the TALYS-1.96 calculations that utilize ldmodel 1 (with the constant temperature and Fermi gas model), exhibit higher values compared to those reported by Husain and Kuroda [13]. The evaluation data from databases such as ENDF/B-VIII.0 [26], BROND-3.1 [27], and JENDL-5 [29] further support these results.
-
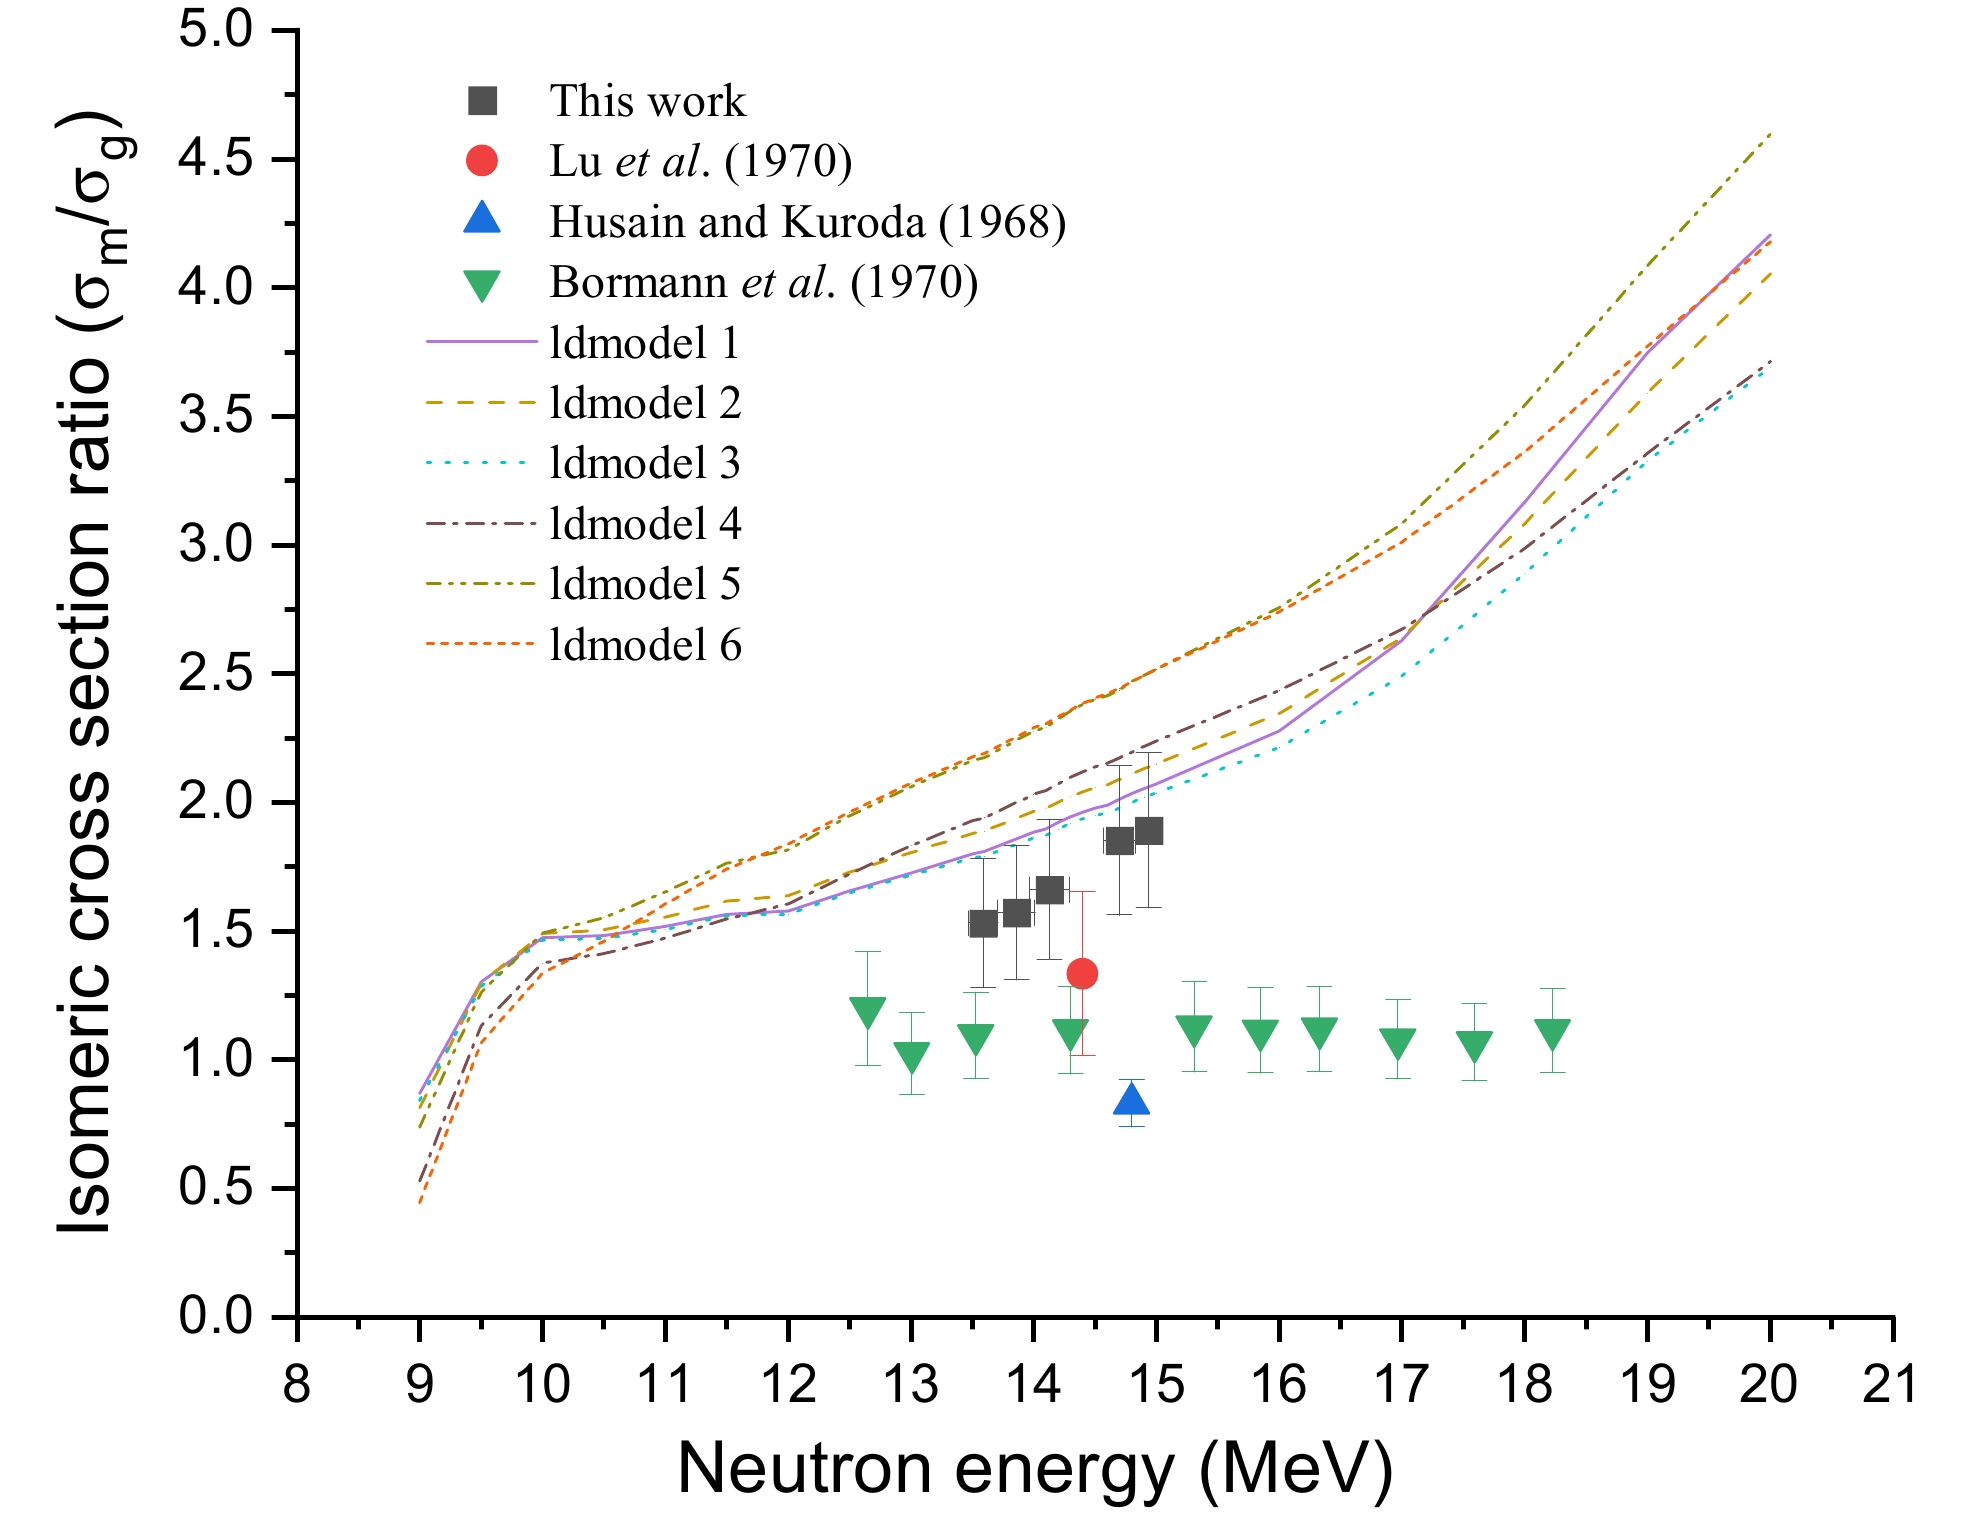
We determined the isomeric cross section ratio σm/σg for the 127m,gTe pair formed during the (n, 2n) reaction on 128Te. Based on the findings, the isomeric cross section ratio for neutron energies of 13.59±0.12, 13.86±0.15, 14.13±0.16, 14.70±0.13, and 14.94±0.02 MeV was 1.53± 0.24, 1.57±0.25, 1.66±0.27, 1.85±0.29, and 1.89±0.30, respectively. The findings of the experiments and the theoretical calculations performed by TALYS-1.96 are presented in Fig. 9. As can be seen from Fig. 9, our data are consistent with the data of Lu et al. [12], but higher than the results of Husain and Kuroda [13] and Bomann et al. [14]. This inconsistency was primarily caused by the inconsistent decay data used in the experiment and/or the different methods used to deal with the interference reaction. The isomeric cross section ratio derived in this study exhibited a modest increase with increasing neutron energy, which is an important finding. In general, in the 14-MeV neutron energy region, the excited state cross section of the (n, 2n) reaction increased as the incident neutron energy increased, while the ground state cross section of the (n, 2n) reaction decreased or increased slowly as the neutron energy increased. According to this effect, the synthesis of the high-spin isomer (11/2–→3/2+) was favored at higher excitation energies. This phenomenon is also found in other neutron- and charged particle-induced reactions that occur close to the threshold values [42–44]. The isomeric cross section ratio increased between 13 and 15 MeV for each of the six individual ldmodels.
-
In this study, secondary nuclear decay was used to measure the cross section of the nuclear reaction 128Te(n, 2n)127mTe. The activation method was used to obtain the cross sections of the 128Te(n, 2n)127m,gTe reactions and the isomeric cross section ratio σm/σg of 127m,gTe at five neutron energies ranging from 13 to 15 MeV. The theoretical nuclear model software TALYS-1.96 was utilized to estimate the excitation function of the neutron energy threshold up to 20 MeV according to six ldmodels. The experimental and theoretically calculated data were compared to the measurement results. We concluded that the difference between the decay data, reasonable disposal of interference reactions, and reasonable arrangement of secondary nuclear decay time factors determined the discrete measurement results, such as the half-life and characteristic gamma-ray intensity. To obtain high-precision cross section data, it was necessary to ensure that these characteristics were accurate. Hence, the new data obtained in this study for the cross sections and isomeric cross section ratio of the nuclear reactions 128Te(n, 2n)127m,gTe are essential for testing nuclear models and determining the crucial parameters.
Measurements of the 128Te(n, 2n)127m,gTe reaction cross sections and isomeric cross section ratio of 127m,gTe at the neutron energy of 14 MeV
- Received Date: 2024-04-07
- Available Online: 2024-12-15
Abstract: In this study, measurements of the 128Te(n, 2n)127m,gTe reaction cross sections and the computation of the isomeric cross section ratio were performed around the neutron energy of 13−15 MeV. We used a γ-ray spectrometric technique to conduct the measurements. The neutron energy was produced by the 3H(d,n)4He reaction. For the 128Te(n, 2n)127m,gTe reaction, the excited state, ground state, total cross section, and isomeric cross section ratio were determined using the TALYS-1.96 code, a theoretical nuclear model that allows for variations in density options. The initial experimental data, assessed nuclear data, and theoretical calculations based on the TALYS-1.96 algorithm were compared with the measurement results. The new data produced by this study are essential for validating nuclear models and establishing parameters for nuclear reactions.


 Abstract
 HTML
HTML Reference
 Related
 PDF
PDF





 DownLoad: