


 Abstract
 HTML
HTML Reference
 Related
 PDF
PDF


-
The strength function for β-transitions,
$ S_{\beta}(E) $ , is one of the most important characteristics of the atomic nucleus [1−6]. It represents the distribution of the squared moduli of β-decay-type matrix elements over nuclear excitation energies E. For energies E up to$ Q_{\beta} $ (total β-decay energy),$ S_{\beta}(E) $ determines the characteristics of β-decay and the half-life$ T_{1/2} $ of a radioactive nucleus with respect to β-decay. At high energies, inaccessible in β-decay,$ S_{\beta}(E) $ determines the cross-sections of various nuclear reactions that depend on β-decay-type matrix elements.The probability of β-decay is proportional to the product of the leptonic part, described by the Fermi function
$ f(Q_{\beta}-E) $ , and the nucleonic part, described by$ S_{\beta}(E) $ . Since the Fermi function decreases rapidly (Fig. 1) with increasing E, the probability of β-transitions at excitation energies E above 3—4 MeV in medium and heavy nuclei can be small. However, from the perspective of nuclear structure and the description of β-decay, the character of$ S_{\beta}(E) $ at excitation energies above 3—4 MeV is most interesting. At$ E \gt 3{-}4 $ MeV, resonances appear in$ S_{\beta}(E) $ , caused by nuclear structure and residual spin-isospin interaction [1−6].
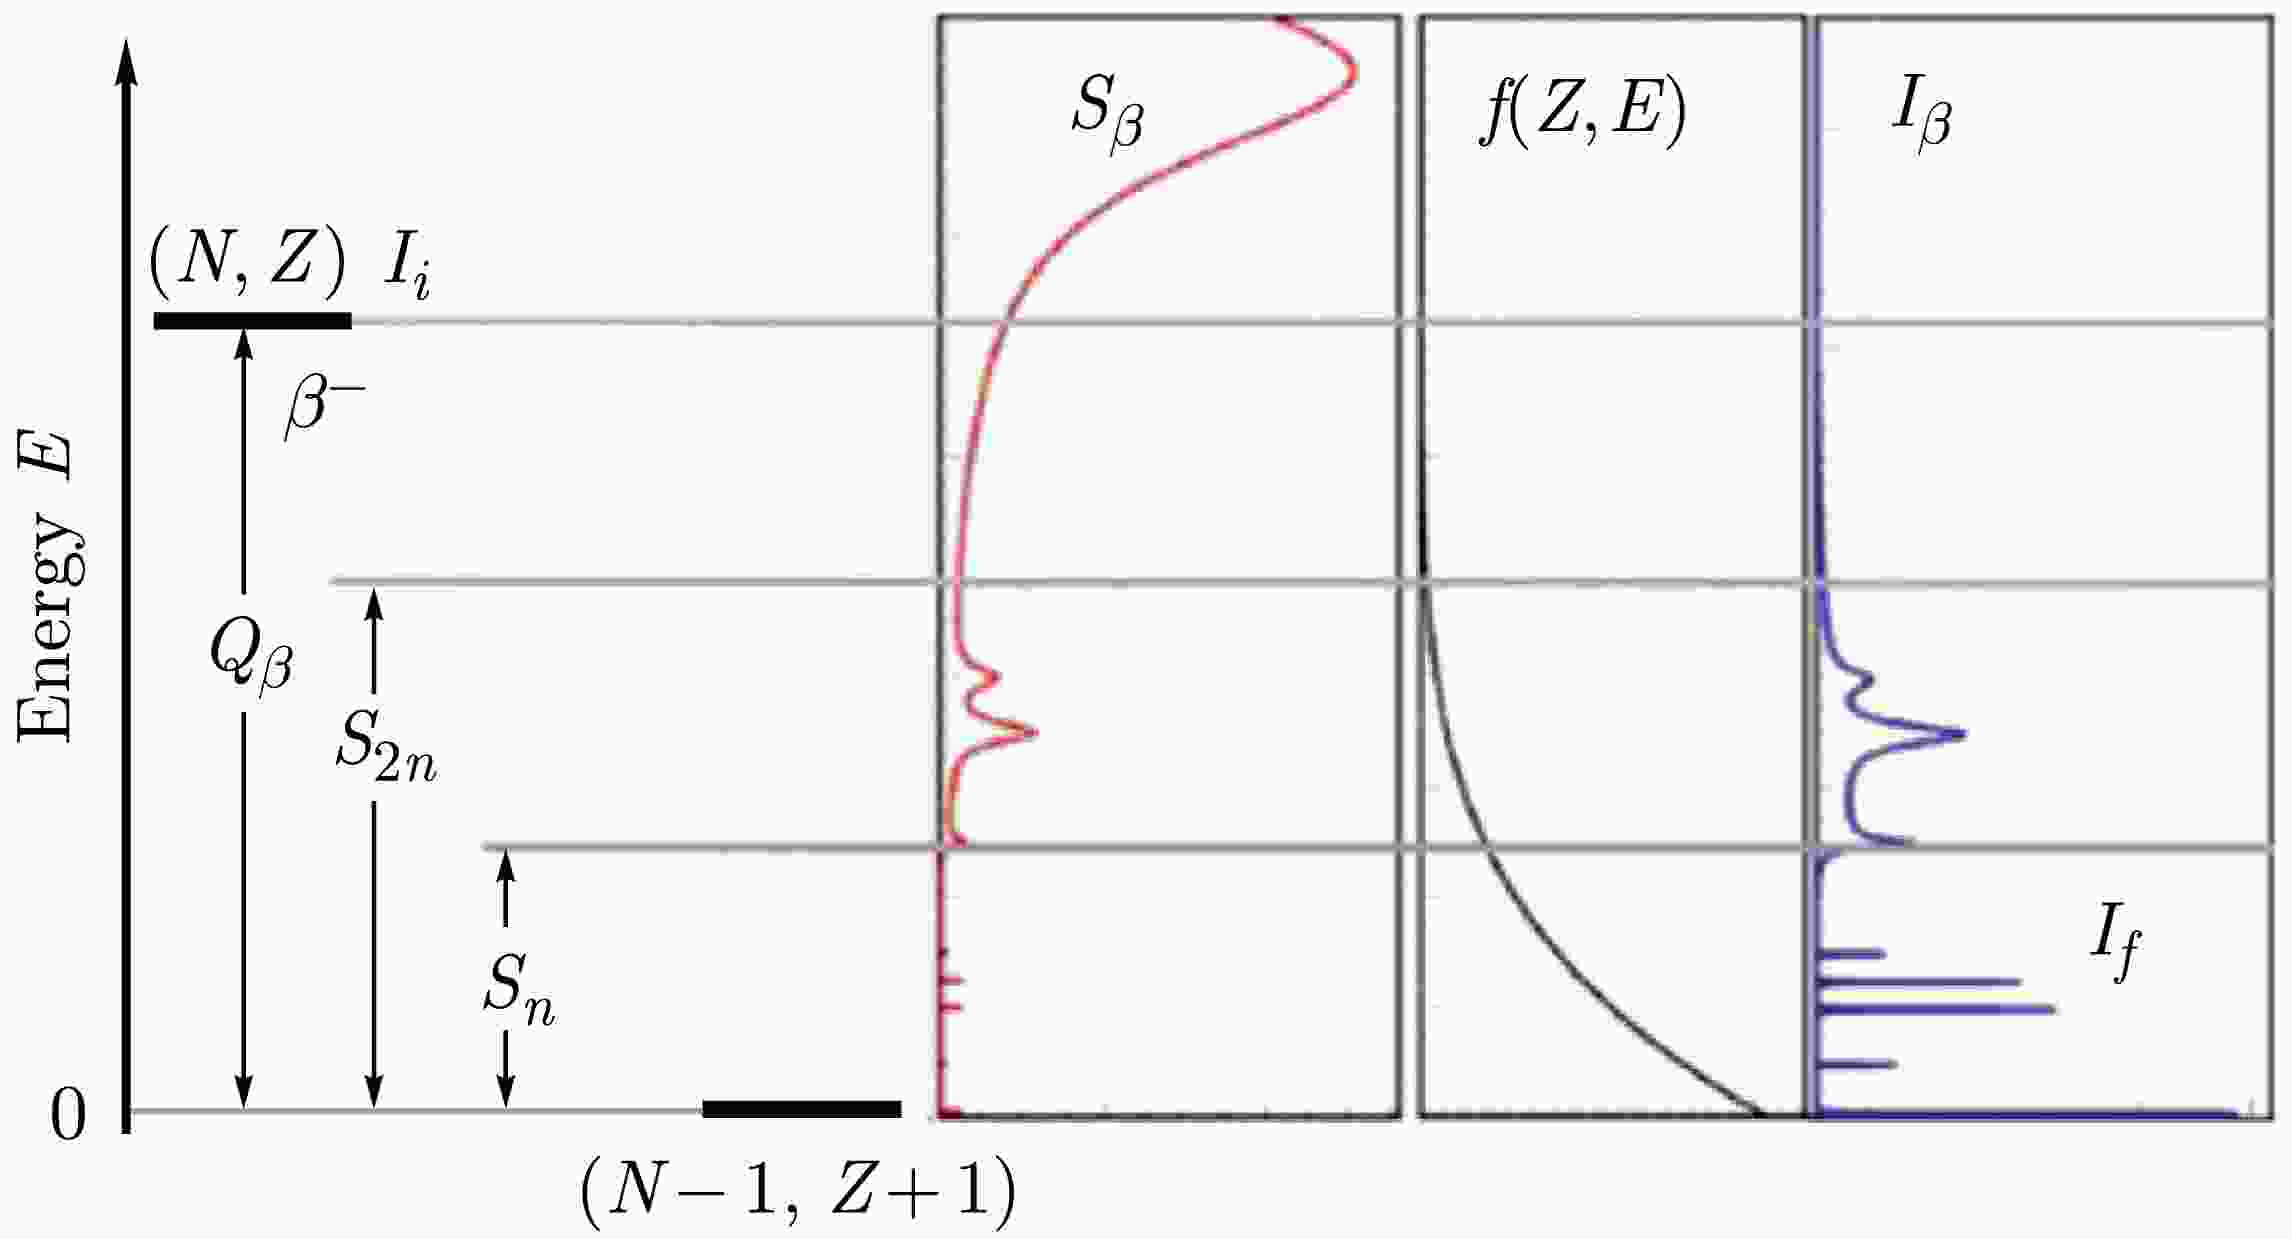
Figure 1. (color online) Diagram of β-decay and its components.
$ S_{\beta} $ is the β-decay strength function,$ f(Z,E) $ is the Fermi function,$ I_{\beta} $ is the level population after β-decay,$ I_{i} $ and$ I_{f} $ are the spins of the initial and final states,$ S_{xn} $ is the separation energy of x neutronsBy measuring level populations following β-decay, one can determine [4, 6, 7] the reduced transition probabilities
$ (1/ft) $ and, consequently, the strength function$ (S_{\beta}(E) \sim 1/ft(E)) $ . Until recently, the structure of$ S_{\beta}(E) $ was studied experimentally using total absorption γ-ray spectrometers and total absorption γ-ray spectroscopy (TAGS) methods [4, 6−11], where γ-rays accompanying β-decay were registered by large$ NaI $ crystals in a$ 4\pi $ -geometry. If the total absorption efficiency for γ-rays is sufficiently high, total absorption peaks can be identified in the spectra, their intensity being determined solely by the probability of level population in β-decay. This method allowed for the experimental demonstration of the resonant structure of$ S_{\beta}(E) $ for Gamow–Teller (GT) β-transitions [4, 6, 7]. However, TAGS methods have several disadvantages related to the low energy resolution of$ NaI $ -based spectrometers. In TAGS spectra, typically only one or two total absorption peaks can be identified; isobaric impurities in the analyzed source often lead to uncertainties; it is impossible to separate Gamow–Teller and first-forbidden (FF) β-transitions; the fine structure of$ S_{\beta}(E) $ cannot be resolved; and some problems often arise during spectrum processing. Therefore, it is important to measure$ S_{\beta}(E) $ using high-resolution γ-spectroscopy methods. Advances in experimental techniques now allow the application of nuclear spectroscopy methods with high energy resolution to study the fine structure of$ S_{\beta}(E) $ [7, 11−15]. Only in recent years, thanks to significant progress in the production of monoisotopic sources and the advent of$ HPGe $ semiconductor γ-detectors combining high energy resolution and adequate efficiency, has it become possible to measure$ S_{\beta}(E) $ with high reliability and high energy resolution. This allows the detailed study of$ S_{\beta}(E) $ at a qualitatively new level [11−15]. It has been shown that high-resolution nuclear spectroscopy methods provide convincing evidence of the resonant structure of$ S_{\beta}(E) $ for both GT and FF β-decays in deformed, spherical, and transitional nuclei. The most comprehensive studies of this kind were performed for several nuclei produced at the$ YASNAPP-2 $ facility in Dubna [11]. Determining$ S_{\beta}(E) $ based on the detection of γ-rays with semiconductor$ HPGe $ detectors provides qualitatively new information on the structure of$ S_{\beta}(E) $ . The standard energy resolution of$ HPGe $ detectors used for measuring γ-ray spectra is no worse than 0.2%. The measured γ-ray spectra, γγt coincidence matrices, and internal conversion electron (ICE) spectra were employed to construct the decay schemes of the nuclei under study. The reduce half-life ($ ft $ ) values and$ S_{\beta}(E) $ were derived from the decay scheme data. We were the first to determine$ S_{\beta}(E) $ and its fine structure using high-resolution nuclear spectroscopy techniques for the$ \beta^{+} $ /EC -decay of the spherical nucleus$ ^{147g} {\rm{Tb}}$ ($ T_{1/2} = 1.6 $ h,$ Q_{\text {EC}} = 4.6 $ MeV), the deformed nucleus$ ^{160g} {\rm{Ho}}$ ($ T_{1/2} = 25.6 $ min,$ Q_{\text {EC}} = 3.3\; $ MeV), the isomer$ ^{160m} {\rm{Ho}}$ ($ T_{1/2} = 5.02 $ h,$ Q_{\text {EC}} = 3346 $ keV), and the transitional nucleus$ ^{156g} {\rm{Ho}}$ ($ T_{1/2} = 56 $ min,$ Q_{\text {EC}} = 5.05 $ MeV). These nuclei were selected for the study because of their sufficiently large total electron capture($ EC $ ) decay energy$ Q_{EC} $ values and half-lives$ T_{1/2} $ , and also because the$ YASNAPP-2 $ facility at JINR (Dubna) enables the efficient production of high-purity monoisotopic radioactive sources of these nuclei [11]. The high-purity monoisotopic sources were produced by combining radiochemistry (element separation from the irradiated target) and mass separation (isotope separation after element separation).The combination of TAGS with high-resolution γ-spectroscopy can be used to construct detailed decay schemes [11, 15]. It has been experimentally shown that for some excitation energies of daughter nuclei, the probability of FF
$ \beta^{+} $ /EC-transitions is comparable to that of GT$ \beta^{+} $ /EC-transitions. High-resolution nuclear spectroscopy methods [11−14] have for the first time experimentally demonstrated the resonant nature of$ S_{\beta}(E) $ for FF β-transitions and revealed the splitting of the peak in$ S_{\beta}(E) $ for GT β-decay of deformed nuclei into two components. This splitting indicates anisotropy in the oscillations of the isovector component of nuclear density.The structure of
$ S_{\beta}(E) $ for halo nuclei was analyzed in [16−21]. The Gamow–Teller resonance (GTR) and resonances in the GT β-decay strength function$ S_{\beta}(E) $ for halo nuclei can have a structure corresponding to an np tango-halo [18, 20]. At sufficiently large neutron excess, resonances in$ S_{\beta}(E) $ can simultaneously have both an$ nn $ Borromean halo component and an$ np $ tango-halo component, forming a so-called mixed halo.One of the consequences of Wigner spin-isospin
$ SU(4) $ symmetry [21, 22] is$ E_{\text{GTR}} = E_{\text{IAR}} $ , where$ E_{\text{GTR}} $ is the GTR energy and$ E_{\text{IAR}} $ is the isobaric analogue resonance (IAR) energy. The effect of$ SU(4) $ symmetry restoration is induced by the residual interaction, which shifts the GTR towards the IAR with increasing$ (N-Z)/A $ . The study of$ S_{\beta}(E) $ for halo nuclei allows demonstration that the value$ Z/N \approx 0.6 $ may correspond to a region of$ SU(4) $ symmetry [21, 22].The theory of GT- and FF-type excitations is still under development, so one can hope for qualitatively new facts and ideas about nuclear structure, as is usually the case when investigating new phenomena and new areas of nuclear physics.
-
Beta-decay of atomic nuclei is a charge exchange process, in which nuclear states with a large fraction of charge-exchange configurations are populated with the greatest intensity. The wavelengths of leptons emitted in β-decay of atomic nuclei are usually large compared to the nuclear size; therefore, the β-transition amplitude can often be considered independent of the position and velocity of nucleons [23, 24]. The parity of nuclear states does not change in allowed β-transitions. Transitions that can be considered within this approximation are called ”allowed β-transitions.” Allowed β-transitions can be divided into two types: Fermi (F) and Gamow–Teller (GT). The operator for Fermi-type β-transitions is independent of the nucleon spin, while for Gamow-Teller type β-transitions it is proportional to the spin operator of the decaying nucleon. The Fermi-type β-transition operator is a component of the total isospin, and the transition matrix element depends only on the isospin quantum numbers of the initial and final nuclear states. In Fermi-type β-transitions, there is no exchange of angular momentum between nucleons and leptons, whereas in GT β-transitions, unit angular momentum is transferred. Thus, the selection rules for nuclear spin are:
$ \Delta I = 0 $ for F β-transitions and$ \Delta I = 0,1 $ ($ 0{-}0 $ transitions are forbidden) for GT β-transitions. For β-decay with a change in the parity of nuclear states or a change in nuclear spin by more than one unit, the allowed matrix elements are zero; therefore, it is necessary to account for the dependence of the β-transition operators on the spatial coordinates and velocities of nucleons. These β-transitions are called "forbidden transitions" and are usually classified by the degree of forbiddenness n (n-forbidden transitions), i.e., by the sum of the powers of nucleon coordinates and velocities appearing in the β-transition operator. The change in parity of nuclear states π is always ∆$ \pi = (-1)^{n} $ . Transitions with multipolarity$ \lambda = n + 1 $ are called "unique n-forbidden transitions."When nuclei undergo β-decay, the Coulomb energy of the electron inside the nucleus is often large compared to the energy of the β-transition
$ \Delta E $ and the electron rest mass (the ξ-approximation). The Coulomb energy is represented by the dimensionless parameter ξ$ \xi = (Ze^{2})/(2Rm_{e}c^{2}) \approx 1.2 ZA^{-1/3}, $
(1) which is a function of the nuclear radius R and charge Z. The conditions of the ξ-approximation (or the Coulomb approximation) are written as
$ \xi \gg \Delta E/m_{e}c^{2}, \quad \xi \gg 1. $
(2) In some cases, the probability of a β-transition can be represented as the product of the leptonic part, described by the Fermi function, and the nuclear part, described by the strength function [4, 6, 11]. The β-transition strength function
$ S_{\beta}(E) $ is singled out only in the following cases: for allowed β-transitions, for FF transitions in the ξ-approximation, and for unique n-forbidden transitions.The strength function
$ S_{\beta}(E) $ governs the distribution over nuclear excitation energy (E) of elementary charge-exchange excitations and their combinations, such as proton particle$ (\pi p) $ –neutron hole$ (\nu h) $ coupled to angular momentum$ J^{\pi} $ :$ [\pi p \otimes \nu h]_{{J}^{\pi}} $ and neutron particle$ (\nu p) $ –proton hole$ (\pi h) $ coupled to angular momentum$ J^{\pi} $ :$ [\nu p\otimes \pi h]_{{J}^{\pi}} $ . The strength function for Fermi-type β-transitions accounts for excitations$ [\pi p \otimes \nu h]_{{0}^{+}} $ or$ [\nu p \otimes \pi h]_{{0}^{+}} $ . Since isospin is a reasonably good quantum number, the strength of Fermi-type β-transitions is concentrated in the IAR region. The strength function for Gamow–Teller type β-transitions describes excitations$ [\pi p \otimes \nu h]_{{1}^{+}} $ or$ [\nu p \otimes \pi h]_{{1}^{+}} $ . For FF β-transitions in the ξ-approximation, significant configurations are$ [\pi p \otimes \nu h]_{0^{-},\,1^{-}} $ or$ [\nu p \otimes \pi h]_{0^{-},\,1^{-}} $ . Residual interaction can cause collectivization of these configurations and lead to the emergence of resonances in$ S_{\beta}(E) $ . The positions and intensities of resonances in$ S_{\beta}(E) $ are calculated within various microscopic models [7, 24]. From a macroscopic viewpoint, resonances in the GT β-decay strength function are associated with oscillations of spin-isospin density without change in nuclear shape [4, 11, 14].Level population after β-decay
$ I(E) $ , half-life$ T_{1/2} $ , and$ ft $ values are related to$ S_{\beta}(E) $ by the following equations [4, 21, 22]:$ d(I(E))/dE = S_{\beta}(E)\,T_{1/2}\,f(Q_{\beta} - E), $
(3) $ (T_{1/2})^{-1} = \int S_{\beta}(E)\,f(Q_{\beta} - E)\,dE, $
(4) $ \int\limits_{\Delta E} S_{\beta}(E)\,dE = \Sigma_{\Delta E} 1/(ft), $
(5) where
$ S_{\beta}(E) $ is represented in units of MeV$ ^{-1}\,\cdot\, $ s−1, and$ ft $ —is in seconds.The reduced probabilities of GT transitions
$ B({\text{GT}}, E $ ) are related [4, 21–23] to$ ft $ ,$ g_{V} $ and$ g_{A} $ values as$ B^{\pm} ({\text{GT}}, E) = ((g_{A{\text{eff}}})^{2}/4\pi) |\langle I_{f} || \Sigma t_{\pm}(k)\sigma (k) || I_{i}\rangle|^2/(2I_{i} + 1), $
(6) $ B^{\pm} ({\text{GT}}, E) = [D(g^{2}_{V}/4\pi)]/ft, $
(7) and for FF transitions, as
$ [B(\lambda^{\pi} = 2^-)] = 3/4Dg^{2}_{V}/(4\pi \cdot ft), $
(8) $ [B(\lambda^{\pi} = 0^-) + B(\lambda^{\pi} = 1^-)] = Dg^{2}_{V}/(4\pi \cdot ft), $
(9) where
$ I_{i} $ and$ I_{f} $ are the spins of the initial and final states;$ g_{A} $ and$ g_{V} $ are the axial-vector and vector constants of β-decay;$ D = (6144\pm 2) $ s;$ t_{\pm}(k)\sigma(k) $ is the product of isospin and spin operators, giving the corresponding GT β-transition operators;$ ft $ is the reduced half-life for β-decay to a level with excitation energy E;$ \langle I_{f} || \Sigma t_{\pm}(k) \sigma (k) || I_{i} \rangle $ is the reduced nuclear matrix element for the GT transition.The conserved vector current (CVC) hypothesis and the partially conserved axial-vector current (PCAC) hypothesis yield a value for the free nucleon [25]
$ g_{A{\text{free}}}/g_{V} = -1.2723(23) $ . Within nuclear matter, an effective value$ g_{A{\text{eff}}} $ is necessary to reproduce experimental observations. Accurate information on the magnitude of$ g_{A{\text{eff}}} $ is crucial [25] for predicting β-decay half-lives, and the beta-decay strength function for GT and FF β-transitions. The effective value$ g_{A{\text{eff}}} $ is characterized by a renormalization factor q (in the case of quenching of$ g_{A} $ , it is called the “quenching factor”):$ q=g_{A{\text{eff}}}/g_{A{\text{free}}} $ , where$ g_{A{\text{eff}}} $ is the axial-vector coupling value obtained from a given theoretical or experimental analysis. Experimental methods for determining the quenching factor can have significant uncertainties in many cases [25]. One model-independent method for determining$ g_{A{\text{eff}}} $ [21, 22, 25] is comparing the experimental total GT beta-decay strength with the Ikeda sum rule. To apply this method, it is necessary to have the total GT strength within the energy window allowed for β-decay, and contributions from non-nucleonic degrees of freedom (e.g., ∆-isobars) can be neglected. Such a situation may be realized [21, 22] for β-decay of halo nuclei (6He, 11Li) or for very neutron-rich nuclei where the GT resonance energy$ E_{\text{GTR}} $ is less than the isobaric analogue resonance energy$ E_{\text{IAR}} $ .It is well known that the total GT strength satisfies the Ikeda sum rule, which is written as
$ S^--S^+ = 3(N-Z), $
(10) $ S^{\pm} = \Sigma_{f} | \langle I_{f} || \Sigma\, t_{\pm}(k)\, \sigma (k) || I_{i} \rangle |^{2}/(2I_{i} + 1), $
(11) $ \Sigma_{j}\,B^-({\text{GT}},E_{j}) - \Sigma_{k} \,B^+({\text{GT}},E_{k}) = 3(N-Z)(g_{A{\text{eff}}})^{2}/4\pi, $
(12) where
$ B^{-}({\text{GT}}, E_{j}) $ and$ B^{+}({\text{GT}}, E_{k}) $ are determined from Eq. (6) for charge-exchange processes of the GT type and from Eq. (7) for the GT$ \beta^{-} $ or$ \beta^{+} $ /EC-decay. When$ S^{+} \approx 0 $ or$ S^{+} \ll S^{-} $ , for the$ \beta^{-} $ -decay, one obtains$ \Sigma j\ D/ft_{j} = 3(N-Z) (g_{A{\text{eff}}}/g_{V})^{2}, $
(13) and from
$ \beta^{-} $ -decay data, one can estimate for mother nucleus the ratio ($ g_{A{\text{eff}}}/g_{V})^{2} $ or the quenching factor$ q_{\text{GT}} $ .A level scheme significant for analyzing strength functions for Gamow–Teller transitions is shown in Fig. 2. In
$ \beta^{+}/ $ EC-decay of nuclei with$ N \gt Z $ , for isospin binding ($ \tau = 1 $ ,$ \mu_{\tau} = +1 $ ) configurations$ [\nu p \otimes \pi h]_{{1}^{+}} $ with the isospin of the neutron excess$ T_{0} $ there is only one isospin value$ T_{0} + 1 $ . The most collective state formed by$ [\nu p \otimes \pi h]_{{1}^{+}} $ excitations, characterized by isospin$ \tau = 1 $ and isospin projection$ \mu_{\tau} = + 1 $ , is also called [4] the$ \mu_{\tau} = +1 $ GT resonance. For$ \beta^{-} $ -decay of nuclei with$ N \gt Z $ , the GT resonance ($ \tau = 1 $ ,$ \mu _{\tau} = -1 $ ) lies (Fig. 2) in the IAR excitation region, the GTR energies usually exceed$ Q_{\beta} $ , and GTR is typically energetically inaccessible for population in$ \beta^{-} $ -decay, but the$ \mu_{\tau} = +1 $ GT resonance can be populated by$ \beta^{+}/ $ EC-decay [4, 6, 11]. In nuclei with$ Z \gt N $ , the situation for$ \beta^{-} $ - and$ \beta^{+} $ /EC-decays is reversed.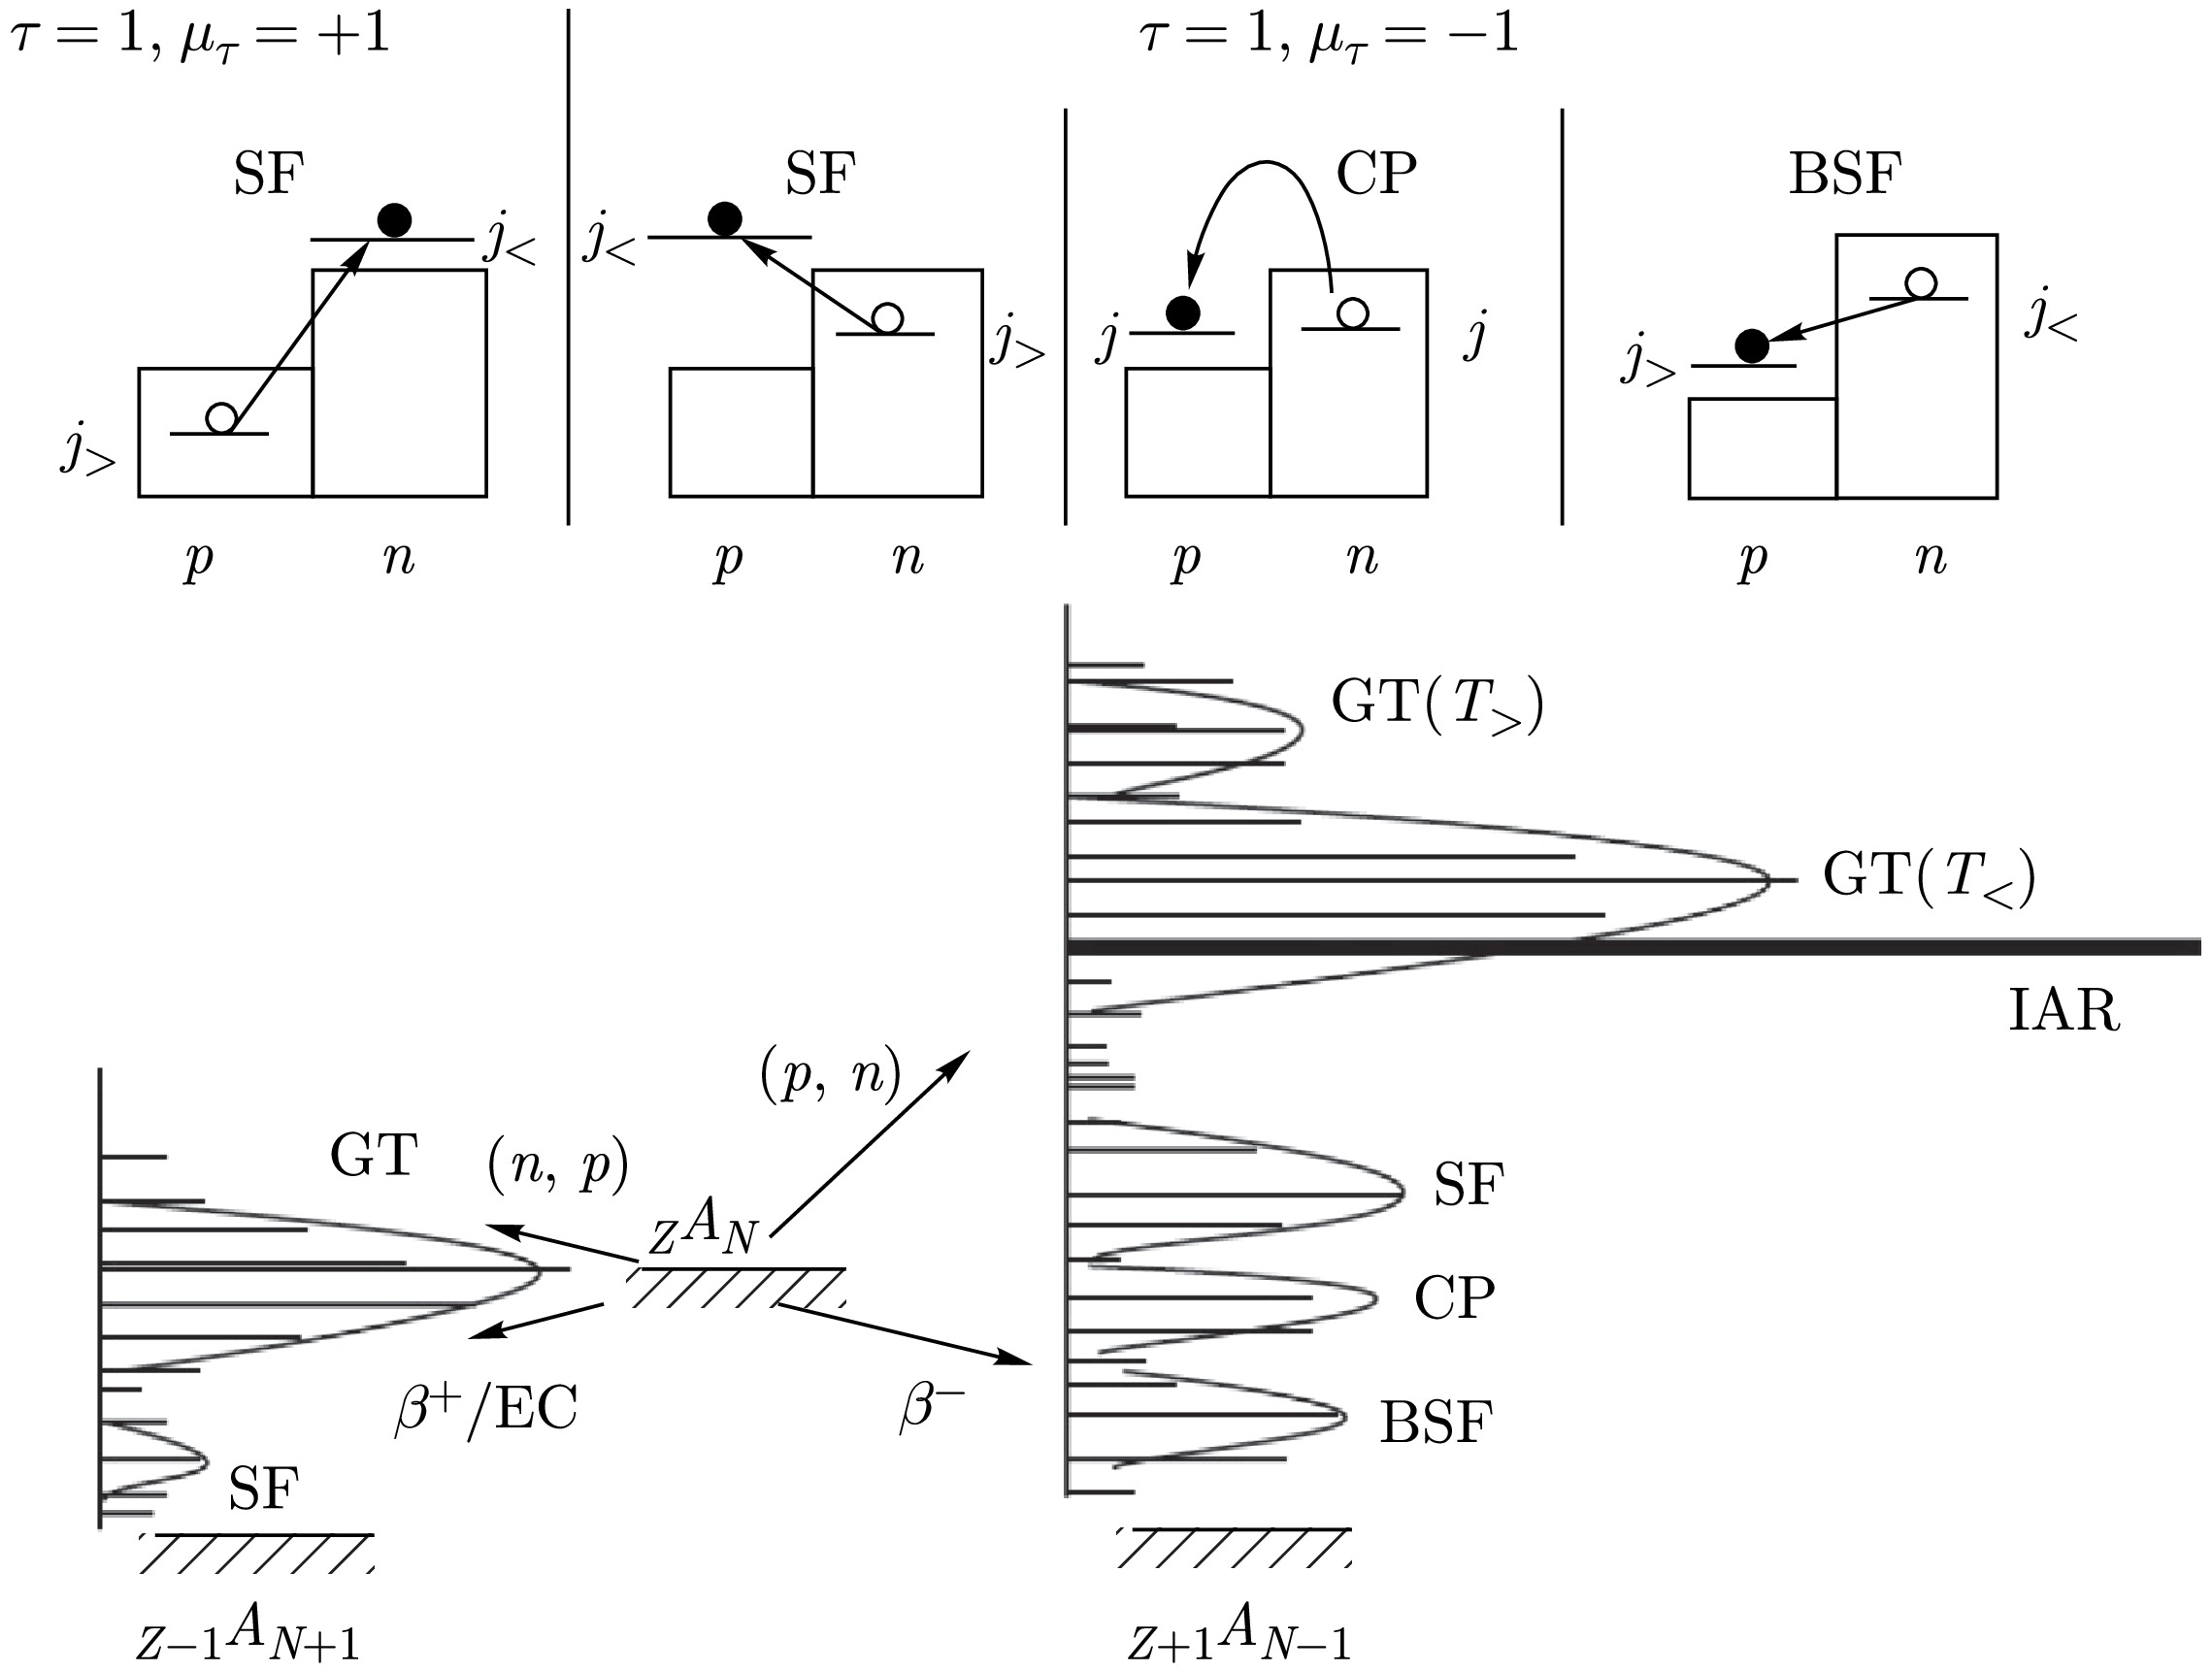
Figure 2. Diagram of
$ S_{\beta}(E) $ for GT β-decays and configurations that form resonances in$ S_{\beta}(E) $ for GT β-transitions and charge-exchange reactions. SF – the spin-flip configurations, CP – the core polarization configurations, and BSF – the back spin-flip configurations. The strength of the Fermi type transitions is concentrated in the IAR regionStrength functions for
$ \beta^{-} $ and$ \beta^{+}/ $ EC-transitions are qualitatively different, which manifests primarily in the total sum of$ \beta^{-} $ and$ \beta^{+}/ $ EC-transitions. According to sum rule Eq. (10) for nuclei with$ N \gt Z $ , the total sum of$ \beta^{-} $ -transitions is substantially larger than that of$ \beta^{+}/ $ EC-transitions. However, this does not mean that the reduced half-lives log$ ft $ for$ \beta^{-} $ and$ \beta^{+}/ $ EC-transitions between low-lying states must differ greatly. From the scheme in Fig. 1, it is clear that not all states contributing to the total sums$ S^{\pm} $ fall within the energy window$ E \lt Q_{\beta} $ in$ \beta^{-} $ and$ \beta^{+}/ $ EC-decays. It is known [4, 6, 11] that for nuclei with$ N \gt Z $ , more than 90% of the total GT strength for$ \beta^{-} $ -transitions is concentrated in the Gamow-Teller resonance, which is generally located much higher in excitation energy than the total$ \beta^{-} $ -decay energy$ Q_{\beta} $ (Figs. 1 and 2), meaning that the strengths corresponding to the total sums$ S^{-} $ and$ S^{+} $ can be comparable in the low excitation energy region. Differences in the strength functions for$ \beta^{-} $ and$ \beta^{+}/ $ EC-decay only weakly affect the probabilities of$ \beta^{-} $ and$ \beta^{+}/ $ EC-transitions in nuclei near the β-stability line. These differences become more pronounced as one moves away from the β-stability line and the total beta-decay energy$ Q_{\beta} $ increases.The previously dominant statistical model assumed that there are no resonances in
$ S_{\beta}(E) $ , and the relations$ S_{\beta}(E) = {\text{const}} $ or$ S_{\beta}(E) \sim \rho (E) $ , where$ \rho(E) $ is the level density of the daughter nucleus, were considered good approximations for medium and heavy nuclei [26]. Studies of beta-delayed processes and experiments measuring$ S_{\beta}(E) $ using total absorption γ-ray spectroscopy (TAGS) unambiguously revealed the non-statistical character of$ S_{\beta}(E) $ for GT-type β-decay and stimulated the development of microscopic models that allow using atomic nuclear structure to calculate$ S_{\beta}(E) $ [4, 6, 7]. The next step was taken [11−14] by applying high-resolution nuclear spectroscopy techniques to study the fine structure of$ S_{\beta}(E) $ . These techniques allowed unambiguous demonstration of the resonant structure of$ S_{\beta}(E) $ not only for GT transitions but also for FF β-transitions [11−13]. It has been experimentally shown that for some excitation energies of daughter nuclei, the probability of FF$ \beta^{+} $ /EC-transitions is comparable to that of GT$ \beta^{+} $ /EC-transitions. It is precisely due to high-resolution spectroscopy techniques that the resonant structure of$ S_{\beta}(E) $ for FF transitions was first revealed [11−13]. High-resolution nuclear spectroscopy methods allowed observation of the splitting of the resonance in$ S_{\beta}(E) $ for$ \beta^{+} $ /EC-decay of deformed nuclei into two components. This splitting indicates anisotropy in oscillations of the isovector density in deformed nuclei [11, 14].The theoretical description of the beta-transition strength function structure at the microscopic level is closely related to the analysis of astrophysical and thermonuclear processes, the description of log
$ ft $ for β-transitions between low-lying states of atomic nuclei, analysis of delayed processes, study of charge-exchange processes, and other problems of nuclear physics [1−6, 11]. Some of the first calculations of the microscopic structure of$ S_{\beta}(E) $ for GT β-transitions, accounting for shell effects and residual spin-isospin interaction and allowing explanation of delayed fission, were performed in [1−4]. Currently, existing theory allows sufficiently correct calculation of positions and relative intensities of peaks in strength functions for Gamow–Teller transitions [7, 11, 24]. Even for spherical nuclei, the deviation of calculated absolute intensities of strength function peaks from their experimental counterparts ranges from several tens to several hundred percent; theory predicts more intense peaks than observed experimentally [4, 6, 7, 24, 25].Strong configuration mixing at high excitation energies and high level densities should lead to the disappearance of resonant structure in strength functions
$ S_{\beta}(E) $ . Approximate symmetry of nuclear interaction hinders mixing of some configurations. For configurations populated by GT$ \beta^{-} $ and$ \beta^{+} $ /EC-transitions, mixing is weaker due to partial spin-isospin$ SU(4) $ symmetry of the interaction within the nucleus [4, 6, 11, 21, 22]. For FF$ \beta^{-} $ and$ \beta^{+} $ /EC-transitions, resonant structure is also observed in the strength function$ S_{\beta}(E) $ [11−13]. Resonant structure in the strength function for FF$ \beta^{-} $ and$ \beta^{+} $ /EC-transitions may indicate partial symmetry of the interaction in the nucleus corresponding to the first forbiddenness. This means that configurations populated by FF transitions are also distinguished by approximate quantum numbers among neighboring levels of the daughter nucleus, and strong configuration mixing does not occur. -
The Fermi function
$ f(Q_{\beta}-E) $ decreases with increasing excitation energy E, and, as a rule (Fig. 1), more intense β-decays populate levels with low (less than 2—3 MeV) excitation energies. But from the perspective of nuclear structure, β-transitions populating levels with high (more than 2—4 MeV) excitation energies are most interesting, where resonances or their ”tails” can be observed in$ S_{\beta}(E) $ . To obtain information about the structure of$ S_{\beta}(E) $ , it is necessary to measure level populations after β-decay. The TAGS method for direct measurement of level population probabilities in β-decay was proposed in [27]. The principle of this method is that γ-rays accompanying β-decay are registered by a large$ NaI $ crystal in almost$ 4\pi $ -geometry. If the total absorption efficiency for γ-rays is sufficiently high, the pulse amplitude in such a total absorption γ-ray spectrometer (TAGS) is determined by the total energy of the γ-rays, i.e., the energy of the level populated by the β-transition. Special measures are needed to protect the crystals from β-particles. However, the constructed spectrometer [27] has a solid angle of about 80%, and the efficiency of the total absorption peak registration for a cascade of γ-rays depends on the γ-transition scheme and the number of γ-rays in the cascade (multiplicity). Application of the first total absorption spectrometers [27] did not allow the authors to identify the non-statistical resonant character of$ S_{\beta}(E) $ . As a result, it was erroneously assumed that both β-decay and γ-deexcitation of levels are statistical in nature, and some observed "resonances" were interpreted as statistical fluctuations. Considering the fundamental importance of direct measurement of β-decay strength functions, conditions for the possibility of using TAGS to obtain β-transition strength functions over a wide range of excitation energies were formulated in [4, 6]. Based on this analysis, a spectrometer with practically$ 4\pi $ -geometry (Fig. 3) was built and successfully used to demonstrate the resonant structure of$ S_{\beta}(E) $ [4, 6, 7, 11]. Results of some first successful applications of the TAGS spectrometer for measuring the resonant structure of$ S_{\beta}(E) $ are summarized in [4, 6, 7, 11, 28].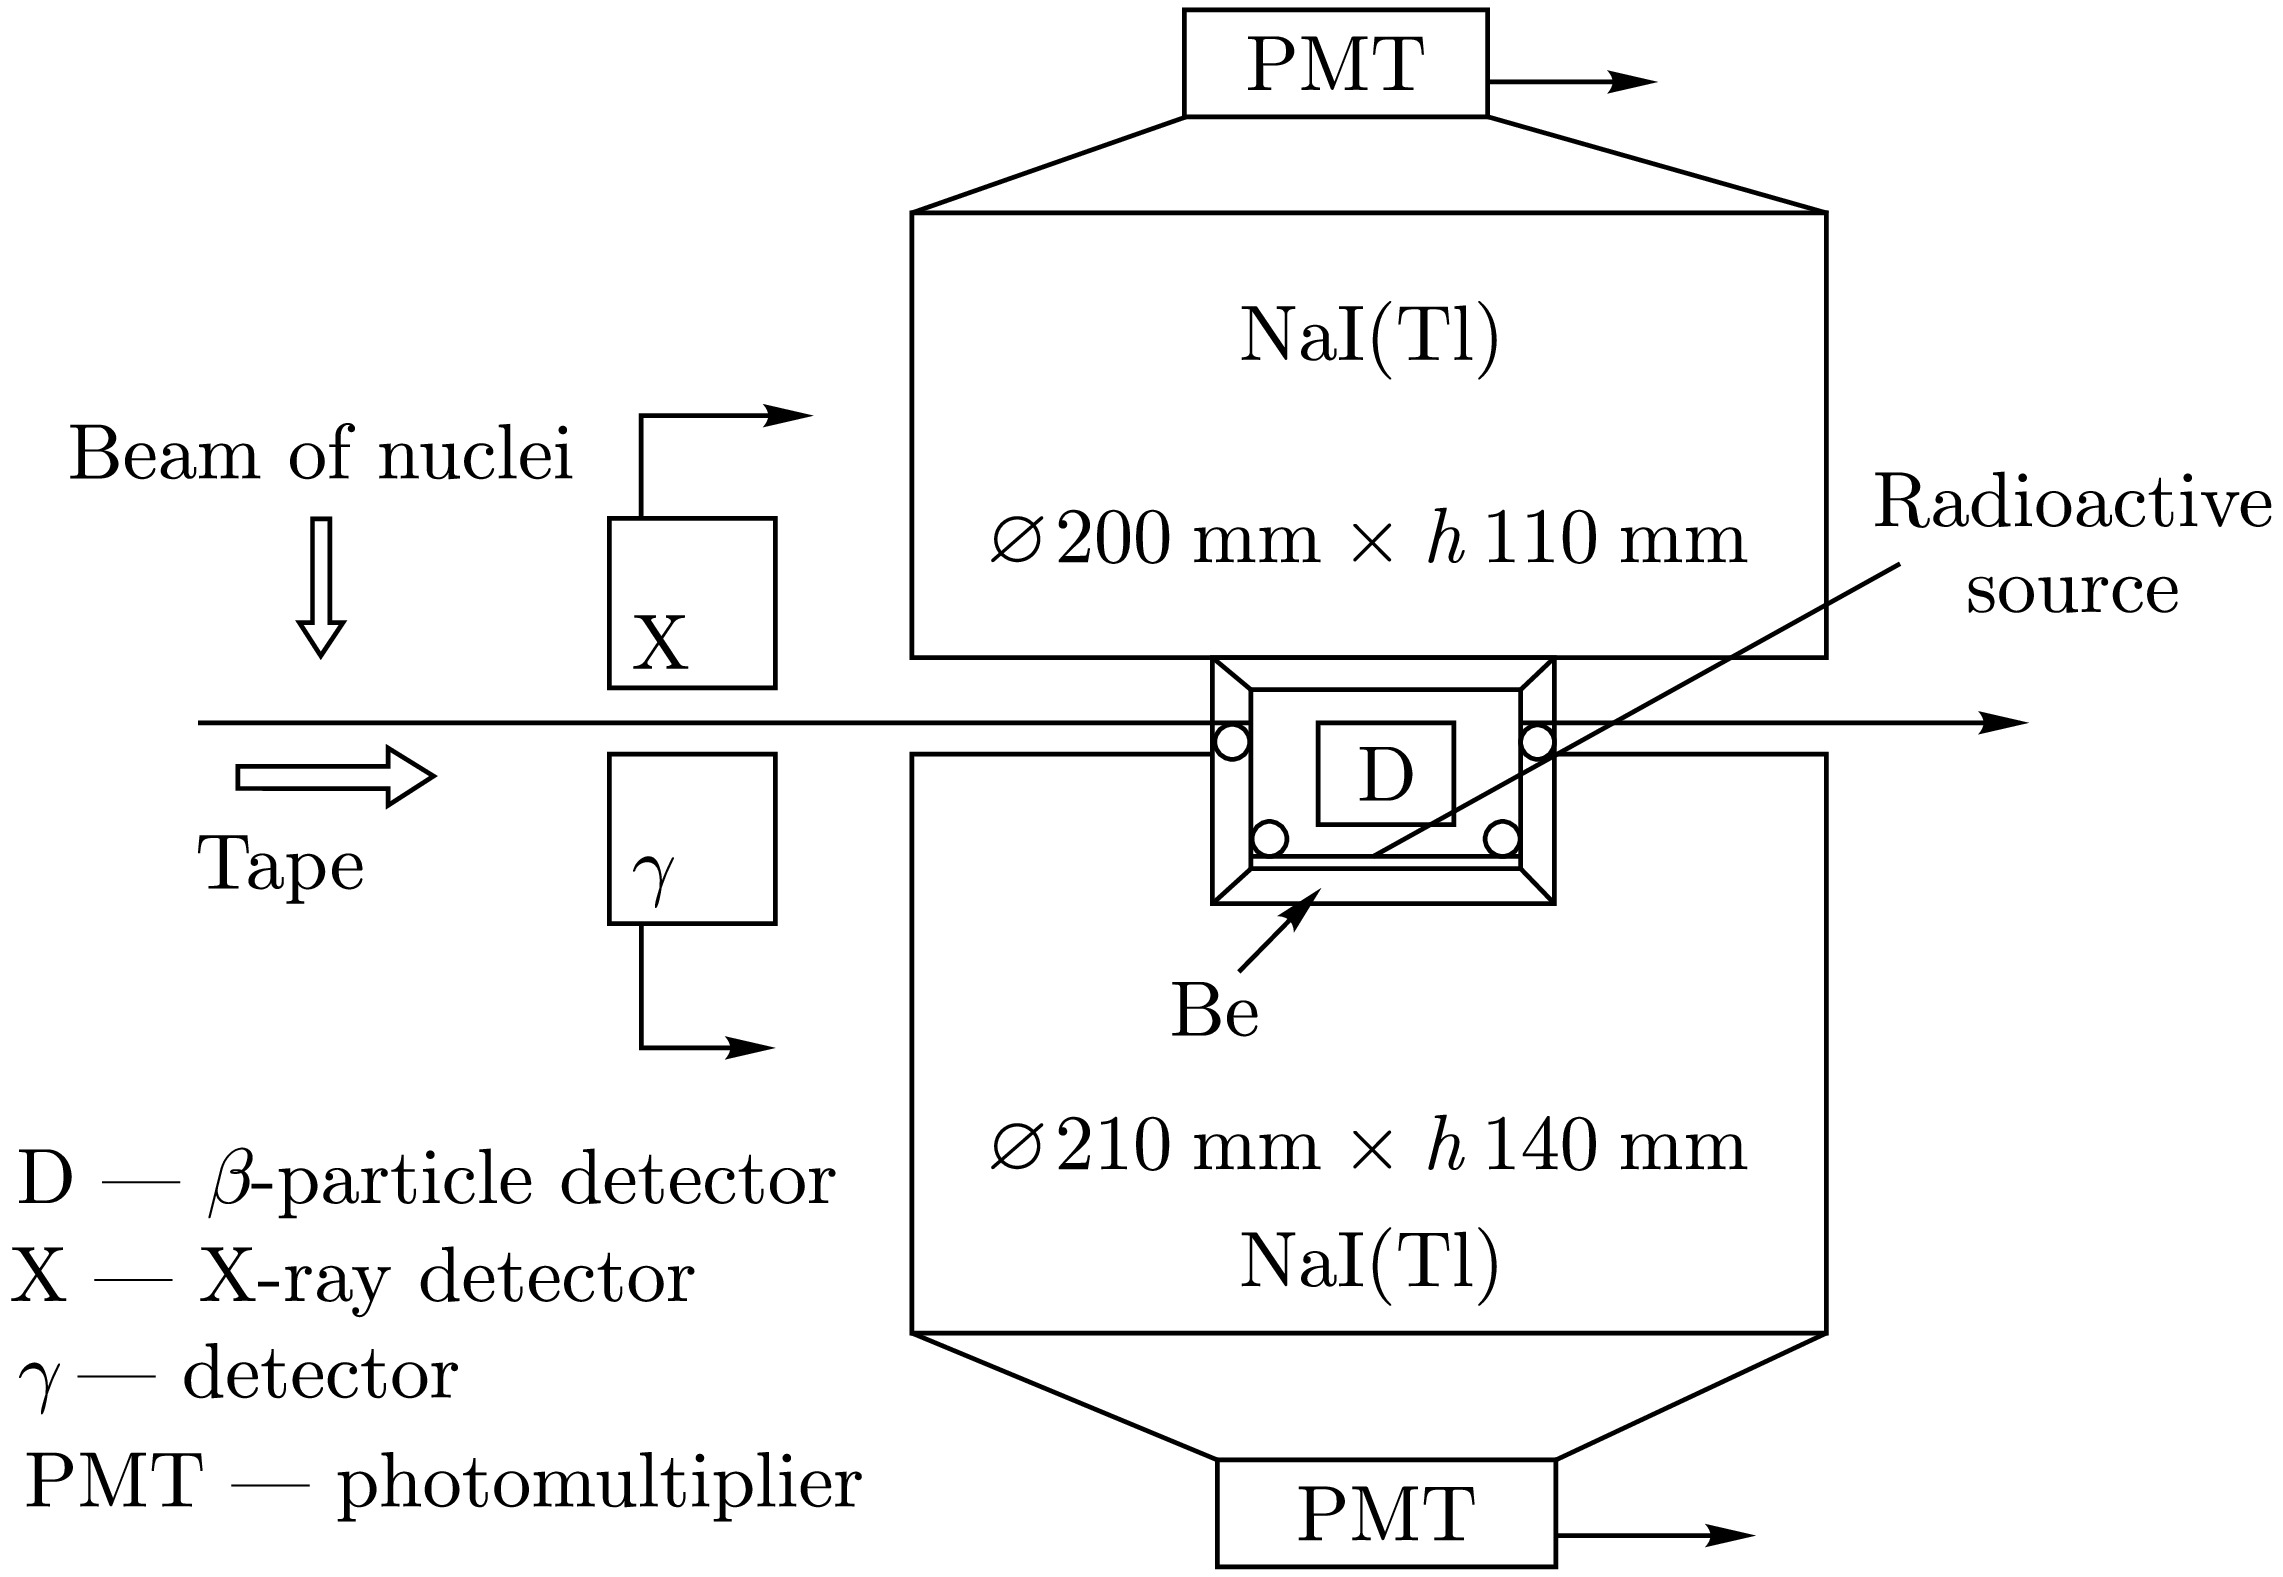
It was found [4, 6, 11] that the total absorption efficiency
$ \varepsilon_{\text{tot}} $ is exponentially dependent in the energy range of 0.1–4.5 MeV on the total cascade γ-transition energy$ E\gamma $ :$ \varepsilon_{\text{tot}} = \exp\,(-\alpha E\gamma), \quad \alpha = 0.78(3)\; {\text {MeV}}^{-1}. $
(14) If Eq. (14) holds, the intensity of the total absorption peak of a γ-ray cascade is proportional to the probability of population of a specific level in the daughter nucleus in β-decay and does not depend on the decay scheme. Indeed, if we have a deexcitation scheme for a level with energy E populated in β-decay, then, if Eq. (14) is satisfied, the total absorption peak efficiency for a cascade of N γ-rays with total energy
$ E = E\gamma_{1} + \ldots + E\gamma_{N} $ is determined as$ \begin{aligned}[b] \varepsilon_{\text{tot}}(E) =\;& \exp(-\alpha E\gamma_{1}) \times \ldots \times \exp\,(-\alpha\; E\gamma_{N}) \\ =\;& \exp(-\alpha (E_{\gamma 1} + \ldots E\gamma_{N})) = N\,\exp\,(-\alpha E) \end{aligned} $
(15) and does not depend on the γ-transition scheme. Conversion of γ-radiation (emission of conversion electrons (CE)) introduces a systematic error into total absorption spectrum analysis, and this error can be difficult to account for. The validity of Eq. (14) is essentially important for TAGS and requires experimental verification. It is also important that the TAGS spectrometer maintains
$ 4\pi $ -geometry. Indeed, if the registration solid angle Ω for a cascade of N γ-rays differs from$ 4\pi $ , the total absorption efficiency will be determined not by Eq. (15) but by the relation$ \varepsilon_{\text{tot}}(E) = (\Omega/4\pi)^{N} \exp\,(-\alpha E), $
(16) i.e., it will strongly depend on the decay scheme (multiplicity N).
Until recently, experimental studies of the structure of
$ S_{\beta}(E) $ were conducted using total absorption gamma-ray spectrometers (TAGS) and total absorption spectroscopy methods, which had low energy resolution. Using TAGS spectroscopy, it became possible [4, 6, 7, 11] to experimentally demonstrate the non-statistical resonant structure of$ S_{\beta}(E) $ for Gamow–Teller β-transitions (Fig. 4–6). There are two methods for analyzing TAGS spectra. In the first [4, 7, 11], it is necessary to identify total absorption peaks in TAGS spectra and have a$ 4\pi $ -spectrometer with exponential dependence of total absorption efficiency on γ-ray energies for γ-ray registration. Only in this case does the TAGS peak registration efficiency not depend on the details of the decay scheme. This method gives good results but can be applied to nuclei with total β-decay energy$ Q_{\beta} $ less than 5—6 MeV. Quantitative characteristics can generally be obtained only for one peak ($ \beta^{-} $ -decay) and for two peaks ($ \beta^{+} $ /EC-decay) in$ S_{\beta}(E) $ .
Figure 4. TAGS spectra of γ-rays from the
$ \beta^{+} $ /EC-decay of$ ^{147g} {\rm{Tb}}$ measured by TAGS in coincidence with$ \beta^{+} $ -particles (a) and without coincidence (b). The arrow points to the total electron capture energy$ Q_{\text {EC}} $ for$ ^{147g} {\rm{Tb}}$ 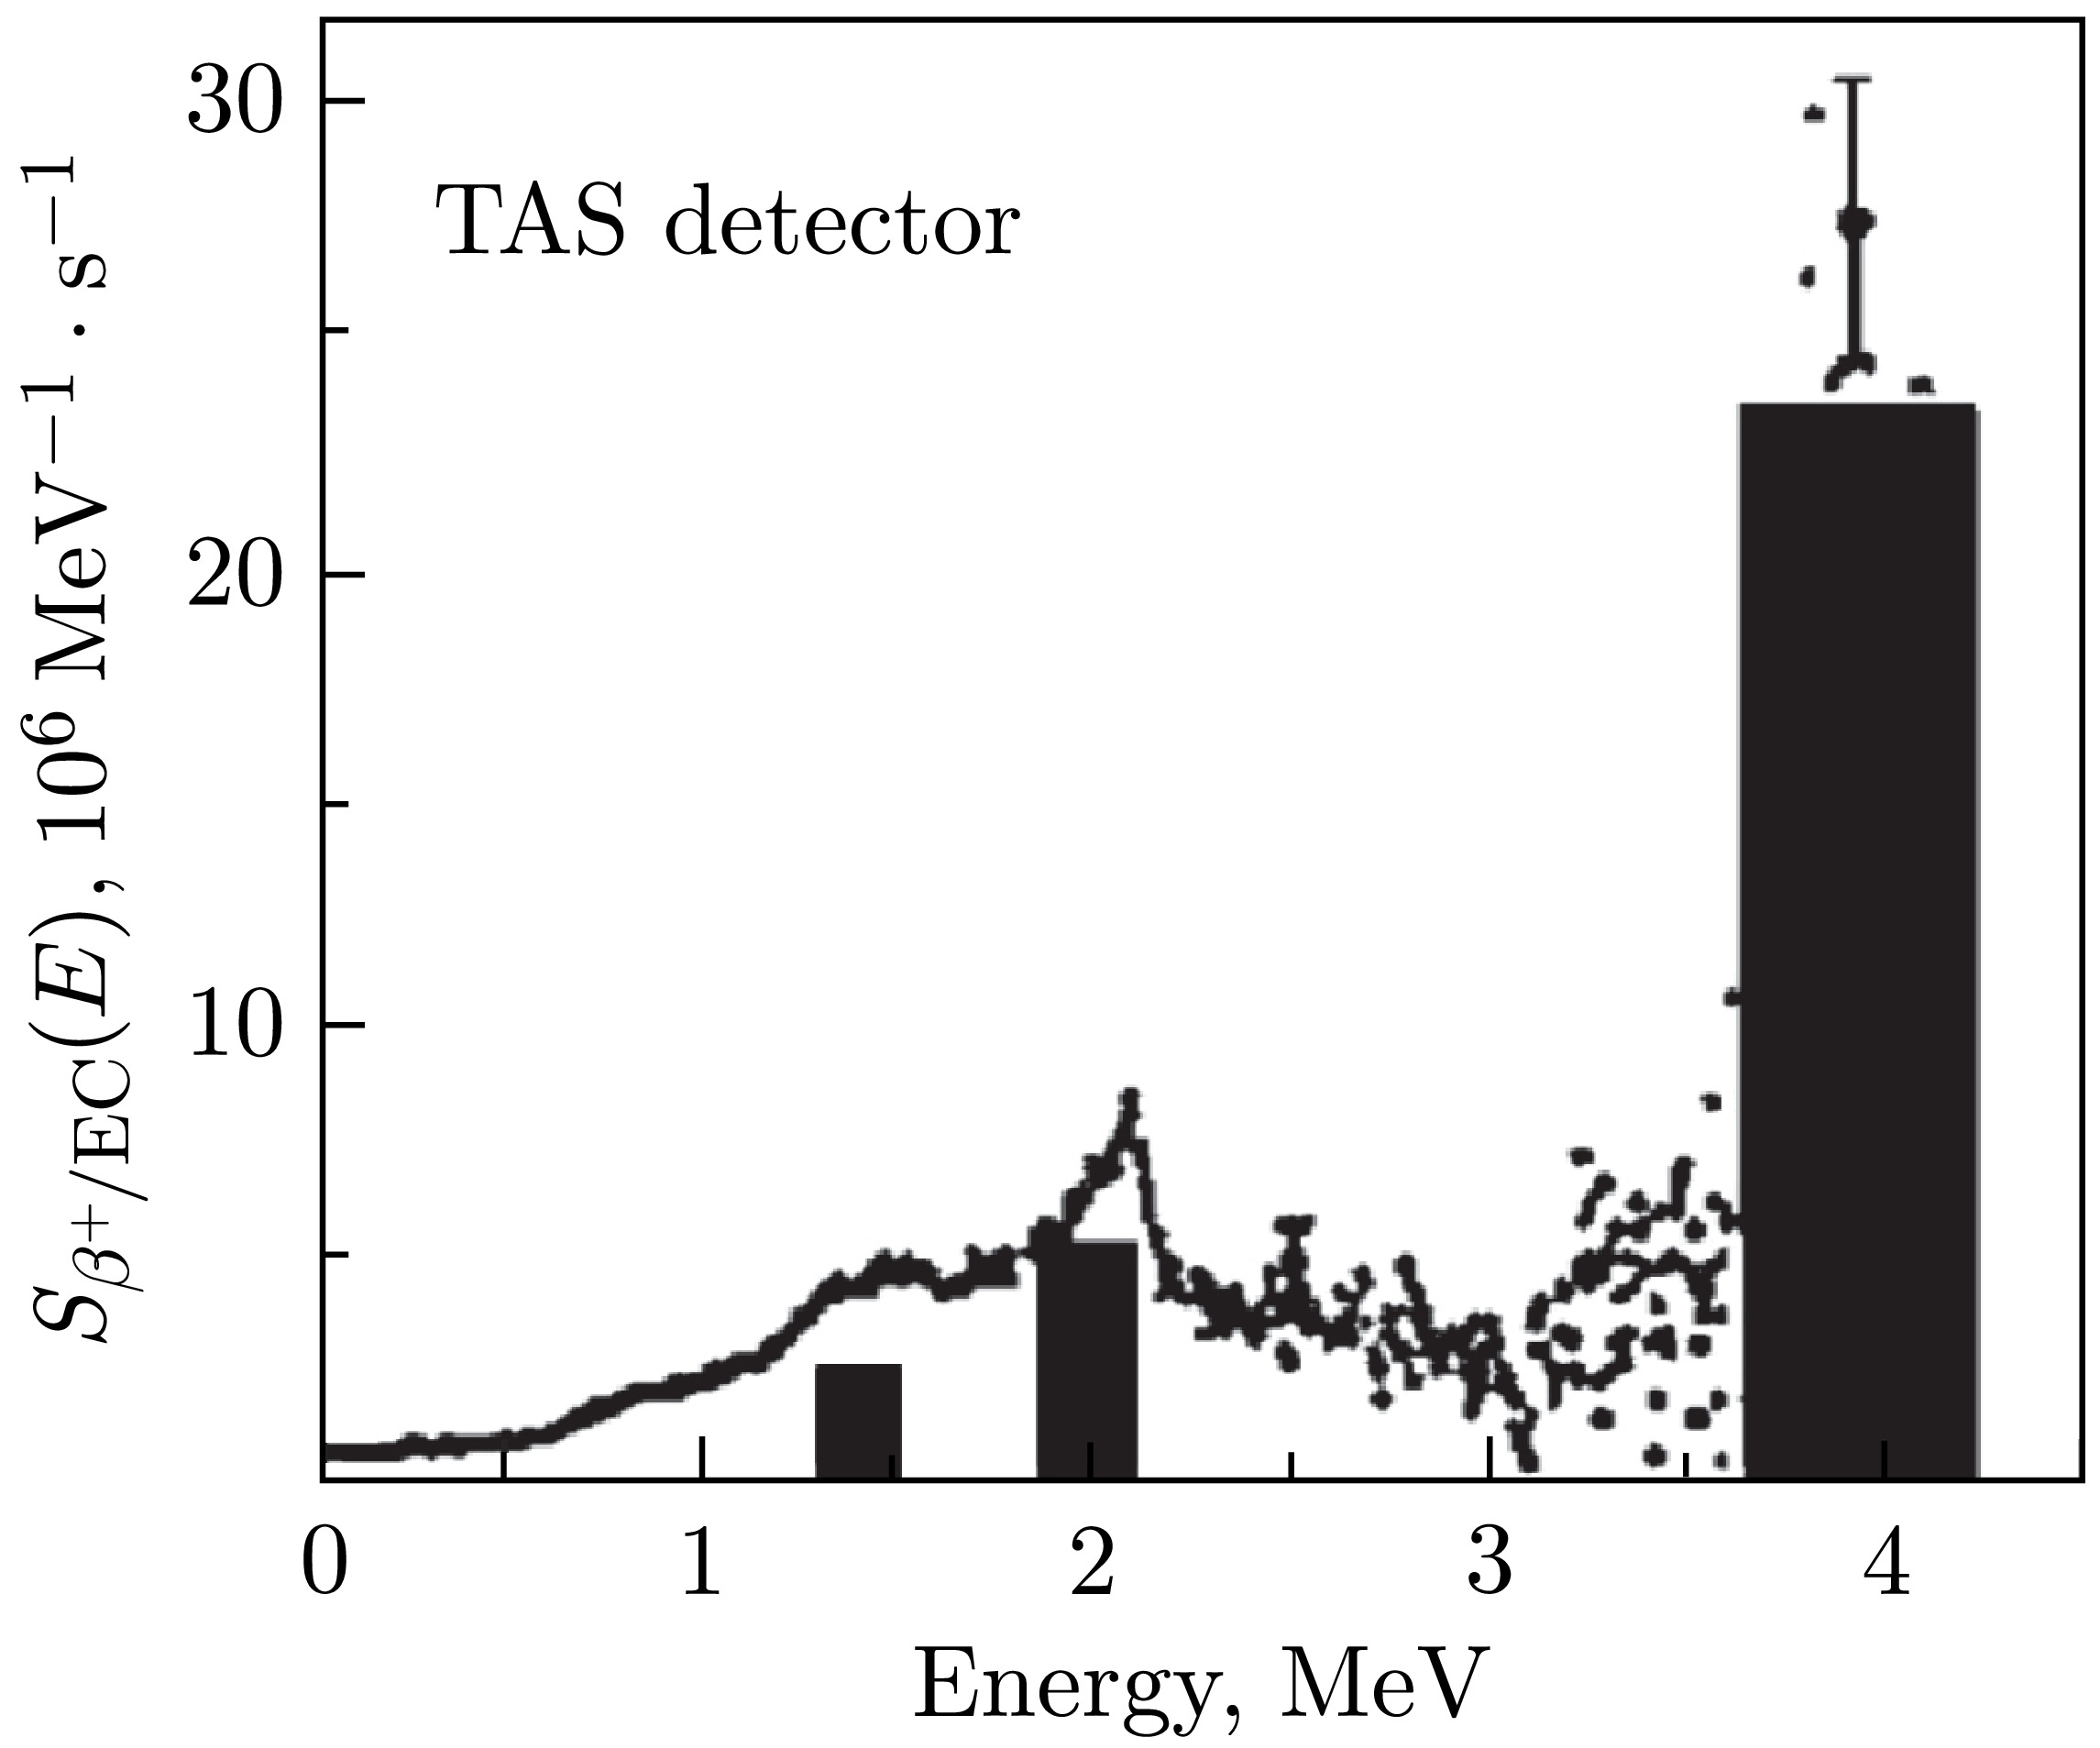
Figure 5.
$ S_{\beta}(E) $ for the$ \beta^{+} $ /EC-decay of$ ^{147g} {\rm{Tb}}$ obtained from the TAGS γ-ray spectra (Fig. 4) analysis. The highest-intensity peak in$ S_{\beta}(E) $ at the excitation energy region$ E \approx 4 $ MeV is interpreted as a tail of the GT resonance with$ \mu_{\tau} = +1 $ 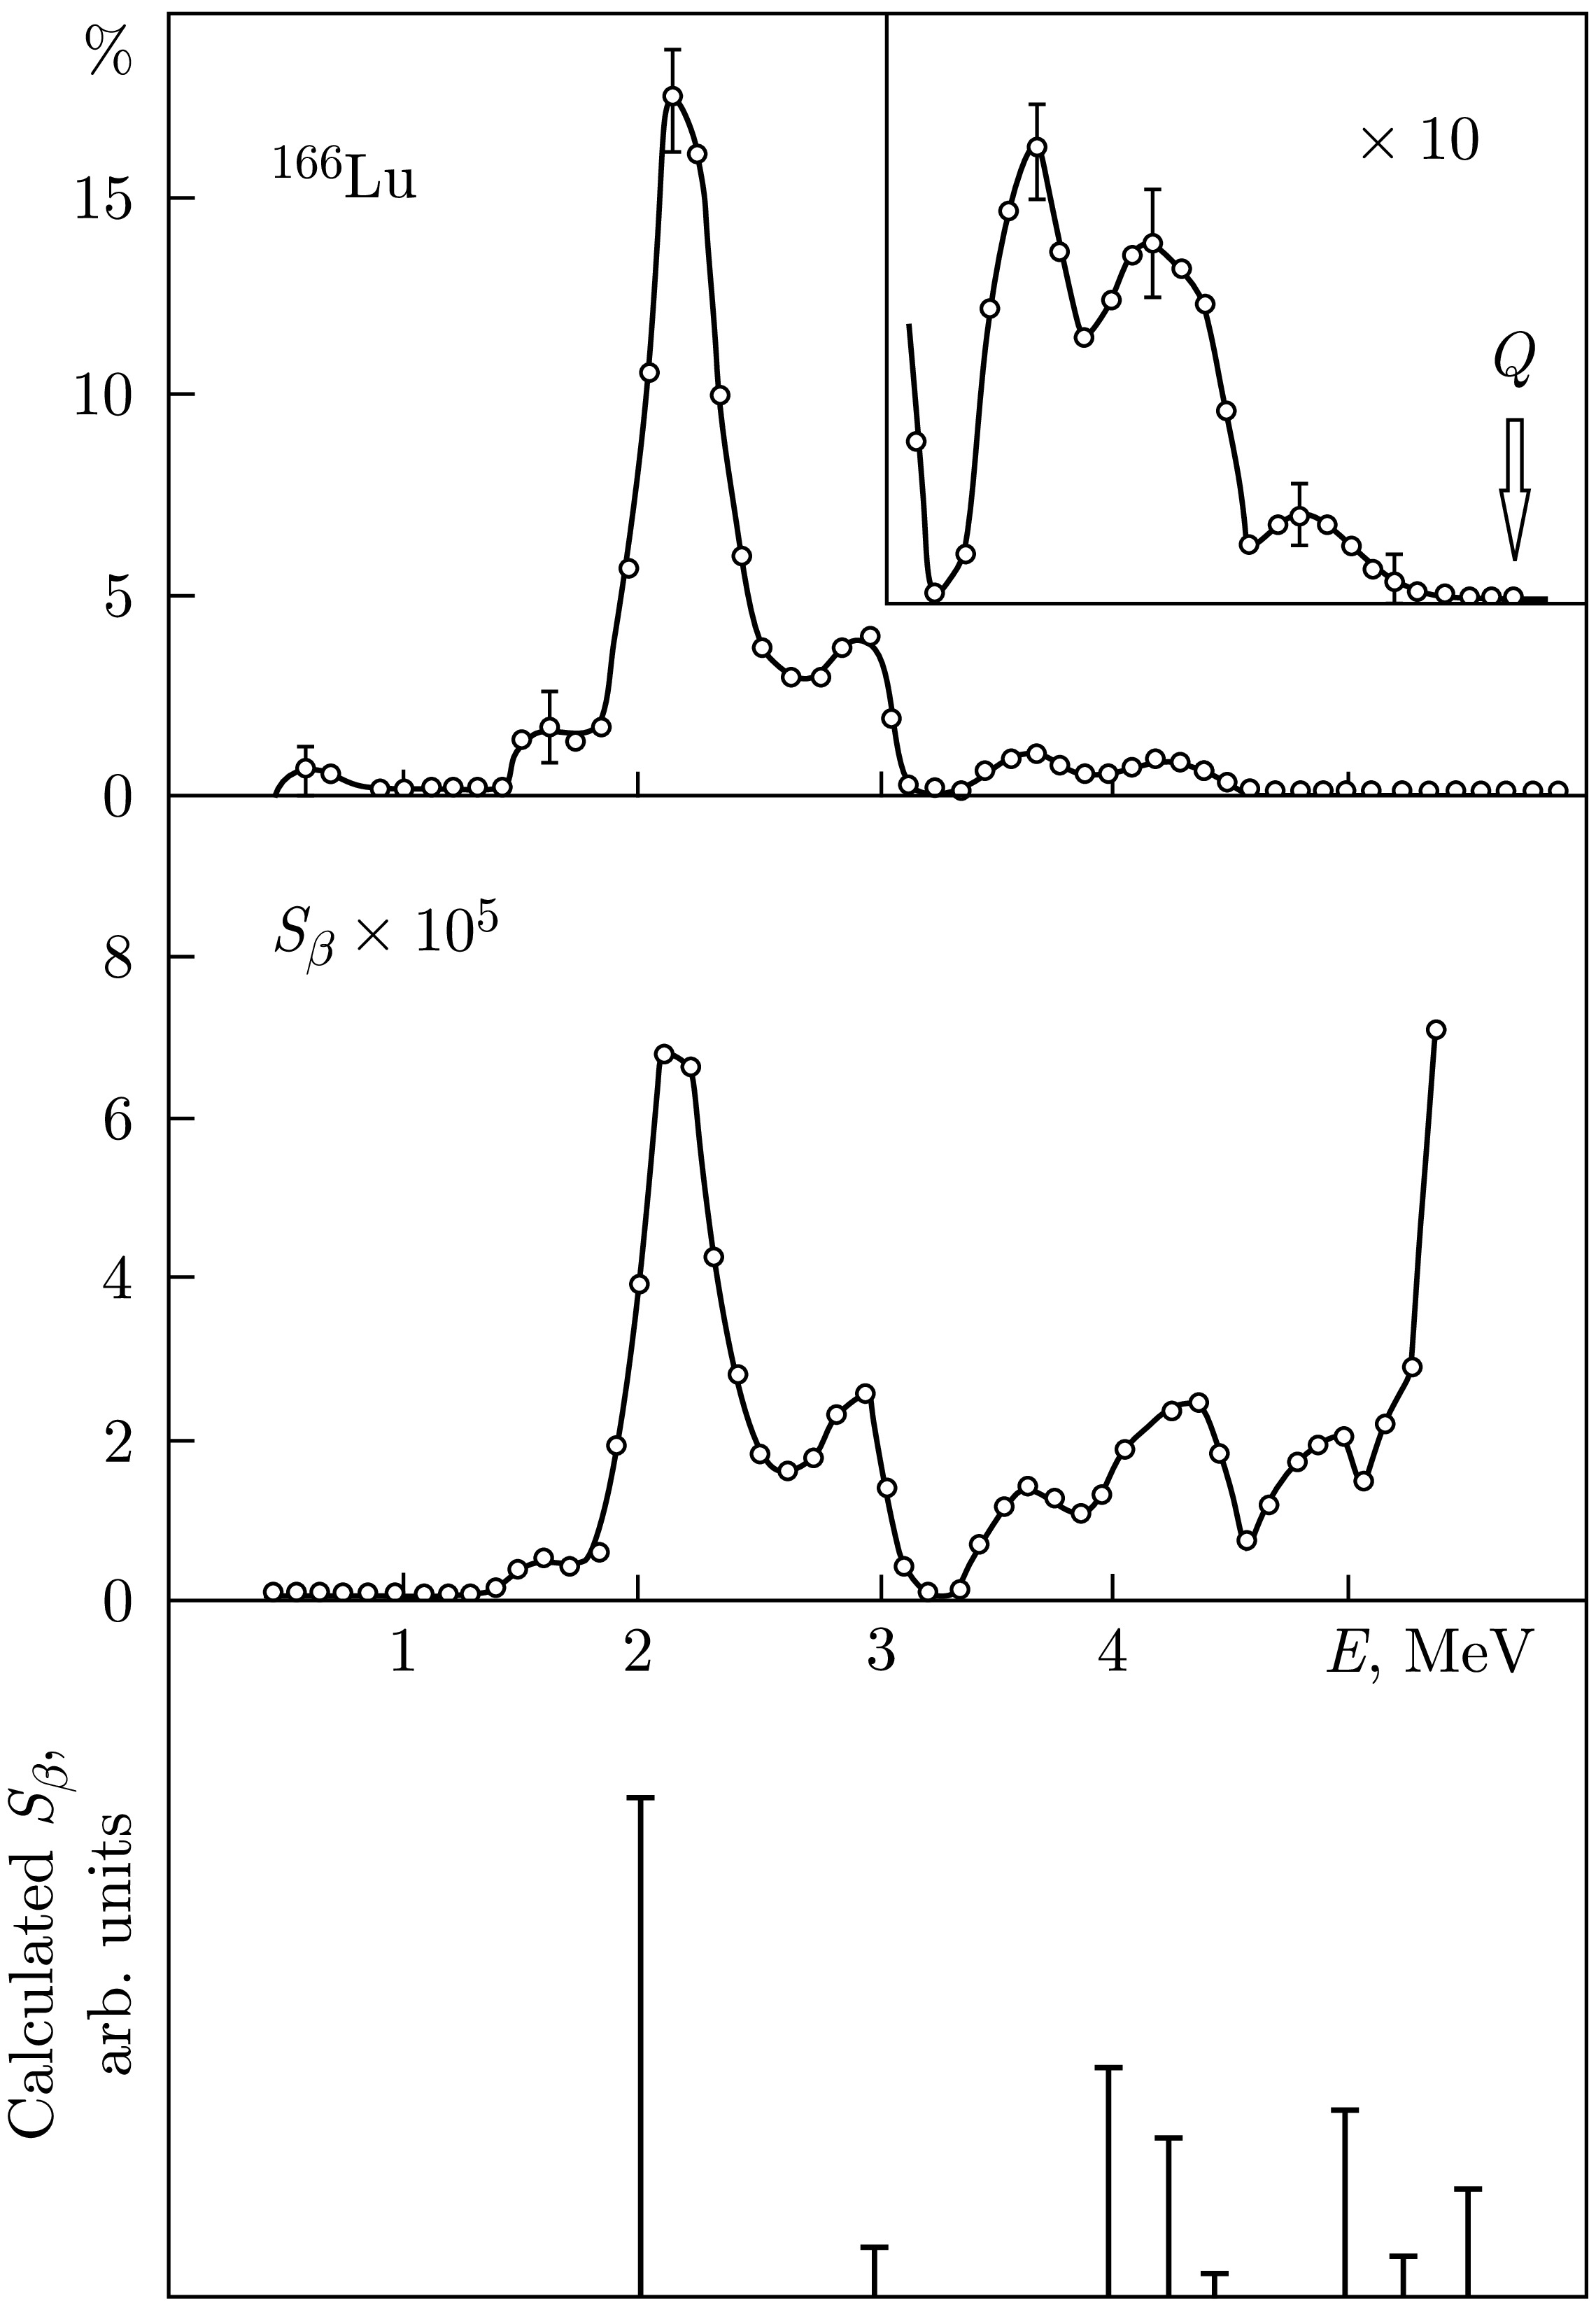
Figure 6. Level population (in %),
$ S_{\beta}(E) $ (in MeV$ ^{-1}\,\cdot\, $ s−1) for the$ \beta^{+} $ /EC-decay of 166Lu obtained by using TAGS, and results of calculation of$ S_{\beta}(E) $ structure (linear scale) with the GT (spin–isospin) residual interaction [4]The second method [8−10] is based on applying the so-called response function, but to extract the shape of
$ S_{\beta}(E) $ from the TAGS spectrum, many assumptions must be made. The analysis depends on assumptions about the decay scheme, which is generally unknown. It is very difficult to estimate the associated systematic errors and uncertainties of such analysis, and only qualitative information about$ S_{\beta}(E) $ can be obtained.Conversion electrons are not measured by TAGS, and it is desirable to estimate the associated systematic error for both TAGS spectrum analysis methods.
In this review, we applied the first method for analyzing TAGS spectra [4, 7, 11]. The TAGS spectrometer is schematically shown in Fig. 3. Its registration efficiency
$ \varepsilon_{\text{tot}} $ for γ-rays in the total absorption peak in the studied excitation energy range in daughter nuclei 147Gd (0.1 MeV—4.6 MeV) exponentially depends on the total energy$ E_{\gamma} $ of the deexcitation γ-transitions [7]. It is known [4, 11] that in this case, the intensity of the total absorption peak of γ-rays is proportional to the level population probability in β-decay and does not depend on the decay scheme. Therefore, the analysis of measured spectra was reduced to identifying total absorption peaks of γ-rays and determining their intensities. Then, using the thus obtained total absorption peak intensities of γ-rays and Eq. (3), the strength function for$ \beta^{+} $ /EC-decay of$ ^{147g} {\rm{Tb}}$ was constructed (Figs. 4 and 5).The γ-radiation spectra measured by the total absorption spectrometer in coincidence with
$ \beta^{+} $ -particles in$ \beta^{+} $ /EC-decay of$ ^{147g} {\rm{Tb}}$ and without coincidence are shown in Fig. 4. The endpoint energy of the total absorption spectra is determined by the total electron capture energy$ Q_{\text {EC}} = 4.6 $ MeV. The peak with energy$ E_{\gamma} \approx 4 $ MeV in the spectrum without coincidence and the peak at$ E_{\gamma^{\prime}} \approx 3 $ MeV in the coincidence spectrum have the maximum energies and are identified as total absorption peaks. The peak at$ E_{\gamma} \approx E_{\gamma^{\prime}} - 2m_{e}c^{2} \approx 2 $ MeV in the spectrum without coincidence, where$ 2m_{e}c^{2} $ is the energy of two annihilation quanta, corresponds to the total absorption peak at$ E_{\gamma^{\prime}} \approx 3 $ MeV. Thus, the peak at$ E_{\gamma} \approx 2 $ MeV in the spectrum without coincidence is also a total absorption peak. Consequently, in the strength function for$ \beta^{+} $ /EC-decay of$ ^{147g} {\rm{Tb}}$ (Fig. (Figs. 4 and 5), two peaks at energies 4 MeV and 2 MeV can be reliably identified, and to find the intensities and energies of these two peaks during analysis of total absorption γ-spectra, no information about the decay scheme is required. In$ S_{\beta}(E) $ for$ ^{147g} {\rm{Tb}}$ , a third peak is observed at$ E \approx 1.4 $ MeV, but reliable determination of its intensity requires information about the deexcitation scheme of excited levels in 147Gd due to difficulties in identifying the total absorption peak in this energy region. Note that for$ \beta^{+} $ /EC-decay, two total absorption peaks can be identified in TAGS spectra. This is possible when the total absorption peak with the highest energy falls into the energy window accessible for electron capture but inaccessible for$ \beta^{+} $ -decay. In Fig. 5, the intensity of the peak with energy$ E \approx 1.4 $ MeV in$ S_{\beta}(E) $ was obtained from the analysis of total absorption γ-ray spectra under the assumption that levels in the excitation energy region$ E \approx 1.4 $ MeV deexcite by emitting two γ-rays with equal energies. Thus, the energy and intensity of two peaks with energies$ E \approx 4 $ MeV and 2 MeV in the strength function for$ \beta^{+} $ /EC-decay of$ ^{147g} {\rm{Tb}}$ (Fig. 5) can be reliably determined. For the remaining peaks with lower energies, we have no reason to consider them as total absorption peaks of γ-cascades and cannot process them using our method. Therefore, for Fig. 4a, we do not analyze peaks with energies below 2 MeV. The peak of greatest intensity in the excitation energy region$ E \approx 4 $ MeV is interpreted as the "tail" of the main GT resonance [7] with$ \mu_{\tau} = +1 $ (according to the scheme for$ S_{\beta}(E) $ , Fig. 2).Theoretical calculations [7], performed within the MQPM model with the QRPA approach, revealed, like the experiment, a peak of greatest intensity in
$ S_{\beta}(E) $ (GT resonance with$ \mu_{\tau} = +1 $ ) in the excitation energy region$ E \approx 4 $ MeV of the daughter nucleus 147Gd. This allows the conclusion that this model is applicable for describing$ S_{\beta}(E) $ for spherical nuclei, which include the studied nucleus$ ^{147g} {\rm{Tb}}$ and its daughter nucleus 147Gd. Note, however, that theoretical calculations [7] give an intensity for the main resonance with energy$ E \approx 4 $ MeV several times higher than the experimental value. This "large overestimation" may be a consequence of the fact that in the experiment we observe only that part of the resonance that falls into the energy region accessible for electron capture. However, theoretical calculations [4, 7, 24], as a rule, correctly describe the energy but give higher intensity for resonances (Fig. 6) than observed experimentally. This (quenching factor) is characteristic of many nuclei studied by the TAGS method [4, 28, 29].Thus, TAGS methods allow revealing the resonant character of
$ S_{\beta}(E) $ and obtaining data on the structure of$ S_{\beta}(E) $ when total absorption peaks are reliably identified in the TAGS spectrum. Usually, in$ S_{\beta}(E) $ for$ \beta^{-} $ -decay, one total absorption peak is identified, and in$ S_{\beta}(E) $ for$ \beta^{+} $ /EC-decay, two peaks are identified. To obtain more complete information about the structure of$ S_{\beta}(E) $ , high energy resolution nuclear spectroscopy methods should be used [7, 11−15].The endpoint of the TAGS spectrum is related to the total beta-decay energy
$ Q_{\beta} $ . TAGS spectroscopy can be used to measure$ Q_{\beta} $ with an accuracy of up to 50 keV [4]. Typically, the most informative region for determining the TAGS spectrum endpoint has a low count per channel, and it is very difficult to determine it directly. The part of the TAGS spectrum with sufficiently high statistics is not as informative for this purpose. There is an optimal TAS spectrum interval for determining$ Q_{\text {EC}} $ . We use a$ \chi^{2} $ -criterion to select the optimal energy interval [15]. In the approximated region, errors in determining intensity$ \delta I $ exceeded the maximum value of the pileup spectrum intensity. Results of determining$ Q_{\text {EC}} $ from TAGS spectra of$ \beta^{+}/ $ EC-decay of$ ^{156} {\rm{Ho}}$ ($ T_{1/2} \approx 56 $ min) are presented in Fig. 7. The obtained value$ Q_{\text {EC}} = (5.05\pm 0.07) $ MeV for$ ^{156} {\rm{Ho}}$ ($ T_{1/2}\approx 56 $ min) is in good agreement with systematics [15, 29].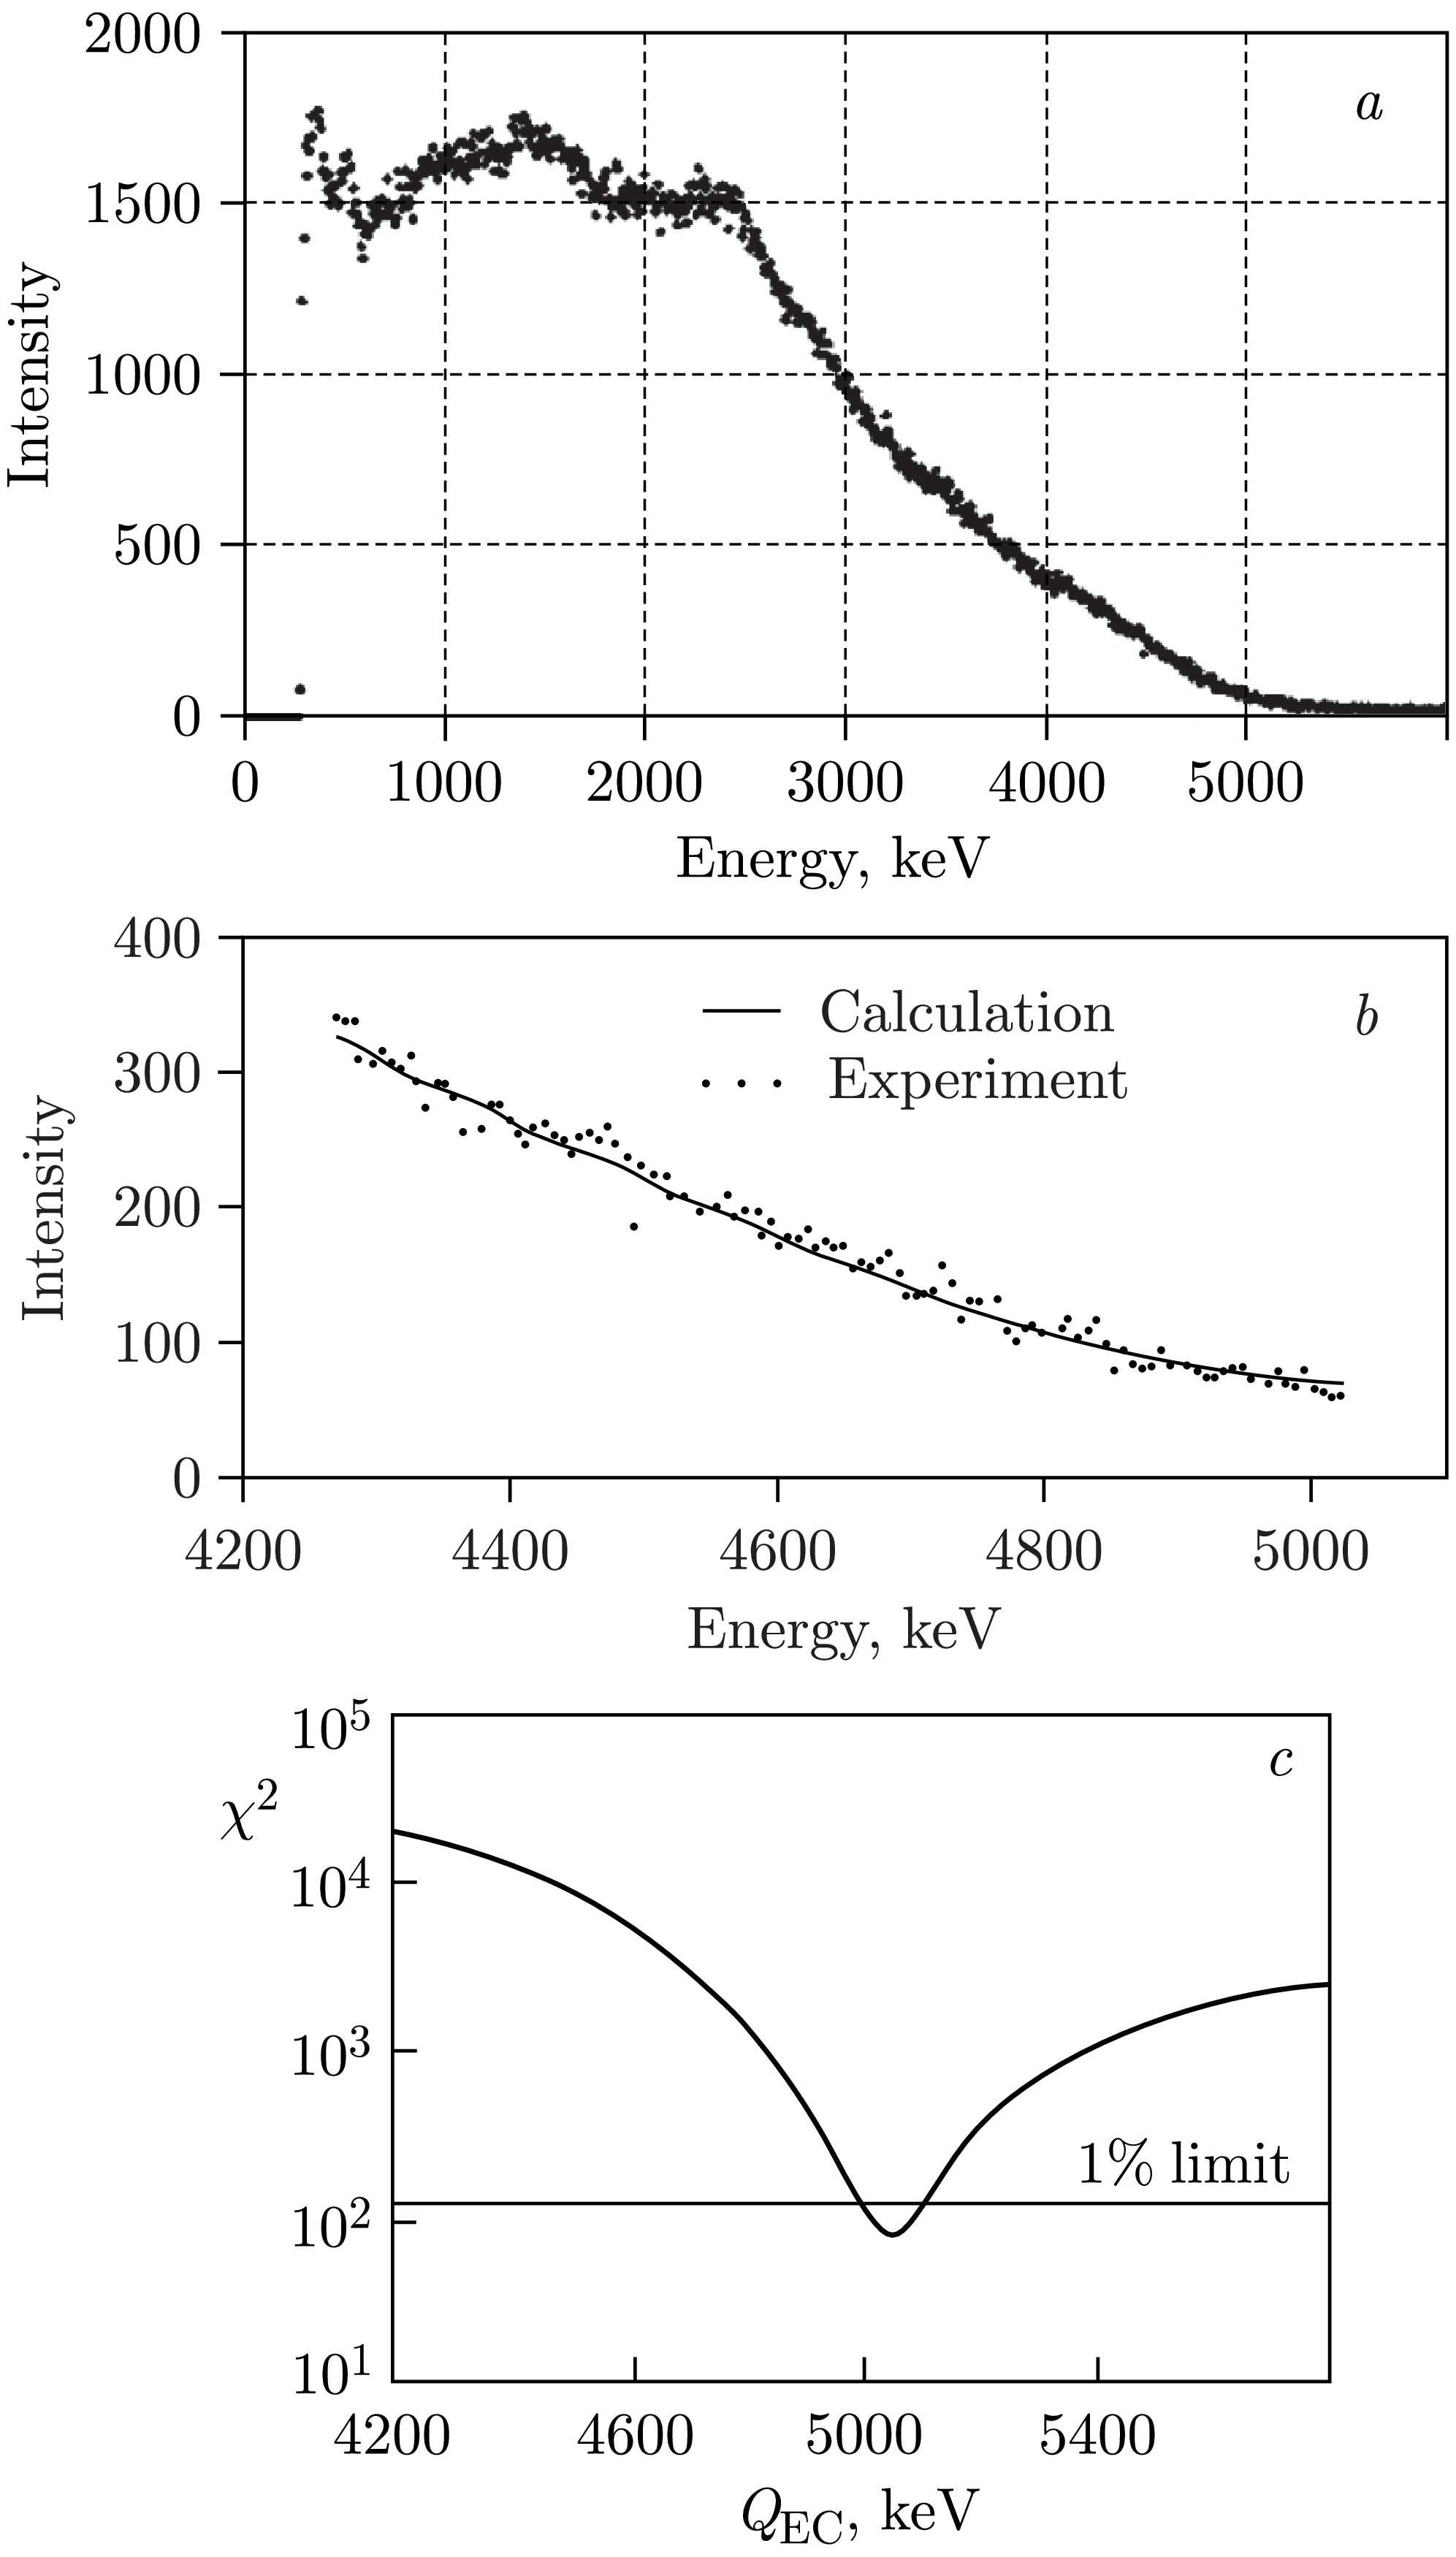
Figure 7. TAGS γ-ray spectra (a) of
$ ^{156} {\rm{Ho}}$ $ \beta^{+}/ $ EC-decay ($ T_{1/2} \approx 56 $ min),$ Q_{\text {EC}} = (5.05\pm 0.07) $ MeV and optimal fitted range (b) of TAGS spectra was selected (see text) for$ Q_{\text {EC}} $ determination. The number of degrees of freedom for the fitted range was$ \nu = 105 $ ,$ \chi^{2}_{\min}/\nu = 0.81 $ (c)Since conversion electrons are generally not detected, and for
$ E_{\gamma} \gt 5 $ MeV there is no exponential dependence of total absorption efficiency on$ E_{\gamma} $ , TAGS spectrum analysis can give incorrect results. Also, TAGS cannot distinguish GT and FF transitions and can offer only limited information about$ S_{\beta}(E) $ . However, using TAGS, one can determine the total beta-decay energy$ Q_{\beta} $ [4, 6, 11, 15], demonstrate the resonant structure of$ S_{\beta}(E) $ , and, in combination with high-resolution nuclear spectroscopy methods, provide quantitative information about$ S_{\beta}(E) $ for both GT and FF beta-decays and identify the degree of incompleteness of the decay scheme. -
TAGS methods have some disadvantages related to the poor energy resolution of
$ NaI $ -based spectrometers. In TAGS spectra, only one or two absorption peaks can be identified; isobaric impurities in the analyzed source often lead to uncertainties; thus, it is impossible to distinguish GT and FF β-transitions and measure the fine structure of$ S_{\beta}(E) $ ; difficulties often arise during spectrum processing, namely when it is necessary to account for internal conversion of γ-rays or identify total absorption peaks. The exponential dependence [4, 11] of TAGS efficiency on energy is essentially important for the total absorption spectrometer and requires experimental verification in the energy range up to$ Q_{\beta} $ . Therefore, it is very important to measure$ S_{\beta}(E) $ using high-resolution γ-spectroscopy methods. Advances in experimental techniques allow the application of nuclear spectroscopy methods with high energy resolution (including high-resolution γ-spectroscopy and conversion electron spectroscopy) to measure the fine structure of$ S_{\beta}(E) $ . Results of some first successful measurements of the fine structure of$ S_{\beta}(E) $ are summarized in [11, 12]. The combination of total absorption spectroscopy with high-resolution spectroscopy can be applied to construct detailed decay schemes [7, 11, 15]. High-resolution nuclear spectroscopy methods [11−13] have experimentally demonstrated the resonant nature of$ S_{\beta}(E) $ for first-forbidden β-transitions and revealed the splitting of the peak in$ S_{\beta}(E) $ for GT$ \beta^{+}/ $ /EC-decay of deformed nuclei into two components. This splitting indicates anisotropy in oscillations of the isovector component of density [11, 14].Using our TAGS spectrometer, we observed [7, 11] the "tail" of the Gamow–Teller resonance with
$ \mu_{\tau} = +1 $ (Fig. 5) in$ ^{147g} {\rm{Tb}}$ ($ T_{1/2}\approx 1.6 $ h) as a strong peak in$ S_{\beta}(E) $ at$ E \approx 4 $ MeV. But, the$ \beta^{+}/ $ EC-transitions to levels with excitation energies above 2 MeV were not identified in the decay scheme (Fig. 8) from [29]. This means that the decay scheme of$ ^{147g} {\rm{Tb}}$ in [29] is highly incomplete. A more complete decay scheme of$ ^{147g} {\rm{Tb}}$ was constructed in [30] (Fig. 9). The most interesting region for studying the beta-decay strength function is at excitation energies above 2—4 MeV. The strength function for$ \beta^{+}/ $ EC-decay (Fig. 10 and 11), derived from the more complete decay scheme, was constructed in [11, 12]. The strength functions (Figs. 5 and 10) are in good agreement, and one can conclude that the$ \beta^{+}/ $ EC-decay scheme of$ ^{147g} {\rm{Tb}}$ in [30] is sufficiently complete. This demonstrates that decay schemes for transitions to levels with excitation energies above 2—3 MeV in medium and heavy nuclei can be very incomplete. To construct a detailed decay scheme and study the fine structure of$ S_{\beta}(E) $ , much more time for measurements and data analysis is needed compared to TAGS experiments.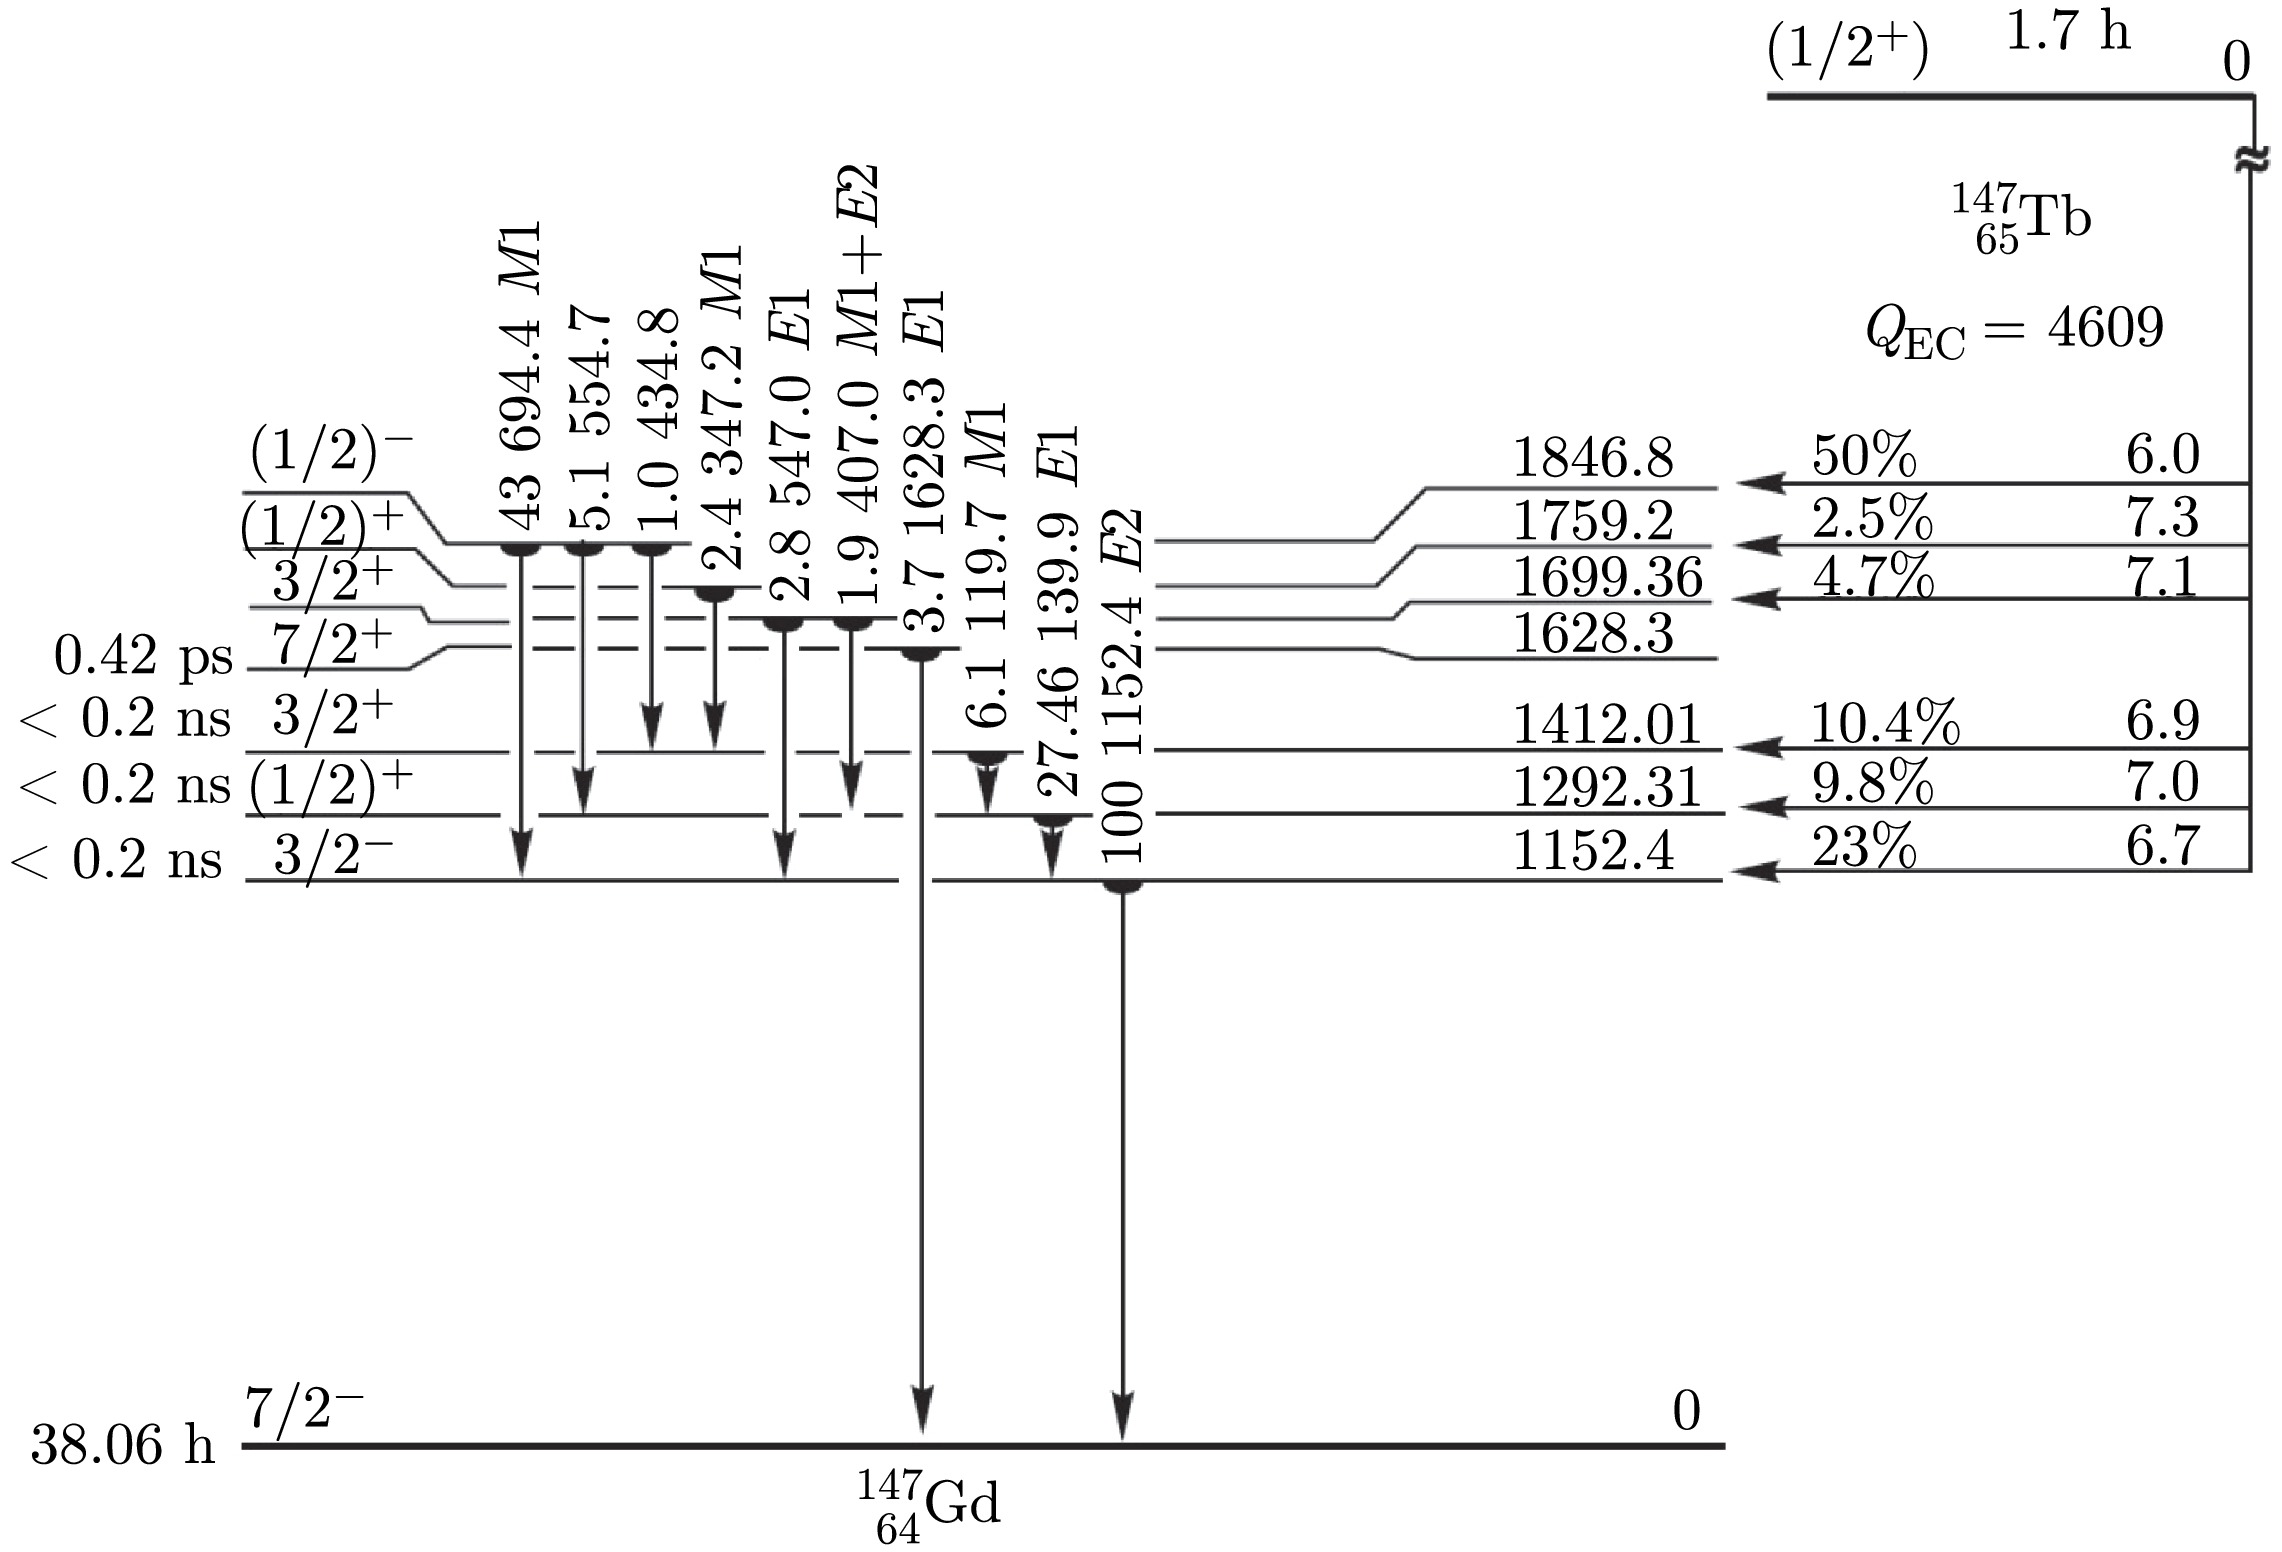
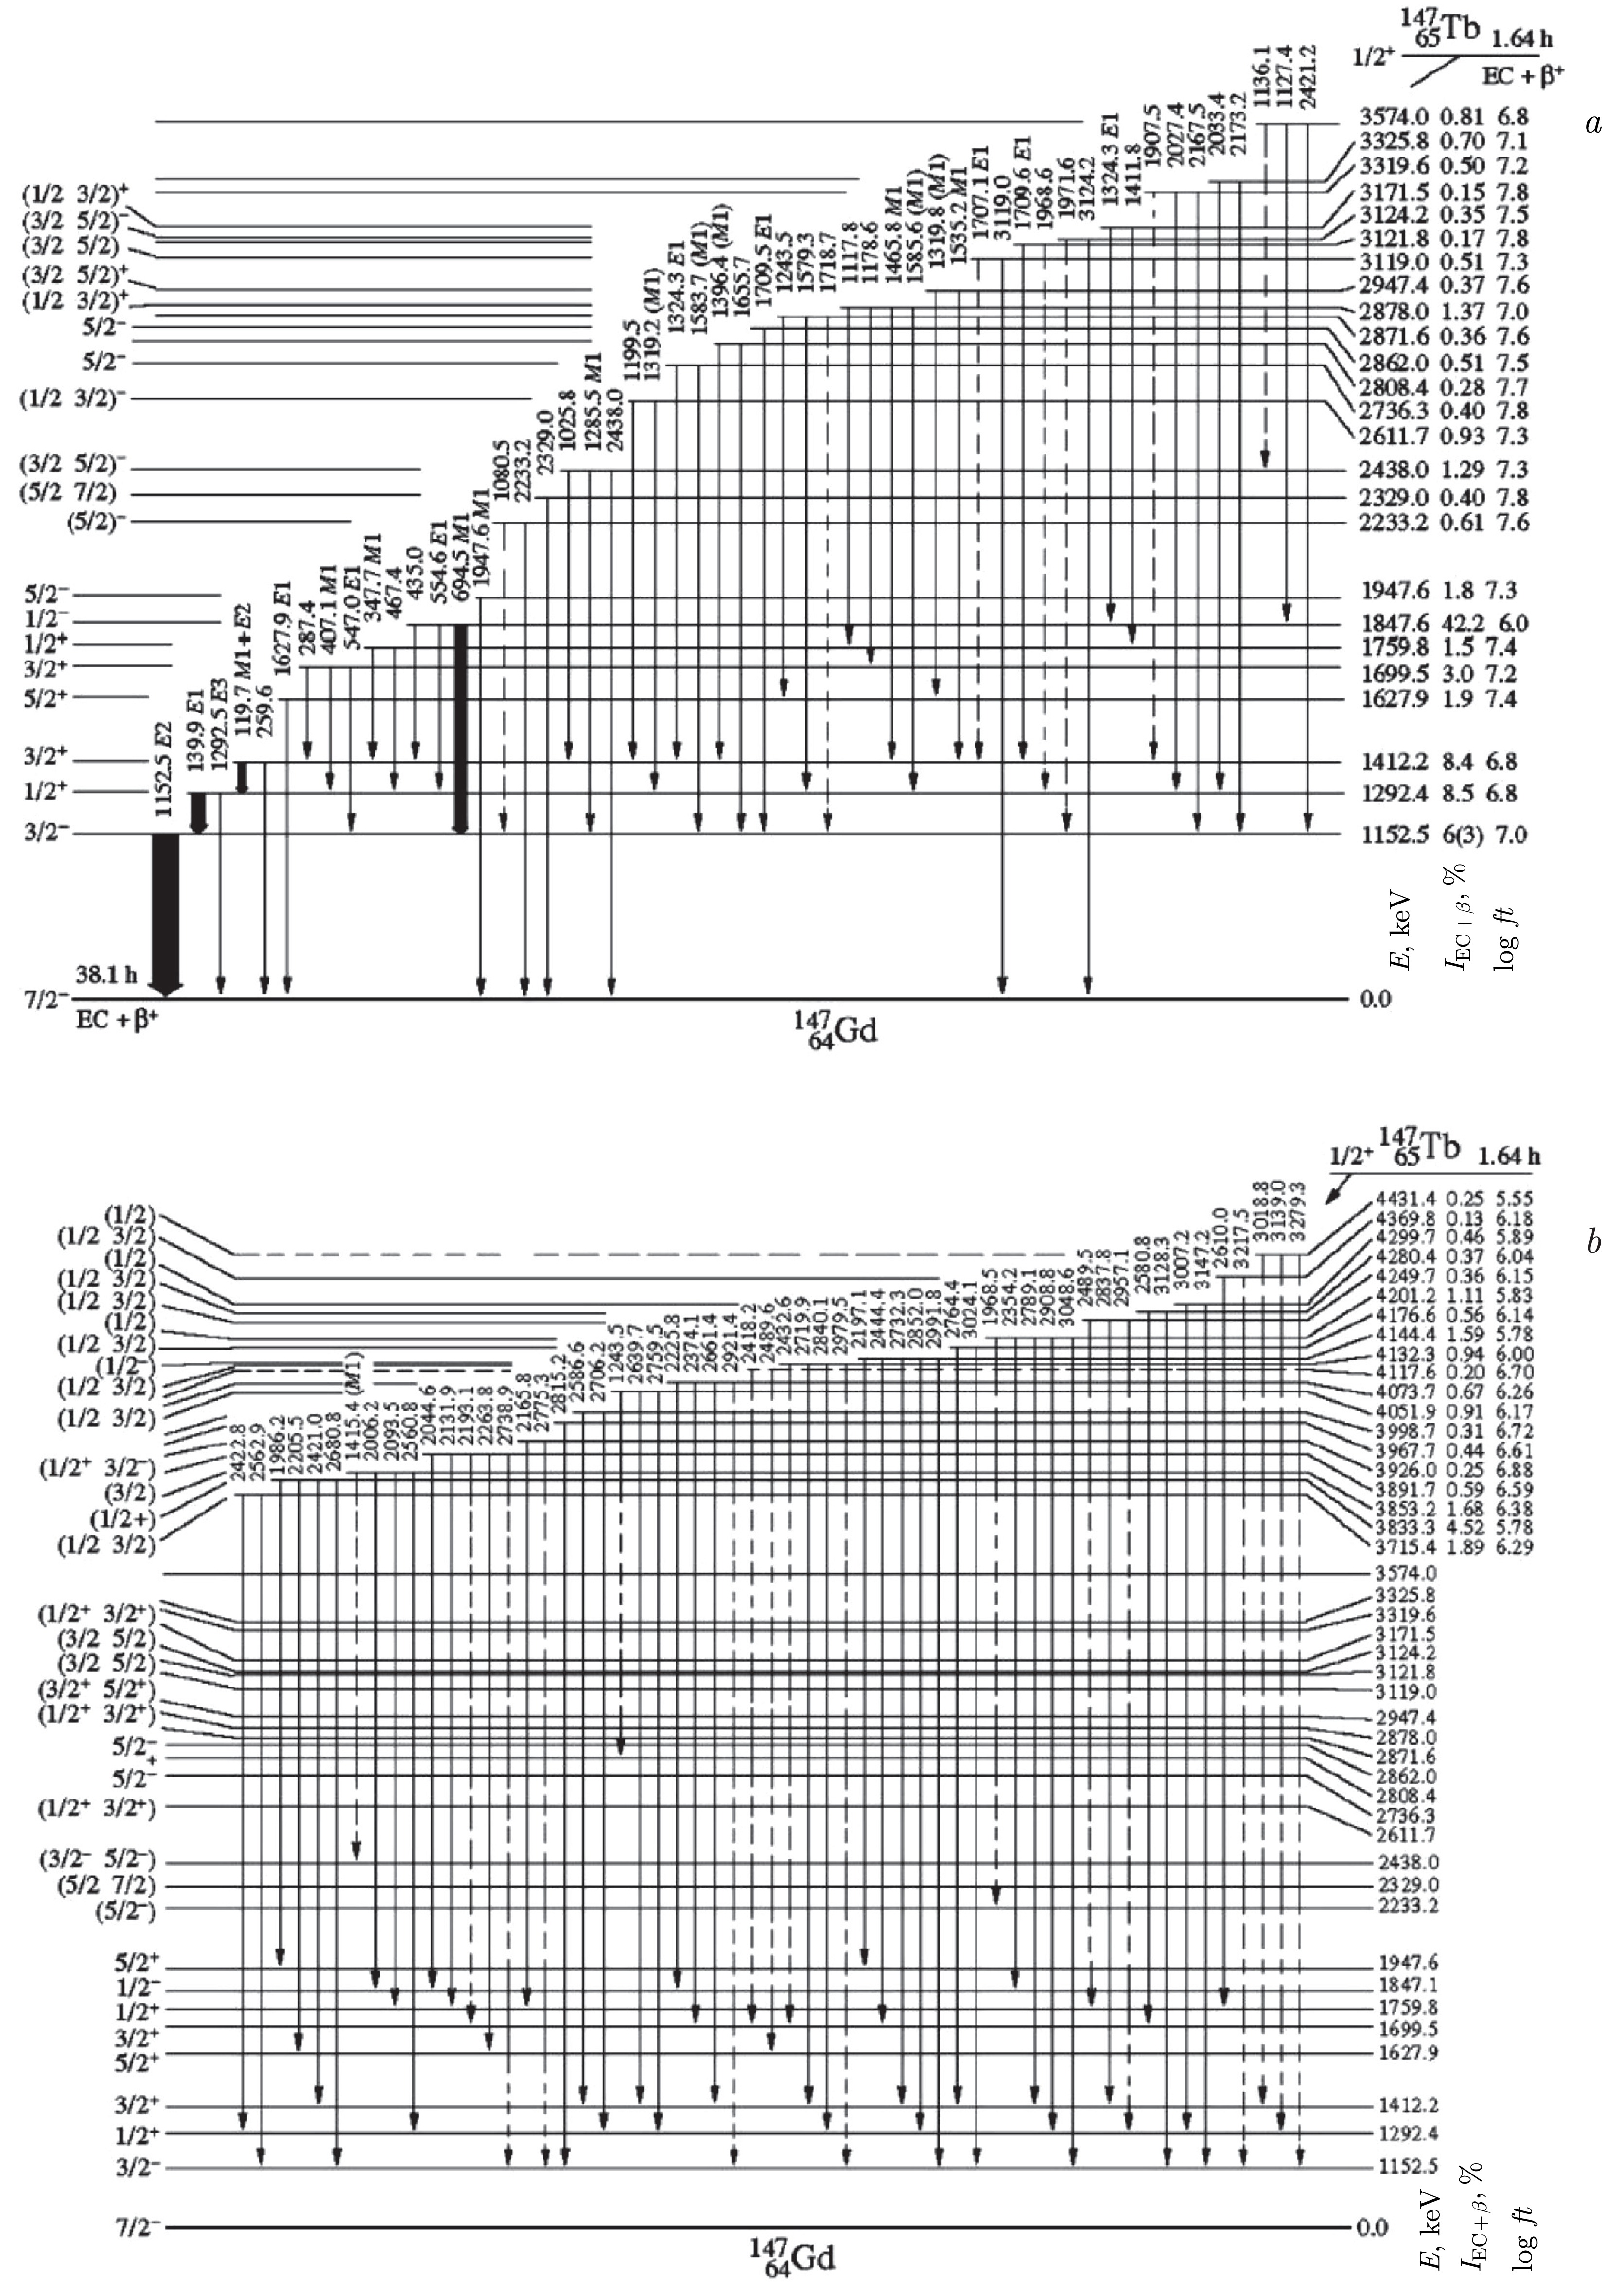
Figure 9.
$ ^{147g} {\rm{Tb}}$ decay scheme [11, 30]. There are many$ \beta^{+} $ /EC-transitions to the region where the excitation energy is higher than 2 MeV. a) Low energy levels of 147Gd; b) high energy levels of 147Gd. This decay scheme is quite complete as it is in good agreement with TAGS data (Figs. 4 and 5)
From a macroscopic viewpoint, resonances in the GT β-decay strength function
$ S_{\beta}(E) $ are associated with oscillations of spin-isospin density without change in nuclear shape [4, 14, 31]. The intensities of K-allowed β-transitions to levels of one rotational band and the intensity ratios of electromagnetic transitions within the band and between states of different bands satisfy simple relations following from the rotational model (Alaga rules) [32]. The$ ft $ ratios for$ |K_{i} - K_{f}| \leqslant \lambda $ and$ |K_{i} + K_{f}| \gt \lambda $ expressed through ratios of squares of the corresponding Clebsch–Gordan coefficients:$ \begin{array}{l} ft(I_{i}K_{i} \to I_{1f}K_{f})/ft(I_{i}K_{i} \to I_{2f}K_{f}) = \\ \;\;\;\;\;\;\;\;\;\;\;\;\;\;\;\; = \langle I_{i}K_{i}\lambda K_{i} - K_{f}| I_{2f}K_{f} \rangle^{2}/\langle I_{i}K_{i}\lambda K_{i} - K_{f}|I_{1f}K_{f}\rangle^{2}, \end{array} $
(17) where λ is the multipolarity of the β-transition (
$ \lambda = 1 $ for GT β-transitions). If$ |K_{i} + K_{f}| \leqslant\lambda $ and$ K_{i,f} \ne 0 $ contributions from terms involving signature must be accounted for [31]. Compliance with this rule means that the wave functions of rotational band levels do not have admixture components of neighboring states and the adiabaticity condition is satisfied. Results of calculations using Eq. (17) and experimental data are presented in the Table 1 and Table 2. Considering the excitation energy and quantum characteristics of levels, the experimental data are in good agreement with estimates from Eq. (17), indicating the correct balance of the decay scheme for$ ^{160g} {\rm{Ho}}$ (25.6 min).Energy of the level, keV Quantum ( $ I^{\pi } $ ;$ K^{\pi} $ ) characteristicsLevel population from the $ \beta^{+} $ /EC-decay, % per decaylog $ ft $ 1694.36(2) $ ^{\hat{\phantom{}}} $ $ ^{\hat{\phantom{}}} $ $ I^\pi = 4^{+} $ ;$ K^\pi = 4^{+} $ 74(5) 4.72(3) 1802.24(2) $ ^{\hat{\phantom{}}} $ $ ^{\hat{\phantom{}}} $ $ I^\pi = 5^{+} $ ;$ K^\pi = 4^{+} $ 10.8(9) 5.49(4) 1929.19(2) $ ^{\hat{\phantom{}}} $ $ ^{\hat{\phantom{}}} $ $ I^\pi = 6^{+} $ ;$ K^\pi = 4^{+} $ 0.62(7) 6.65(5) 2096.87(2)* $ I^\pi = 4^{+} $ ;$ K^\pi = 4^{+} $ 2.9(2) 5.86(3) 2194.43(3)* $ I^\pi = 5^{+} $ ;$ K^\pi = 4^{+} $ 0.43(3) 6.61(4) Note. * and $ ^{\hat{\phantom{}}} $ $ ^{\hat{\phantom{}}} $ stand for the levels in the same rotational bands.Table 1. Levels of
$ ^{160} {\rm{Dy}}$ populated by the$ ^{160g} {\rm{Ho}}$ (25.6 min) GT$ \beta^{+}/ $ EC-decay and making the largest contribution to the intensity of the β-component of the$ S_{\beta}(E) $ peakEnergy of the level $ E_{1} $ , keVEnergy of the level $ E_{2} $ , keVExperiment, $ ft(E_{1})/ft(E_{2}) $ Calculation by formula (17), $ ft(E_{1})/ft(E_{2}) $ 1694.2 1802.2 0.16 0.11 1694.2 1929.1 0.012 0.018 1802.2 1929.1 0.07 0.16 2096.8 2194.4 0.17 0.11 Table 2. Ratios of
$ ft $ for pairs of levels from the same rotational band populated by the GT$ \beta^{+}/ $ EC-decay of$ ^{160g} {\rm{Ho}}$ (25.6 min),$ I^{\pi} = 5^{+} $ ,$ K^{\pi} = 5^{+} $ . Calculated and experimental data are given for two rotational bands in$ ^{160} {\rm{Dy}}$ The average energy
$ \langle E\rangle $ of the$ S_{\beta}(E) $ peak is calculated by formula$ \langle E\rangle = \Sigma_{i}E_{i} \cdot ft_{i}^{-1}/\Sigma_{i} ft_{i}^{-1}. $
(18) Using data from Table 2, we obtain for the γ-type of spin-isospin oscillations (oscillations perpendicular to the symmetry axis)
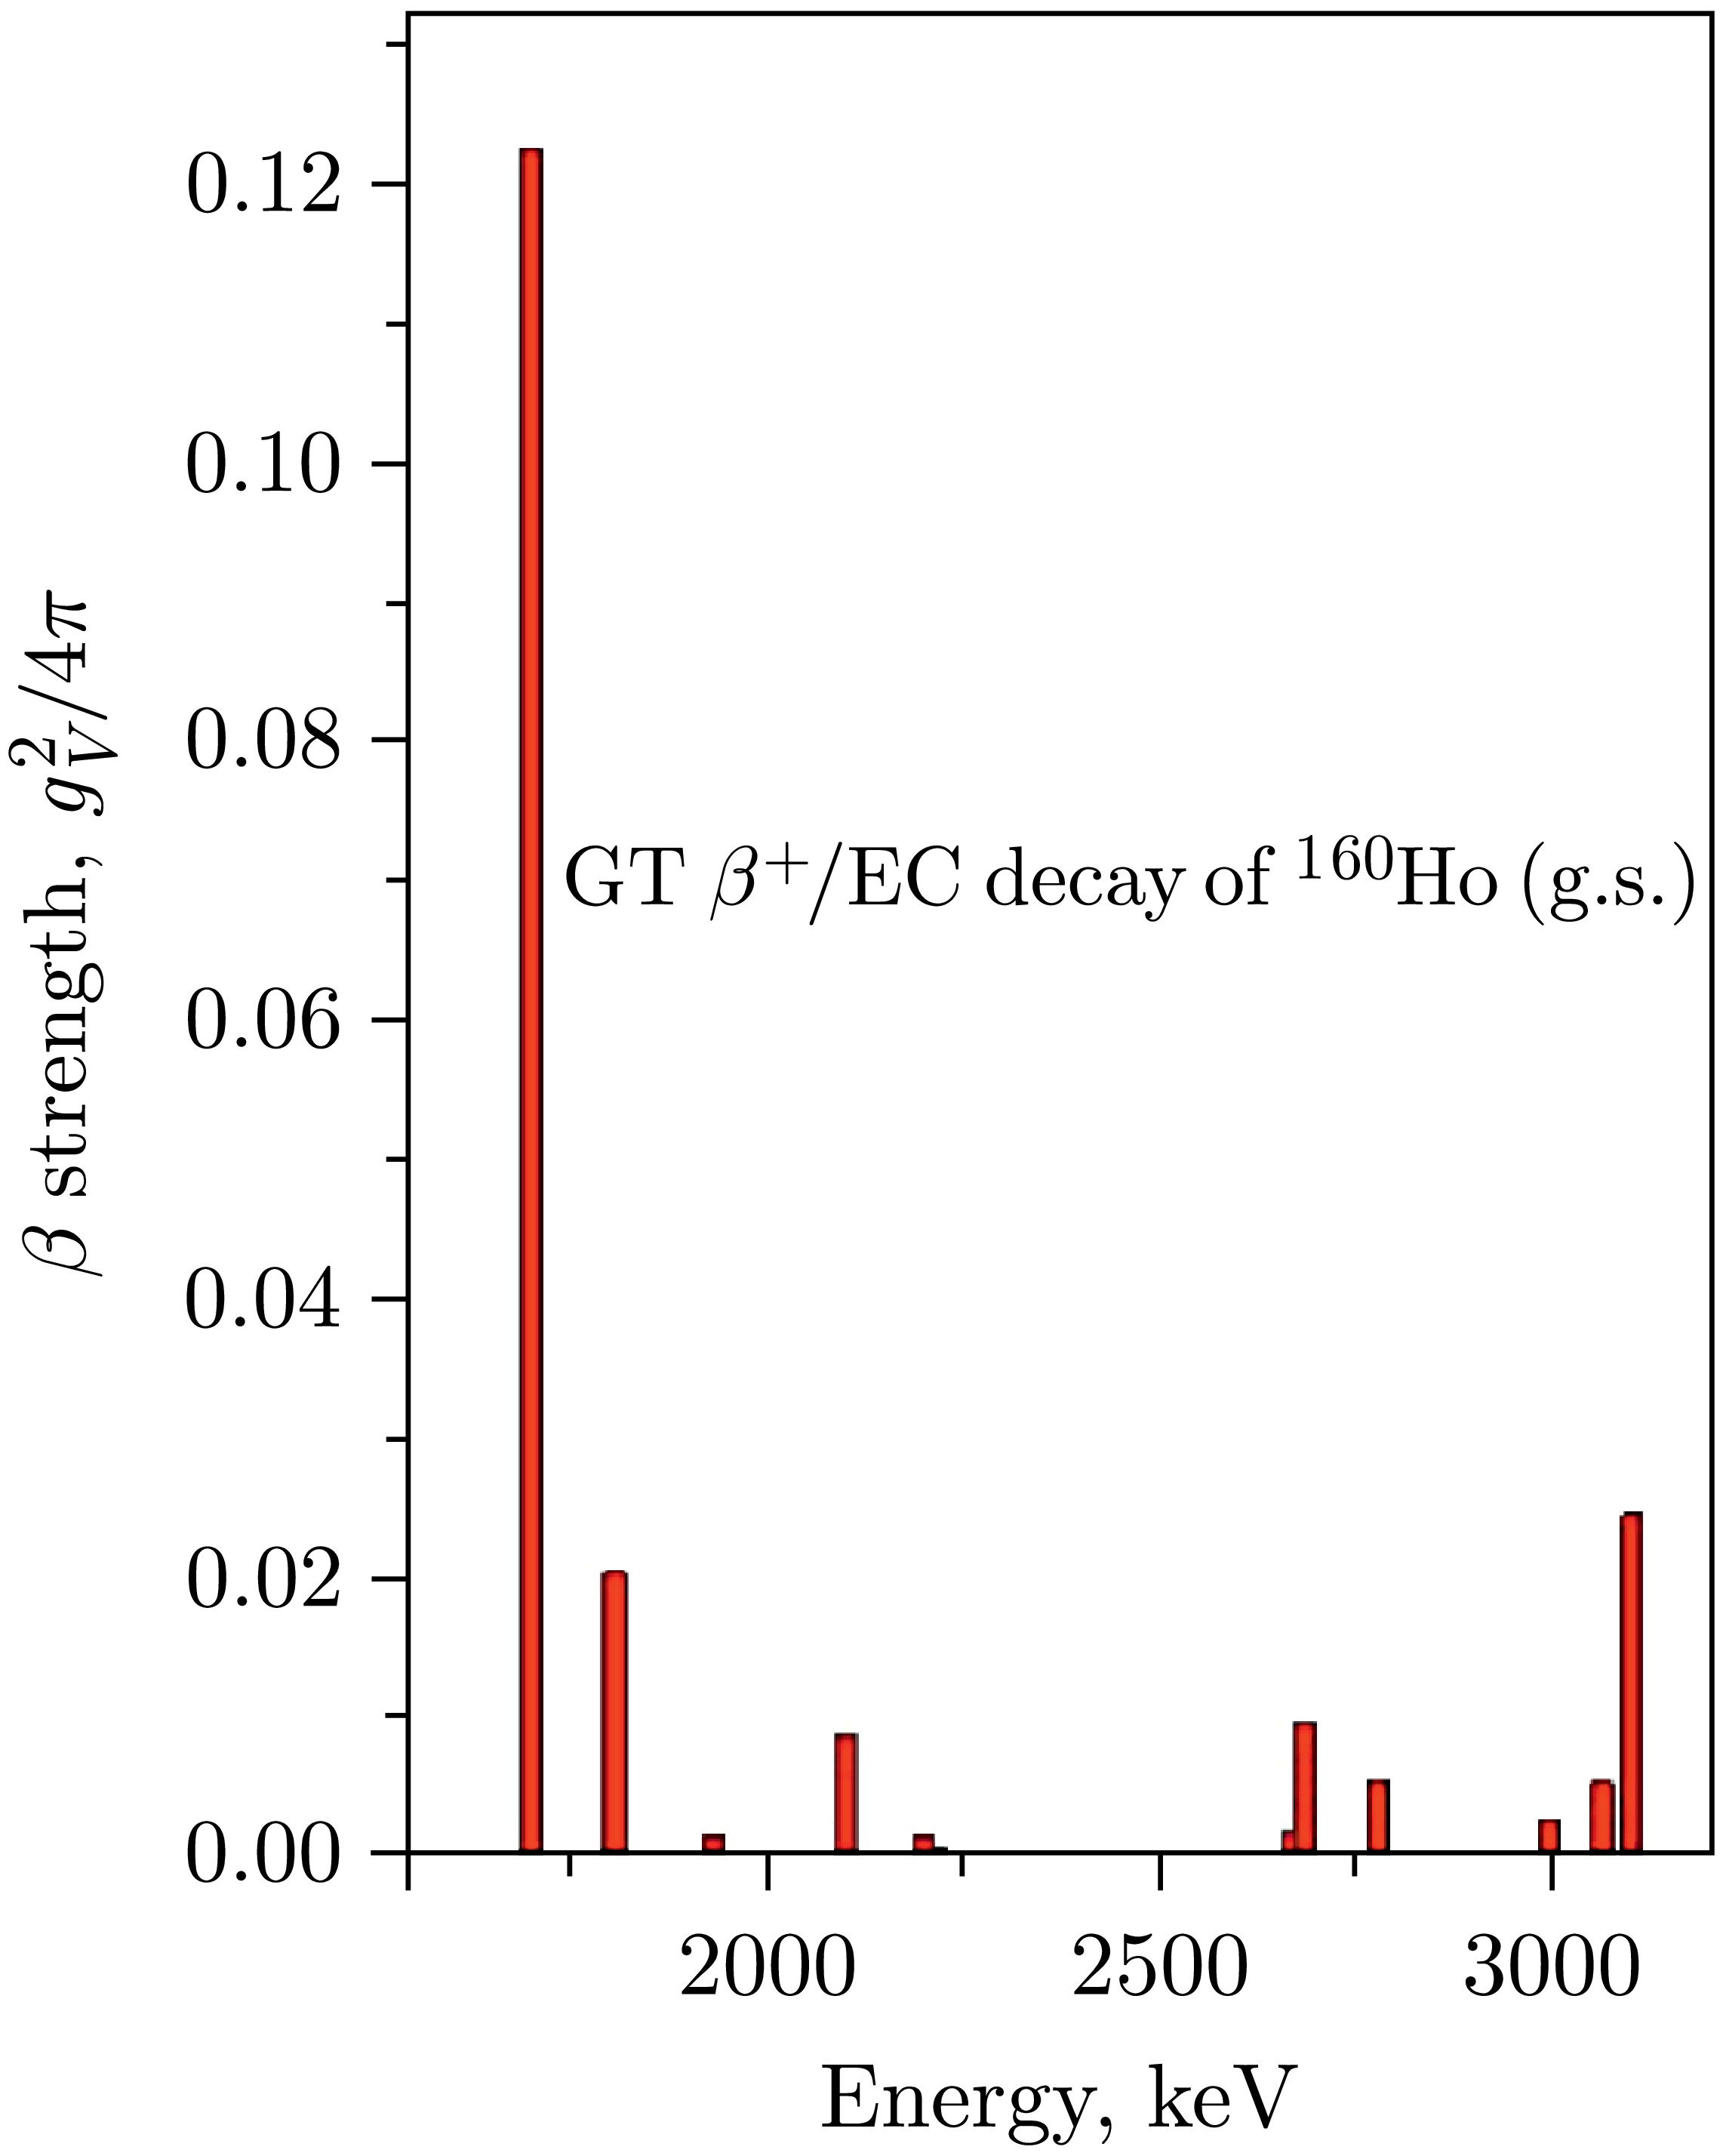
$ \langle E\rangle_{\gamma} = 2737 $ keV and for the β-type of spin-isospin oscillations (oscillations along the symmetry axis)$ \langle E\rangle _{\beta} = 1749 $ keV. Thus, the splitting due to anisotropy of spin–isospin density oscillations$\langle \langle E\rangle_{\gamma} - \langle E\rangle_{\beta} $ in the deformed nucleus$ ^{160} {\rm{Dy}}$ is about 1 MeV. When oscillations occur along the symmetry axis, the angular momentum projection on the axis is zero ($ \Delta K = 0 $ ), axial symmetry is not broken, and oscillations of this type do not lead to K-forbiddenness for GT β-transitions. Oscillations perpendicular to the symmetry axis break axial symmetry and have a non-zero angular momentum projection on the axis ($ \Delta K = \pm 1 $ for dipole oscillations,$ \Delta K = \pm 2 $ for quadrupole, etc.), which leads to K-forbiddenness for a number of$ \beta^{+} $ /EC-transitions and a decrease in intensity of the corresponding peak component in$ S_{\beta}(E) $ (Figs. 12 and 13). An important fact is that the amplitude of the higher energy peak is significantly less than that of the lower energy peak. Such a ratio of peak amplitudes arises due to K-forbiddenness of GT transitions for a prolate nucleus (quadrupole deformation parameter$ \beta _{2} \gt 0 $ ). No such peak splitting (Fig. 10) is observed in$ S_{\beta}(E) $ for GT$ \beta^{+} $ /EC-decay of the spherical nucleus$ ^{147g} {\rm{Tb}}$ [11, 31].
Charge-exchange particle-hole excitations populated by the β-decay are related to the oscillation of the
$ \mu_{\tau} = \pm 1 $ components of the isovector density [11, 31]$ \rho_{\tau = 1,\,\mu \tau} $ :$ \rho_{\tau = 1,\,\mu \tau}(r) = \Sigma_{k}\,2t_{\mu\tau}(k)\,\delta(r - r_{k}), $
(19) where the summation is taken over all nucleons k, and
$ t_{\mu \tau} $ is the spherical component of the nucleon isospin t:$ t_{\mu\tau} = \begin{cases} (1/2)^{1/2}(t_{x} - it_{y}), \quad \mu_{\tau} = -1, \\ t_{z}, \quad \mu_{\tau} = 0, \\ -(1/2)^{1/2}(t_{x} + it_{y}), \quad \mu_{\tau} = +1. \end{cases} $
(20) Oscillations with
$ \tau = $ 0 correspond to oscillations of the isoscalar (total) density. Oscillations with$ \tau = 1 $ ,$ \mu_{\tau} = 0 $ ,$ I^{\pi} = 1^{-} $ correspond to oscillations of the component$ \rho_{\tau,\,\mu = 1,\,0} $ of isovector density and describe oscillations of protons and neutrons moving out of phase (oscillations of neutrons relative to protons), and deformation leads to splitting of the$ E1 $ giant dipole resonance (GDR) peak [32]. Oscillations with$ \tau = 1 $ ,$ \mu_{\tau} = \pm 1 $ describe$ \beta^{+}/ $ EC- (oscillations of proton holes relative to neutrons) and$ \beta^{-} $ -decays (oscillations of protons relative to neutron holes), and peaks in$ S_{\beta}(E) $ for deformed nuclei should also be split [11, 31]. The splitting of the peak in the strength function (Fig. 13) for GT$ \beta^{+}/ $ EC-decay of the deformed nucleus$ ^{160g} {\rm{Ho}}$ was experimentally observed, corresponding to anisotropy in oscillations of the isovector density component$ \rho_{\tau,\,\mu = 1,\,1} $ . Anisotropy of spin-isospin density oscillations leads to the energy difference$ \langle E\rangle_{\gamma} - \langle E\rangle_{\beta} $ between oscillations of proton holes relative to neutron particles perpendicular to the symmetry axis and along the symmetry axis, which is about 1 MeV in the deformed nucleus$ ^{160} {\rm{Dy}}$ . The amplitudes of isovector density oscillations are tensors not only in isospace and orbital space, leading to splitting of the GDR resonance in deformed nuclei, but also in spin space, leading to splitting of peaks in$ S_{\beta}(E) $ in deformed nuclei.For FF
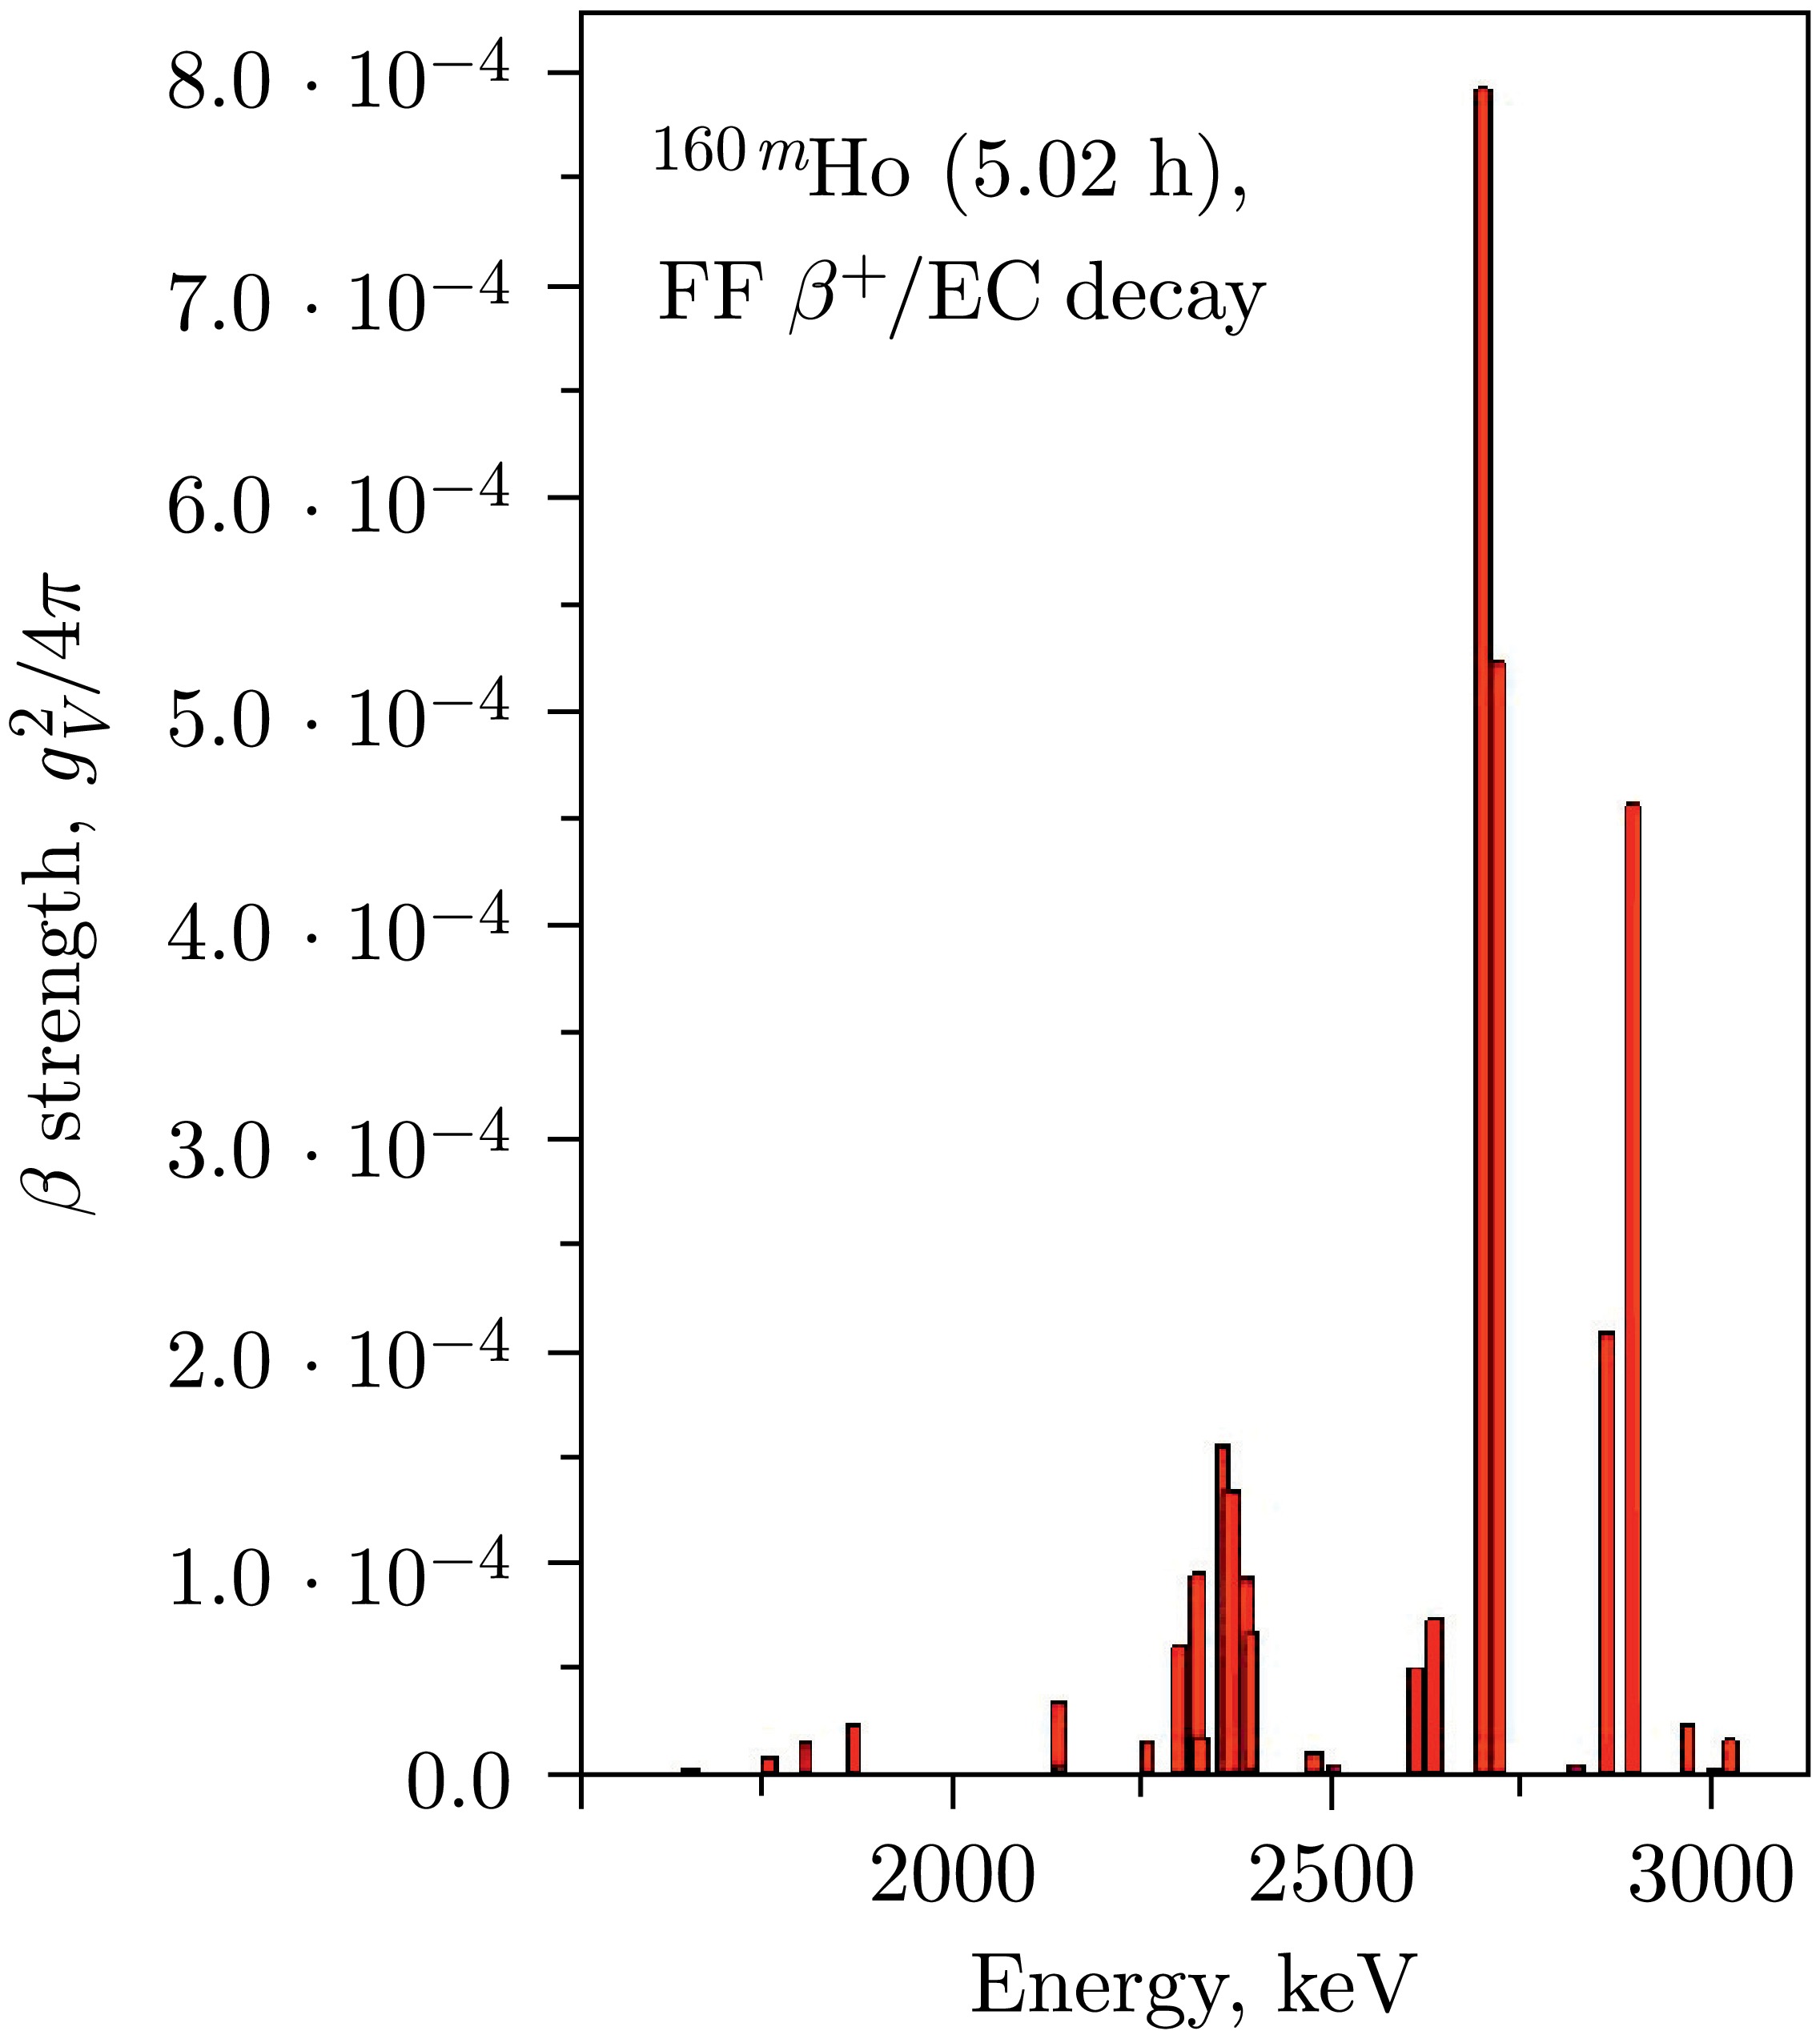
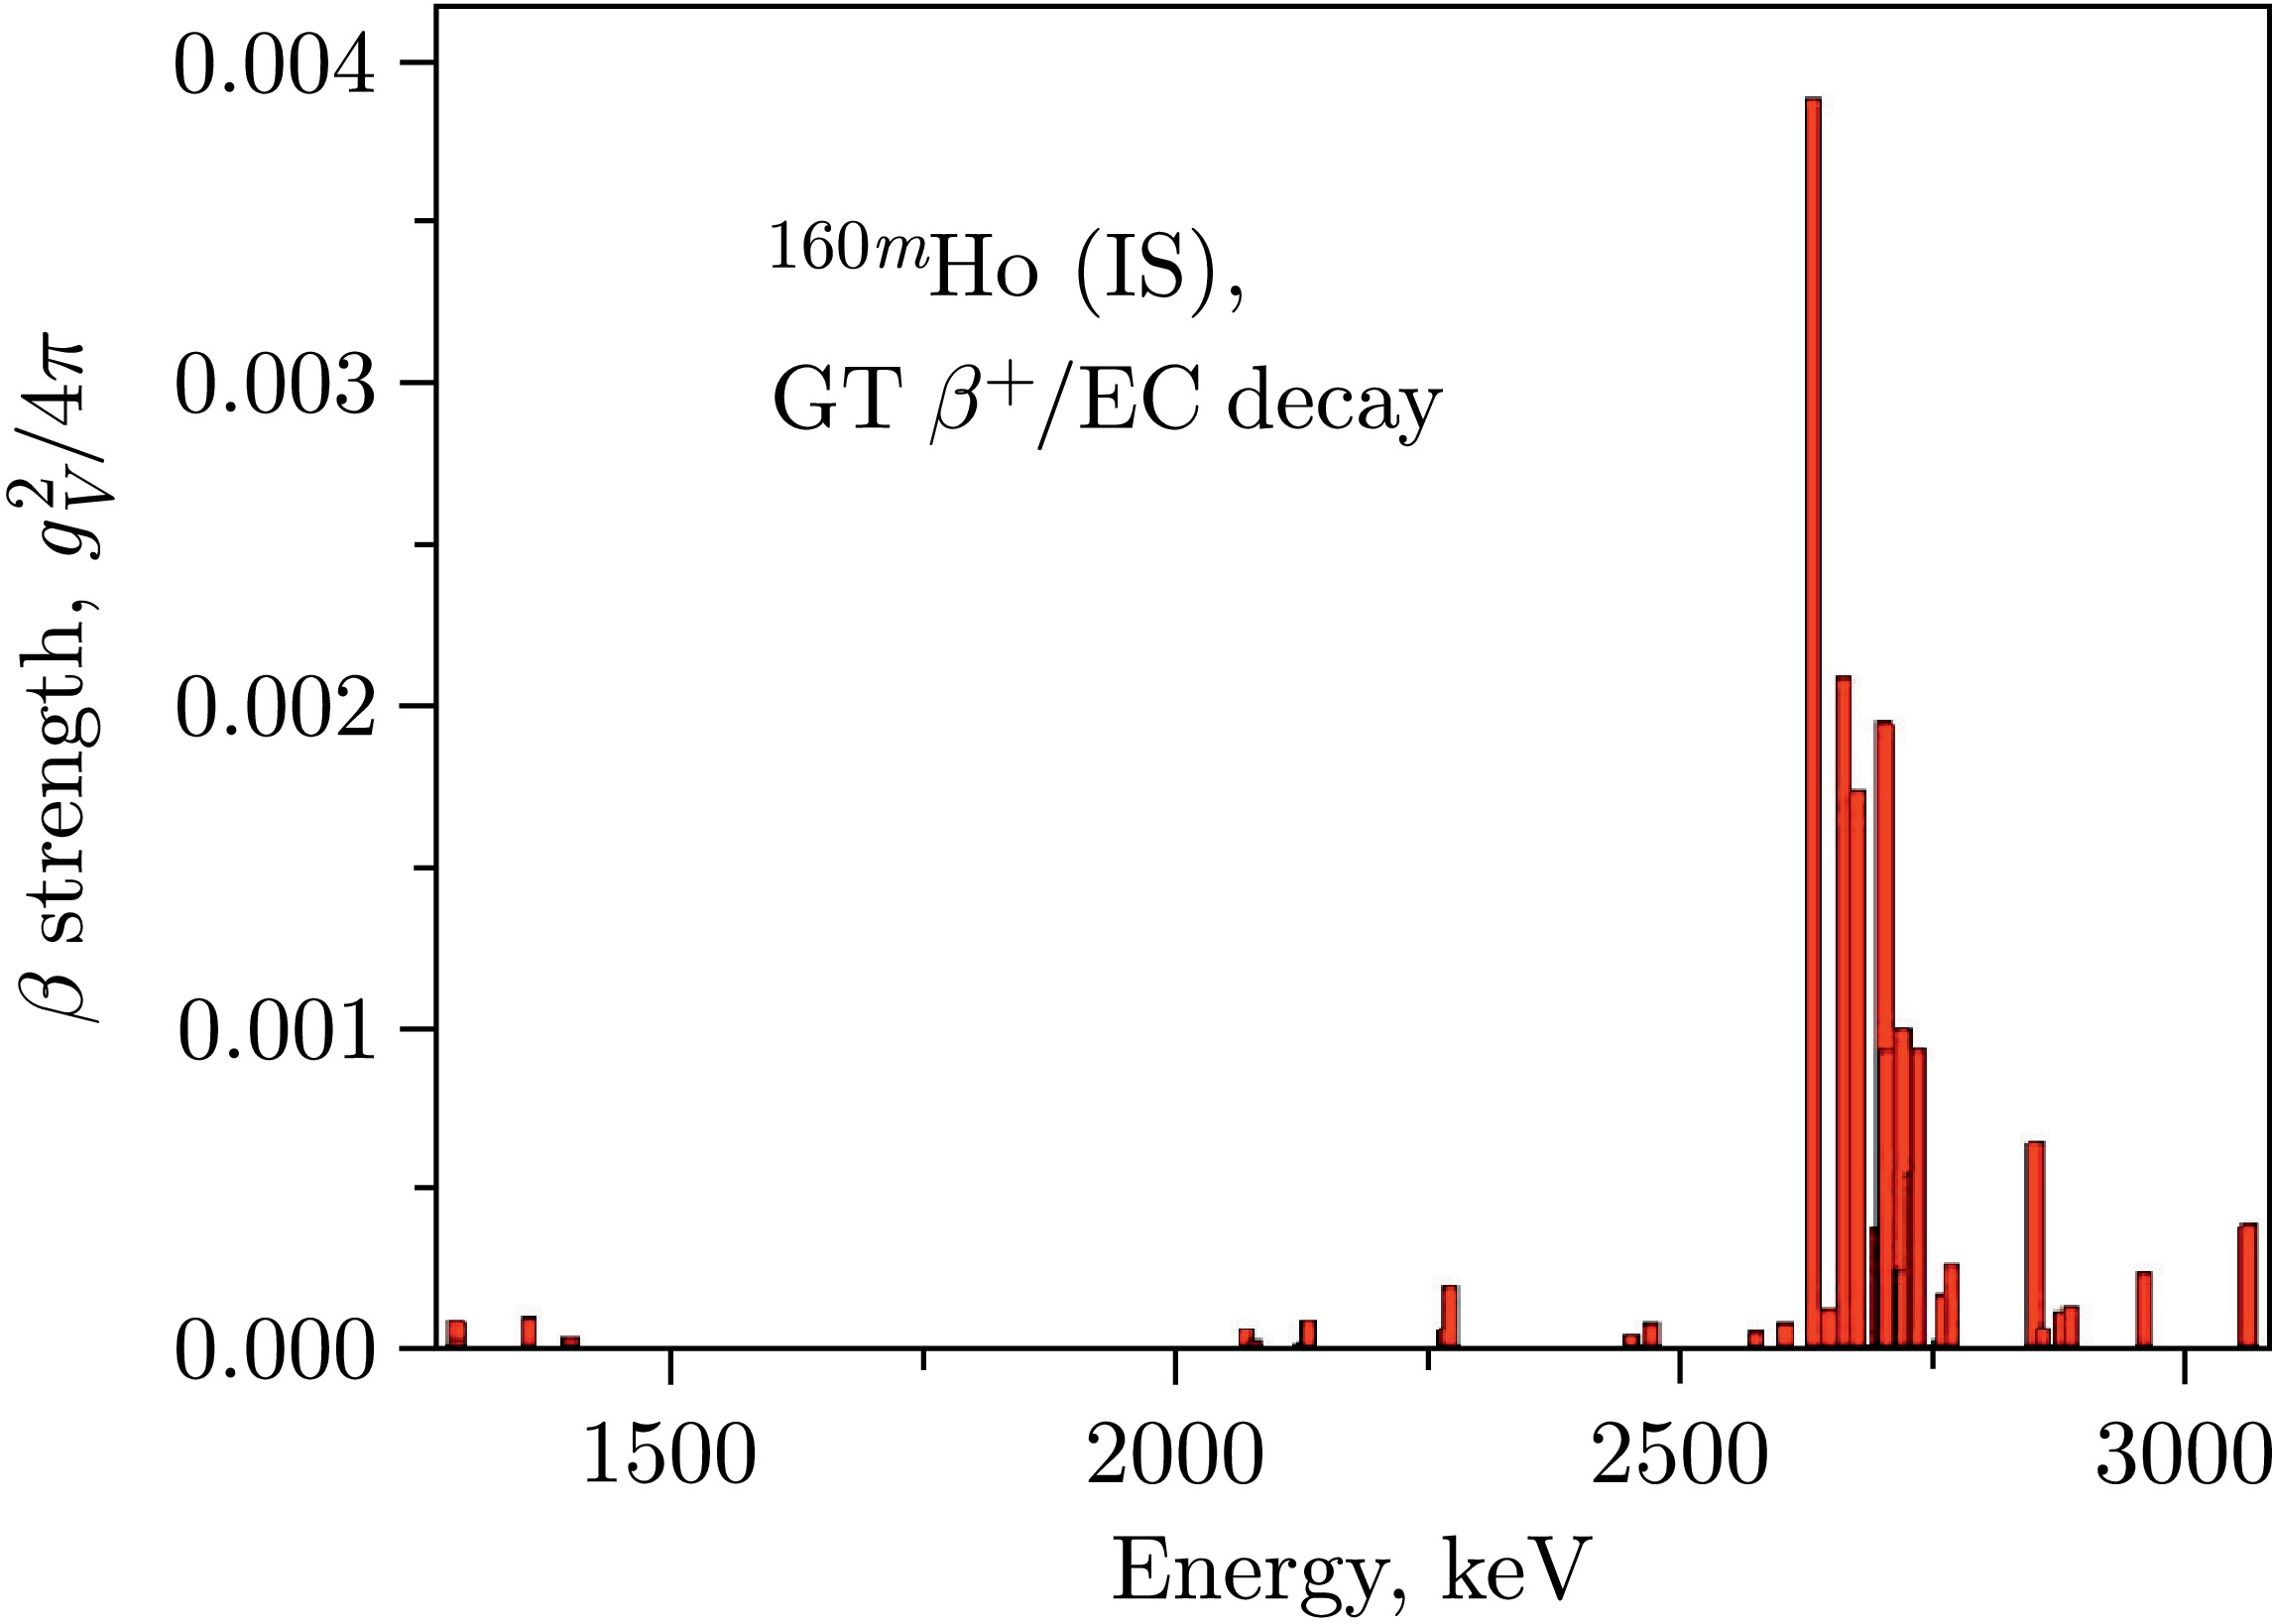
$ \beta^{+} $ /EC-transitions in the ξ-approximation (Coulomb approximation), important configurations are proton hole – neutron particle type configurations, coupled to angular momentum$ 0^{-} $ or$ 1^{-} $ :$ [\nu p \times \pi h] $ . The question of the presence or absence of resonant structure in strength functions for first-forbidden$ \beta^{-} $ -or$ \beta^{+} $ /EC-transitions long remained open. In [11−13], it was experimentally established that$ \beta^{-} $ for FF$ \beta^{+} $ /EC-decays of$ ^{160g} {\rm{Ho}}$ (Fig. 14) and the isomer$ ^{160m} {\rm{Ho}}$ (Fig. 15) has a resonant structure. The fine structure of the resonance in GT$ \beta^{+} $ /EC-decay of the isomer$ ^{160m} {\rm{Ho}}$ [11−13] was also observed (Fig. 16).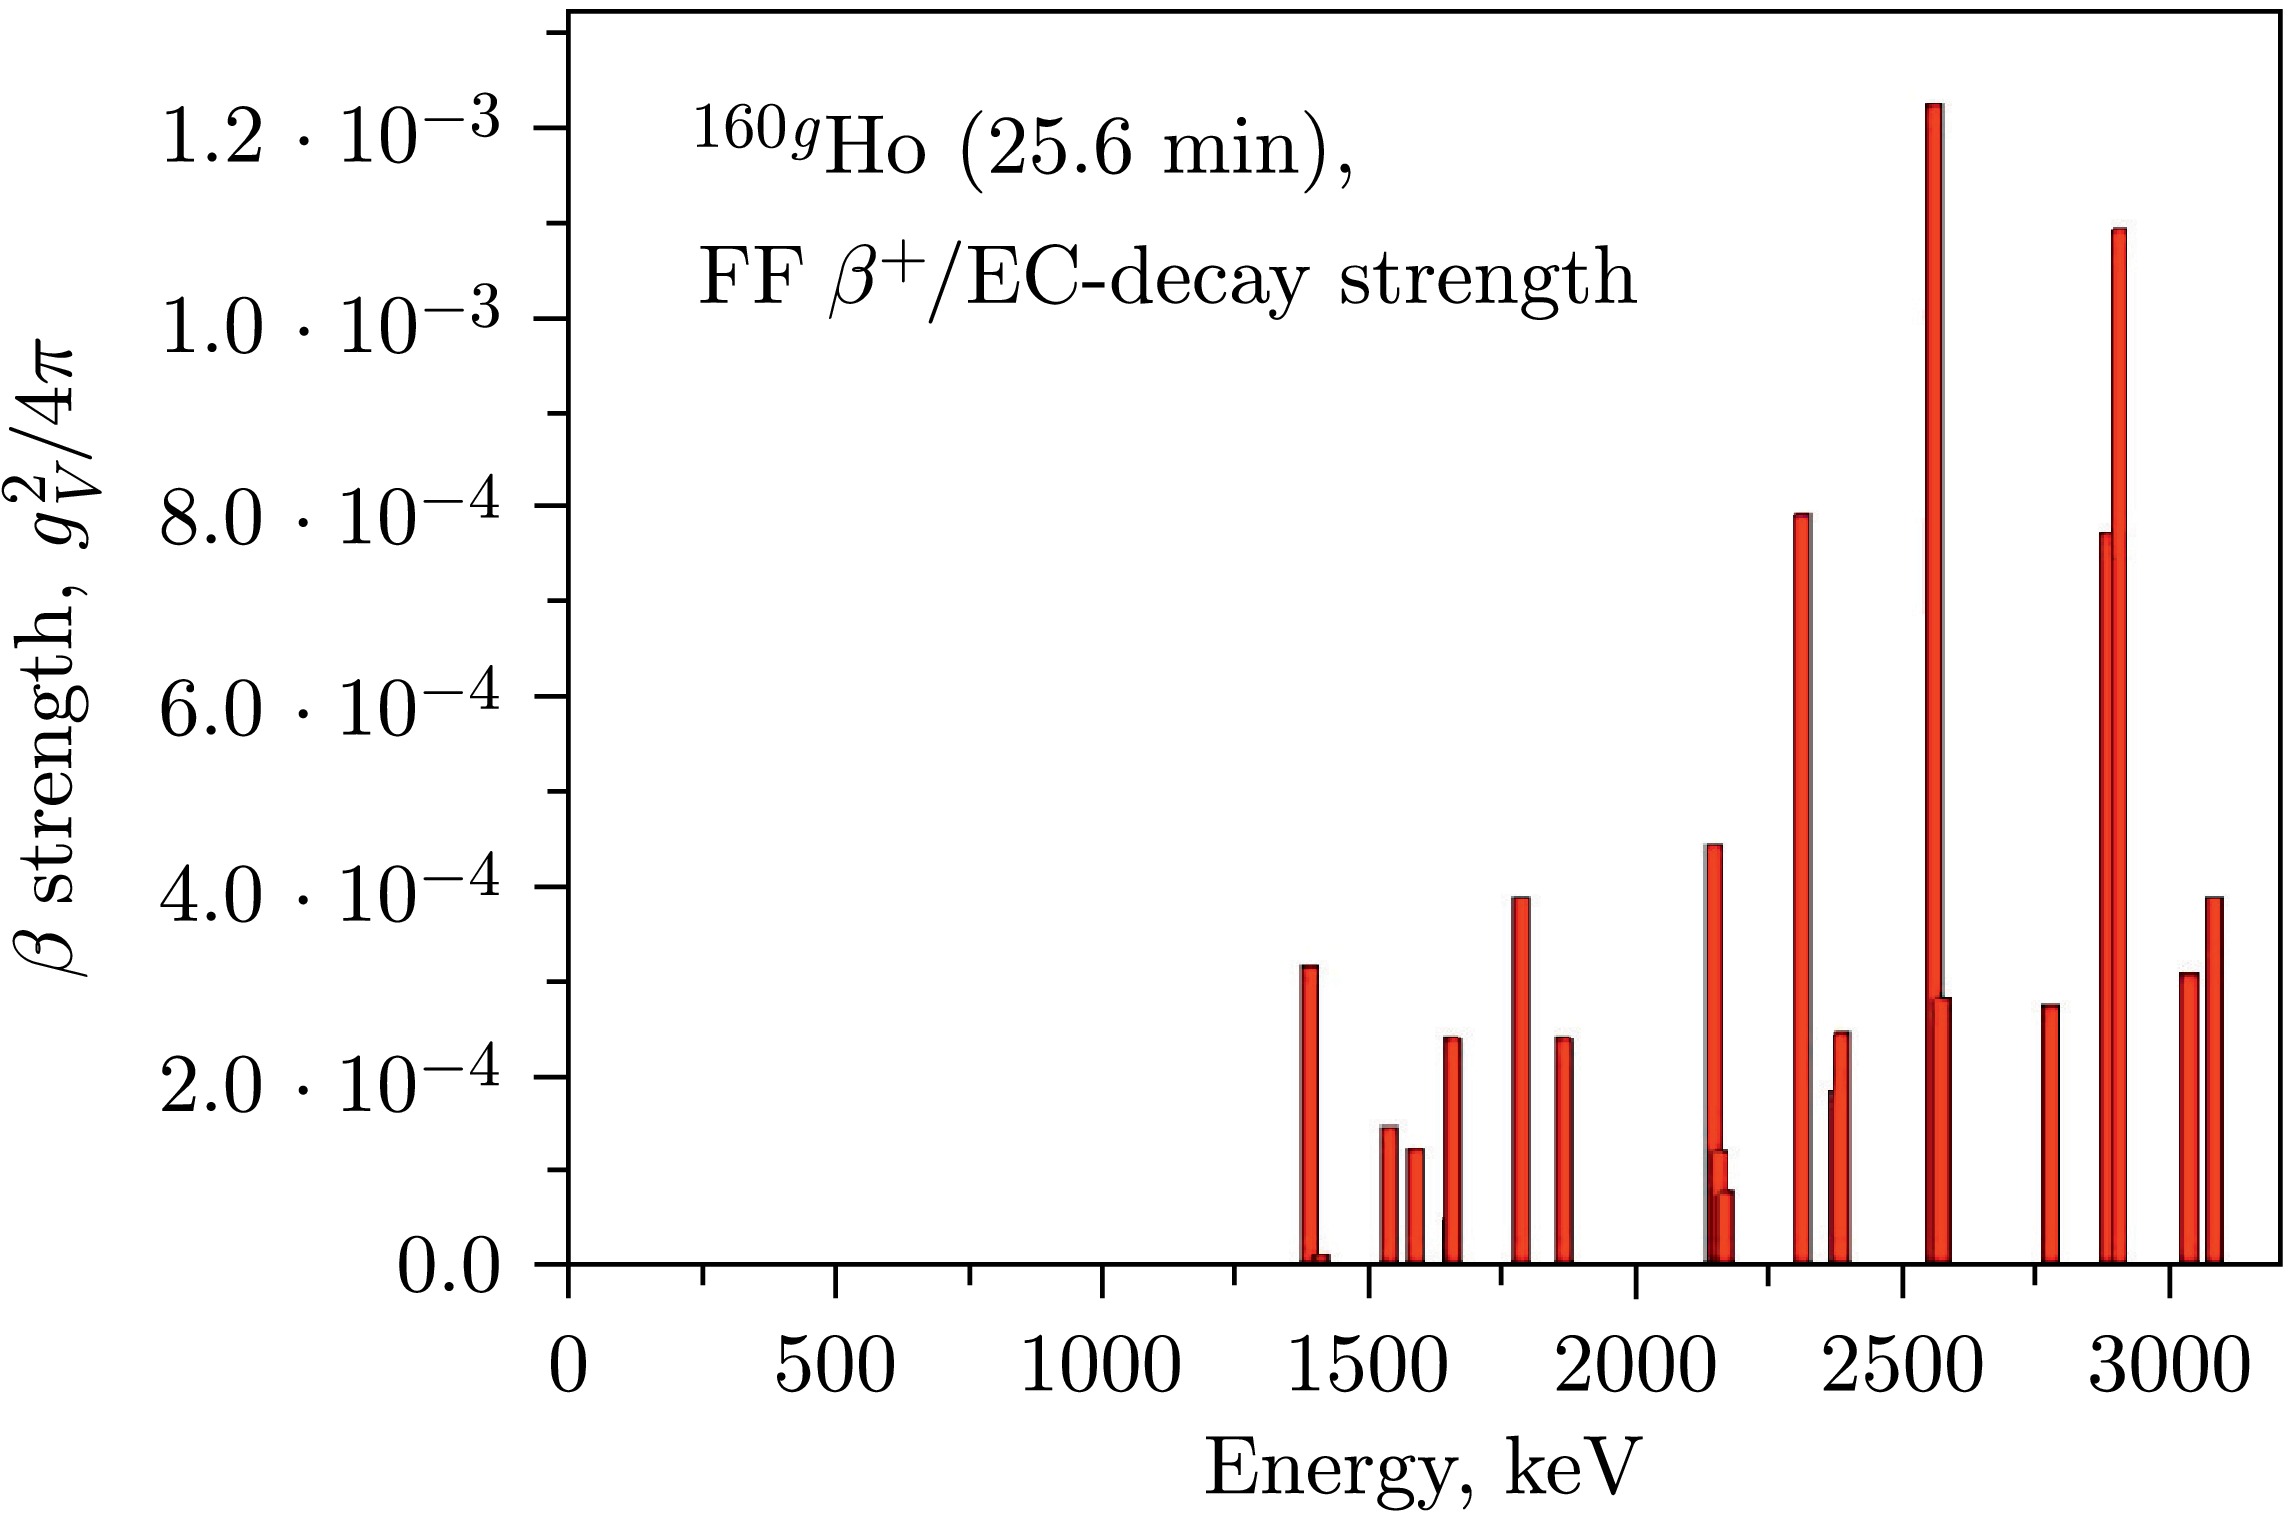
The resonant nature of
$ S_{\beta}(E) $ for GT and FF transitions in spherical, transitional, and deformed nuclei has been experimentally proven. The fine structure of resonances in$ S_{\beta}(E) $ has been measured (Figs. 9-–17). Strong configuration mixing at high excitation energies and high level densities should lead to the disappearance of resonant structure in strength functions$ S_{\beta}(E) $ . Approximate symmetry of nuclear interaction hinders mixing of some configurations. For configurations populated by GT$ \beta^{+} $ /EC-transitions, mixing is weaker due to partial spin-isospin$ SU(4) $ symmetry of the interaction inside the nucleus [4, 6, 11]. For FF$ \beta^{+} $ /EC-transitions, resonant structure [11−13] has also been observed in the strength function$ S_{\beta}(E) $ (Figs. 14 and 15). The resonant structure of the strength function for FF$ \beta^{+} $ /EC-transitions may indicate that the interaction in the nucleus is characterized by some partial symmetry. This means that configurations populated by first-forbidden transitions are also distinguished by approximate quantum numbers among neighboring levels of the daughter nucleus, and strong configuration mixing does not occur. The type of such symmetry corresponding to the first forbiddenness is currently an open question.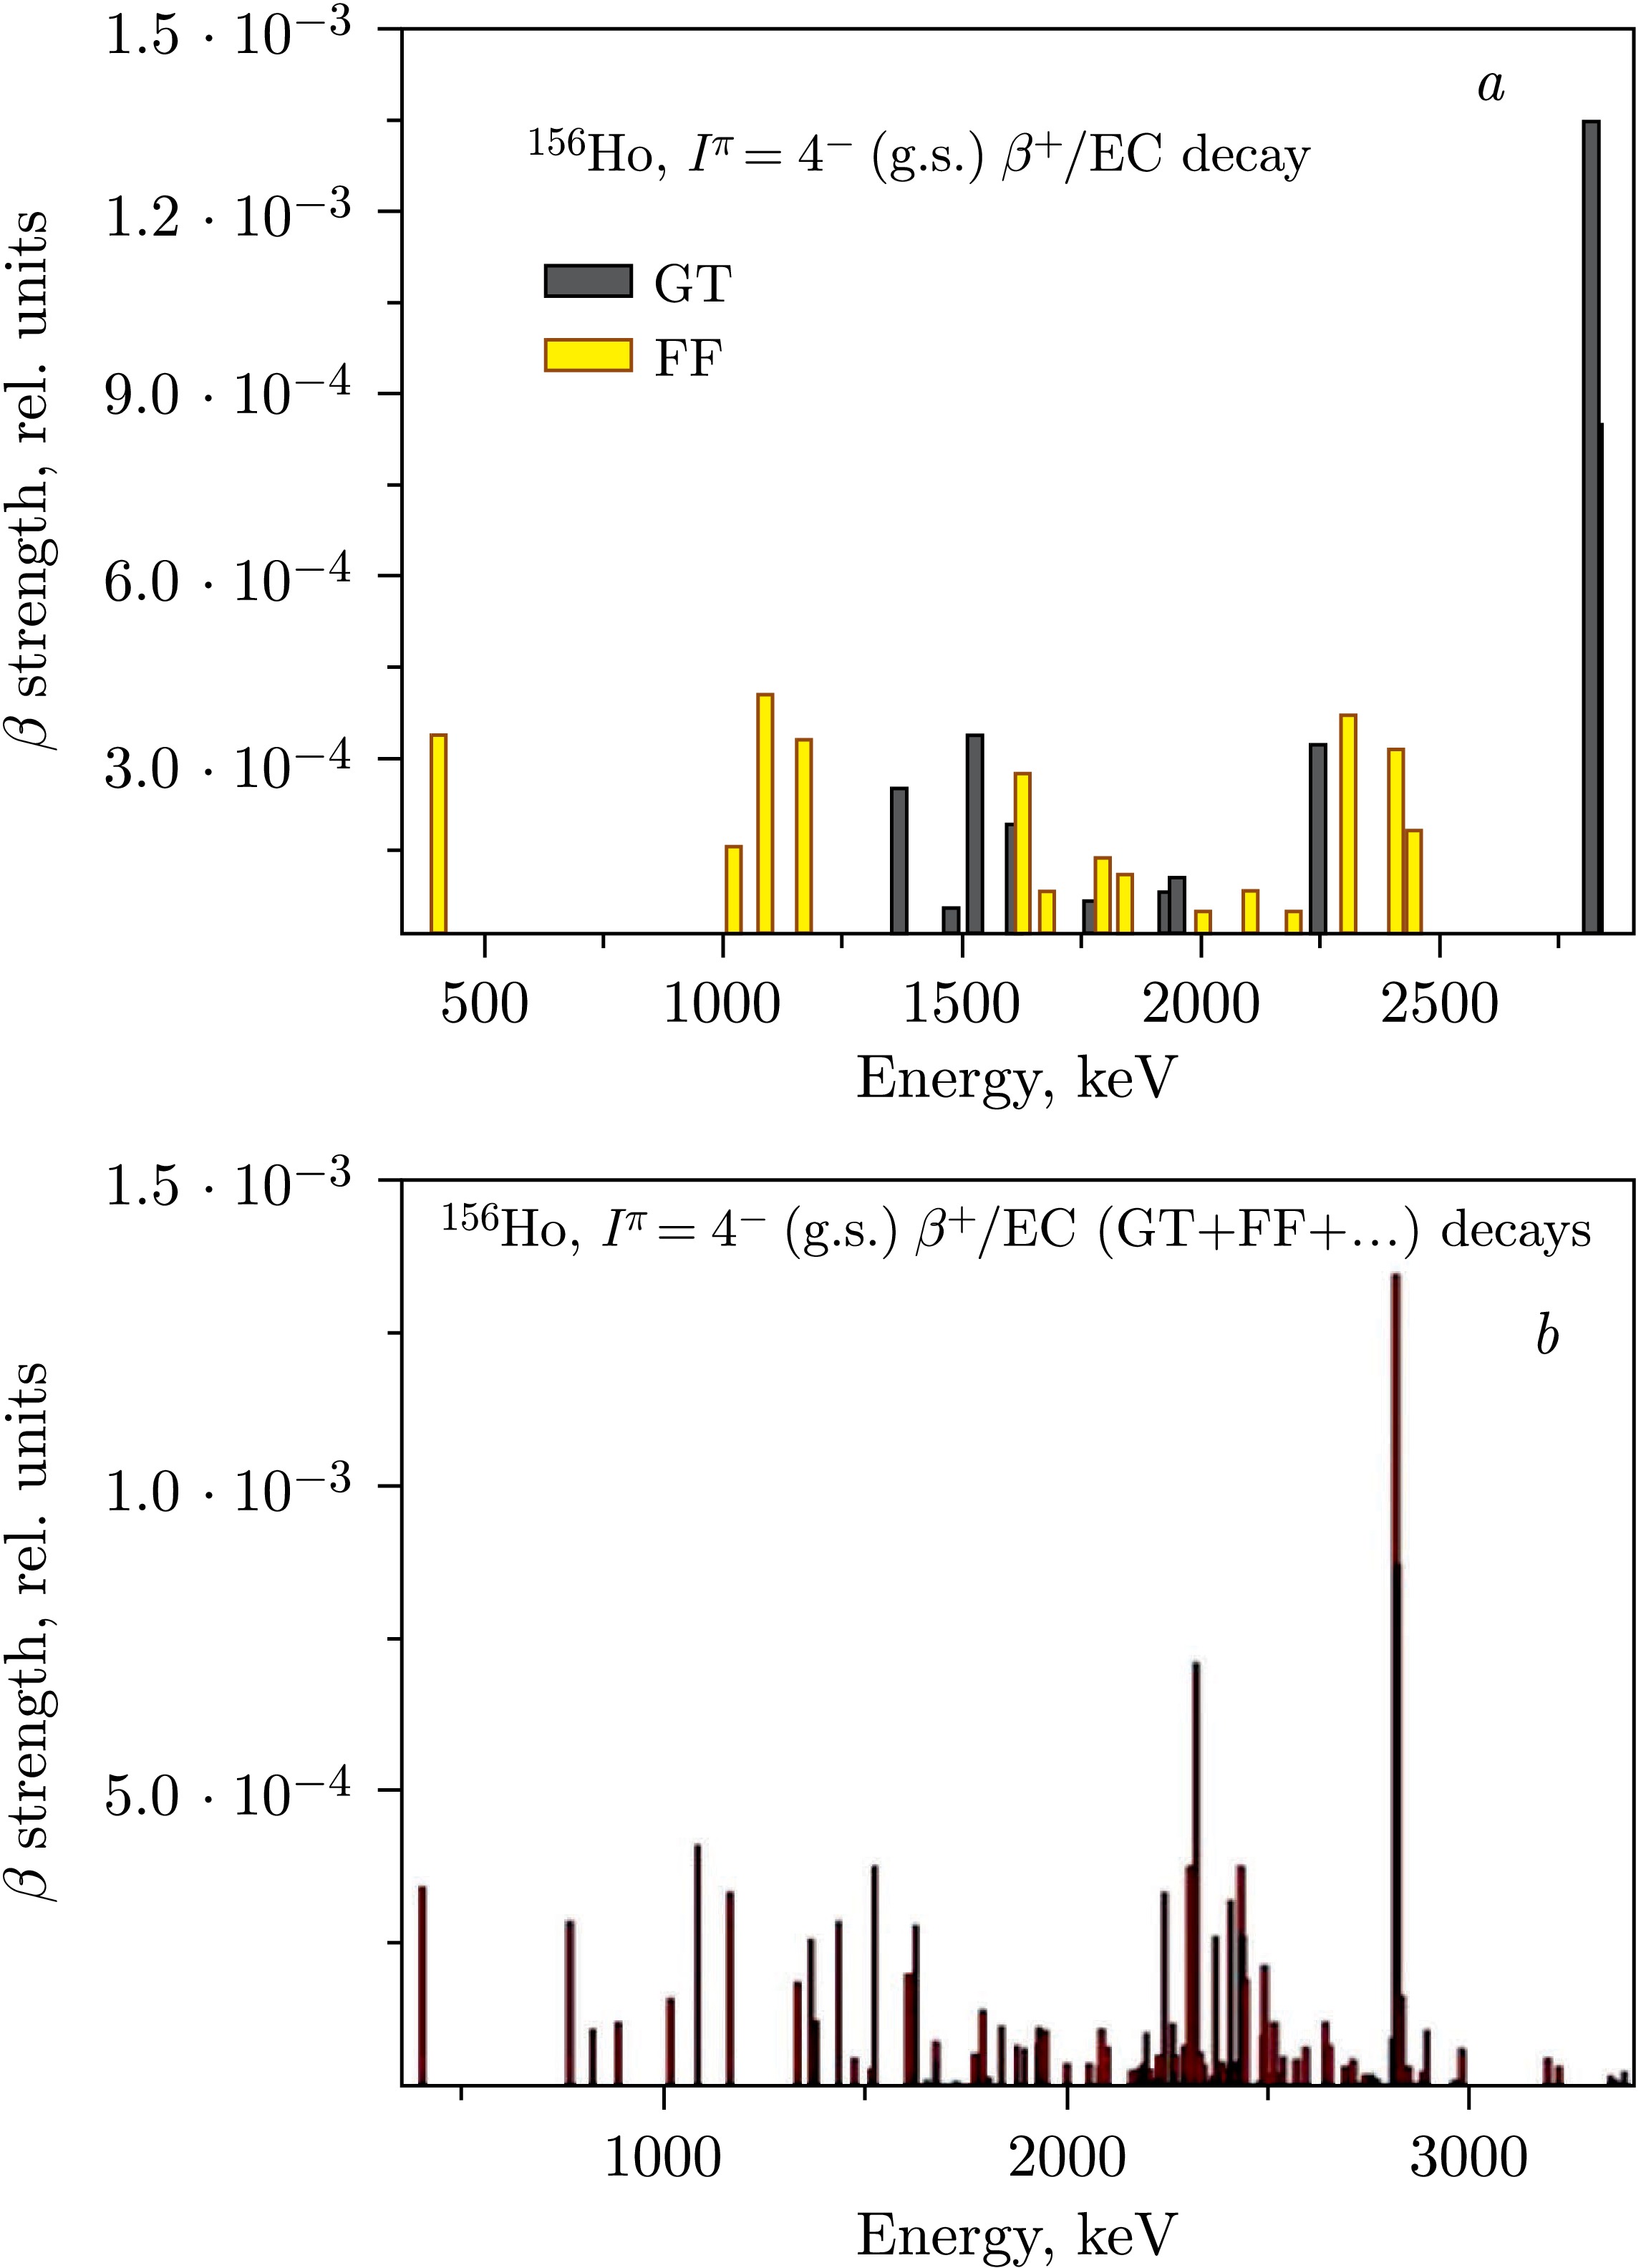
Figure 17. (color online) Fine structure of the
$ S_{\beta}(E) $ for the GT and FF$ \beta^{+} $ /EC-decay of transitional nuclei$ ^{156g} {\rm{Ho}}$ ($ T_{1/2} = 56 $ min,$ Q_{\text {EC}} = 5.05 $ MeV) [30]. a) Components of$ S_{\beta}(E) $ for which it was possible to determine the type (GT or FF) of$ \beta^{+} $ /EC-decays; b) all observed$ S_{\beta}(E) $ componentsSince there is insufficient data to find the fine structure of
$ S_{\beta}(E) $ at excitation energies of$ ^{156} {\rm{Dy}}$ above 3 MeV, Fig. 17 presents$ S_{\beta}(E) $ in relative units. At an excitation energy of 2.8 MeV, a resonance is observed in$ S_{\beta}(E) $ . The total absorption γ-ray spectrum (TAGS) (Fig. 7) also indicates the presence of a peak in$ S_{\beta}(E) $ in the aforementioned excitation energy region. For some energy regions, the intensities of FF$ \beta^{+} $ /EC-transitions are comparable to those for Gamow–Teller transitions (Fig. 17). -
The previously dominant statistical model [26] assumed that there are no resonances in
$ S_{\beta}(E) $ within the$ Q_{\beta} $ window, and the relations$ S_{\beta}(E) = {\text {const}} $ or$ S_{\beta}(E) \sim \rho (E) $ , where$ \rho (E) $ is the level density of the daughter nucleus, were considered good approximations for medium and heavy nuclei at excitation energies$ E \gt 2{-}3 $ MeV. Concepts of the non-statistical structure of strength functions$ S_{\beta}(E) $ have proven important for a wide range of nuclear physics areas, including the description of delayed processes taking into account the structure of$ S_{\beta}(E) $ [1−4]. For correct analysis of beta-delayed process probabilities$ P_{\beta d} $ (Fig. 18), information is needed on the positions, intensities, widths, and fine structure of peaks in$ S_{\beta}(E) $ [1−6, 11].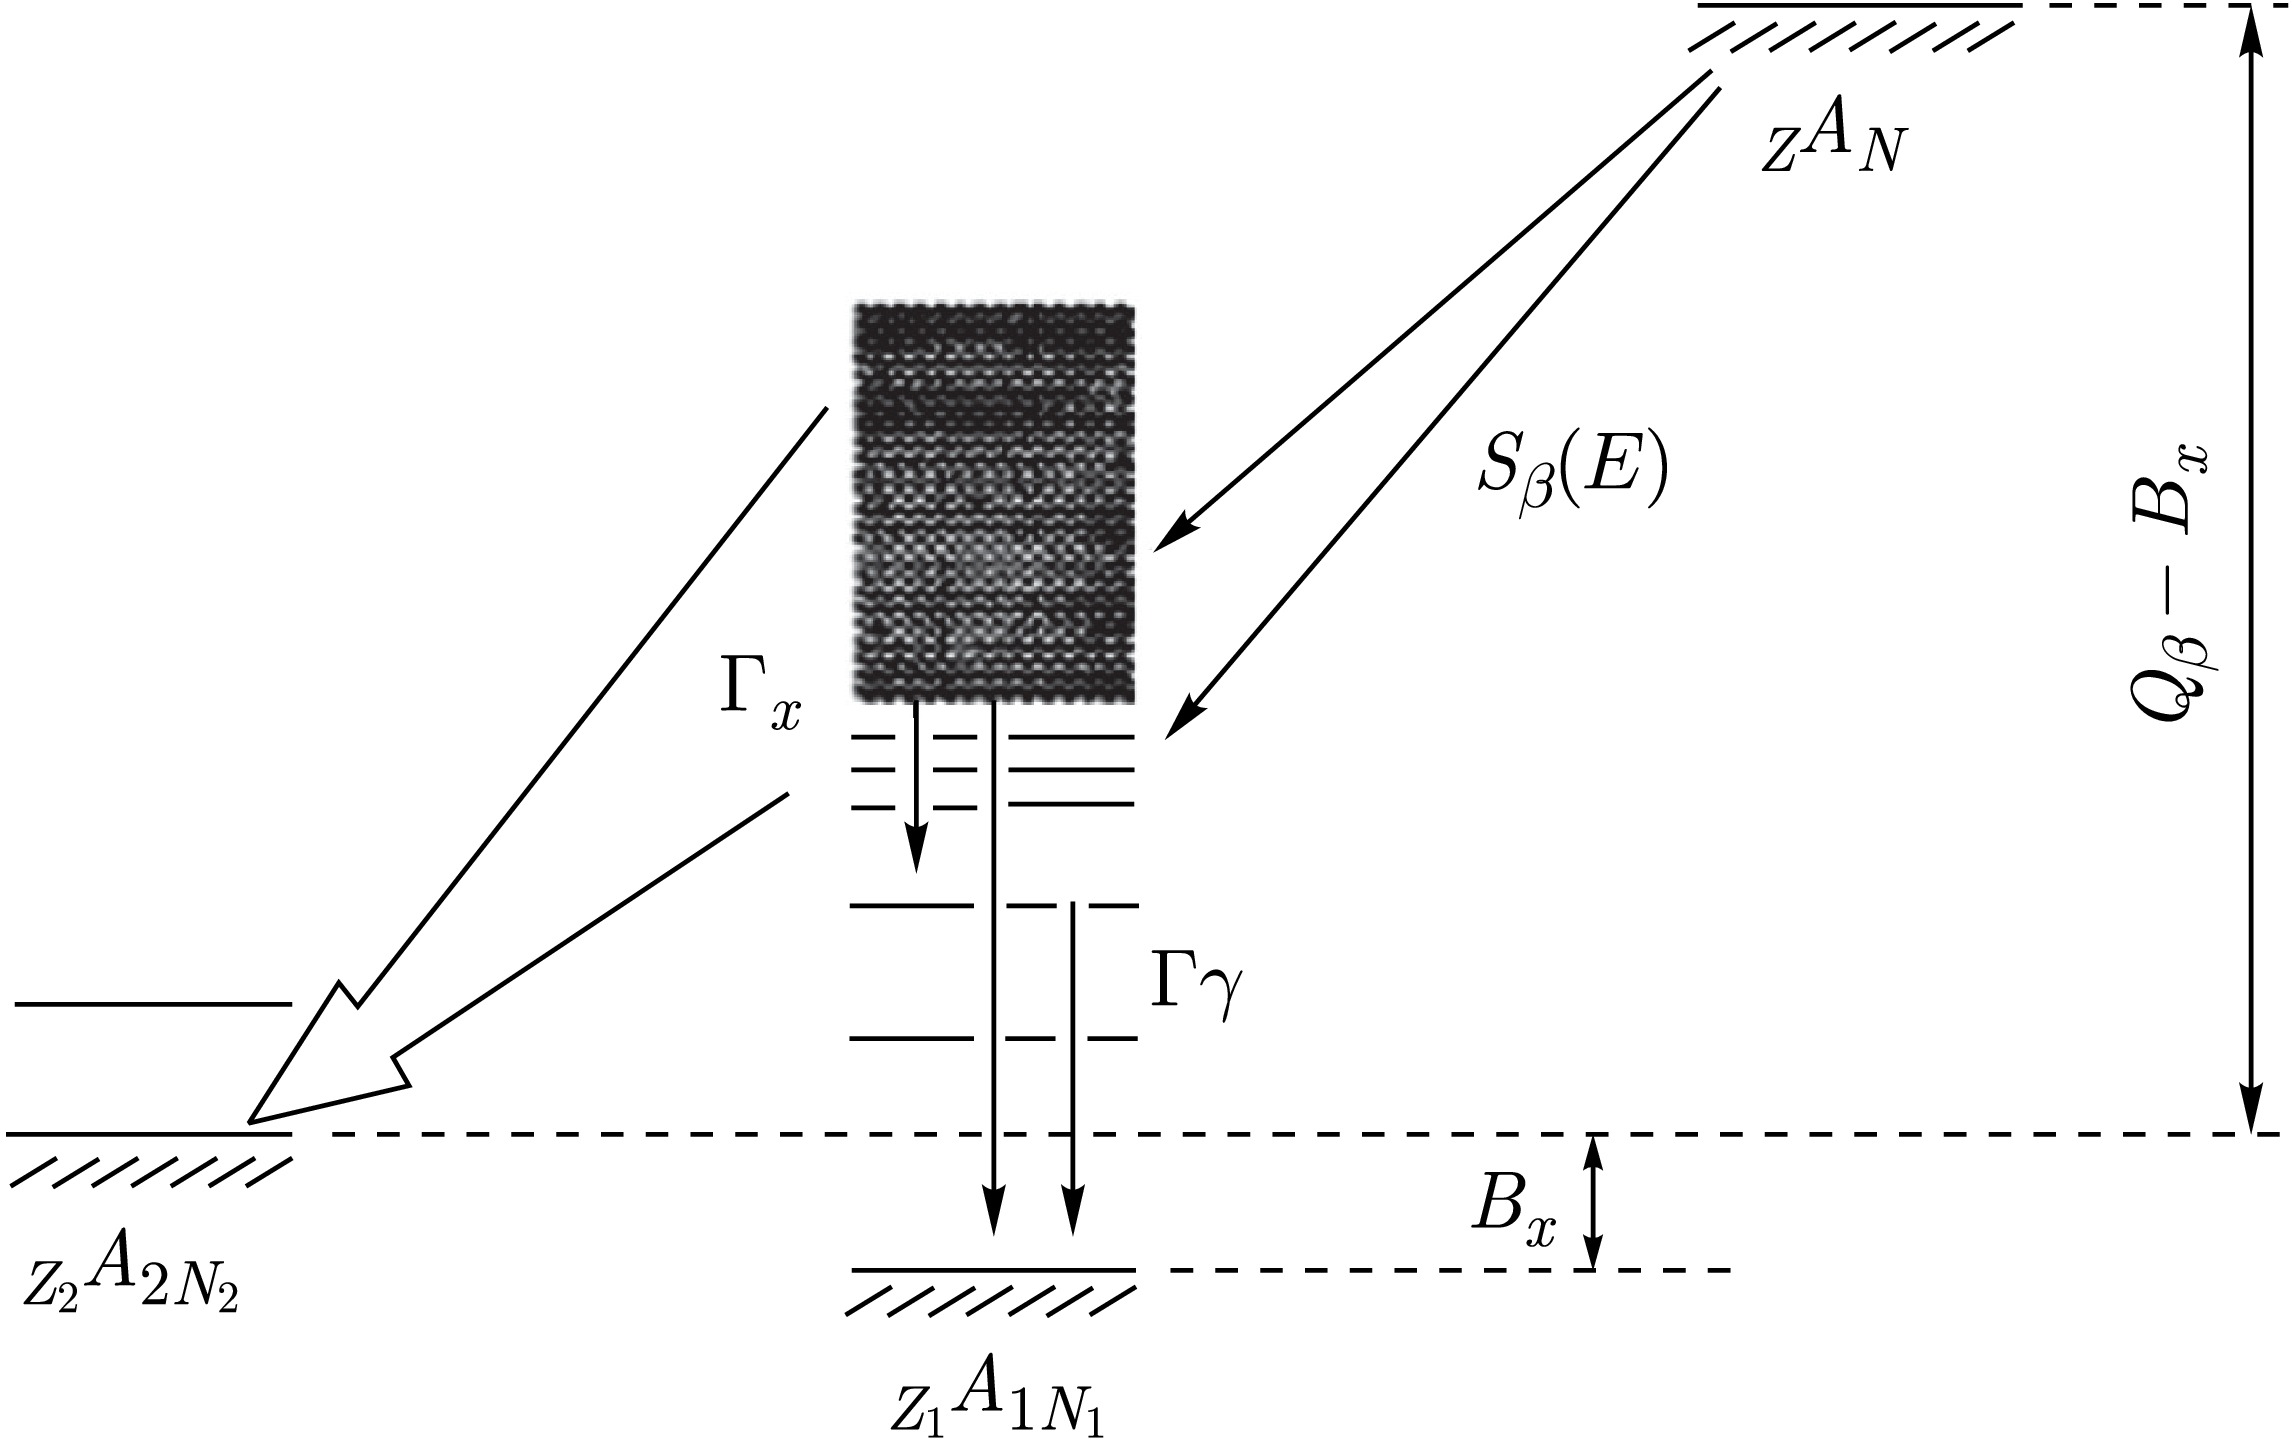
Figure 18. Scheme of delayed particle emission.
$ B_{x} $ is the binding energy of the particle emitted after the β-decay,$ Q_{\beta} $ is the total β-decay energy,$ \Gamma_{x} $ is the width of the decay channel with emission of a delayed particleThe probability of β-delayed processes
$ P_{\beta d} $ is defined as follows [1–6, 11, 33–42]:$ P_{\beta d} = \frac{\int\limits_0^{Q_{\beta}} {S_{\beta }(E)\,f(Q_{\beta}-E)\Gamma_{d}(E)/\Gamma_{\text{tot}}(E)\,dE}}{\int\limits_0^{Q_{\beta}} {S_{\beta}(E)\,f(Q_{\beta}-E)\,dE}}, $
(21) where
$ \Gamma_{d}(E) $ is the width of the delayed process, and$ \Gamma_{\text{tot}}(E) $ is the total width. Since for calculating$ P_{\beta d} $ , the energy and relative intensities of peaks$ S_{\beta}(E) $ must be known, theory often gives rather correct values of$ P_{\beta d} $ . However, when only the "tail" of an$ S_{\beta}(E) $ peak falls into the energetically allowed region$ Q_{\beta} $ , theoretical calculation gives the correct result only when the fine structure of$ S_{\beta}(E) $ is taken into account [1−4]. The most significant excitation energy region in the daughter nucleus [11] is from$ E_{\text {thr}} $ to$ Q_{\beta} $ , where$ E_{\text {thr}} = E_{\text {II}} $ for delayed fission,$ E_{\text {II}} $ is the energy of the minimum in the second potential well for a double-humped fission barrier,$ E_{\text {thr}} \approx B_{n} $ for delayed neutrons,$ B_{n} $ is the neutron binding energy,$ E_{\text {thr}} = B_{p} + E_{po} + q $ for delayed protons,$ B_{p} $ is the proton binding energy,$ E_{po} $ is the excitation energy at which the probability of proton emission is comparable to that of γ-radiation, and$ q \approx 1{-}2 $ MeV. Due to the influence of the Coulomb barrier, the width of the proton emission channel will be a sharp function of the proton energy. To obtain a detectable intensity of delayed protons and to reveal the structure of the$ \beta^{+}/ $ EC-decay strength function, it is necessary to introduce the corresponding terms$ E_{po} $ and q [4, 50]. To obtain a detectable intensity of delayed alpha particles, the corresponding value is$ E_{\text {thr}} = B_{\alpha} + E_{{\alpha}o} + q $ , where$ B_{\alpha} $ is the binding energy of the α-particle in the daughter nucleus, and$ E_{{\alpha}o} $ is the energy of the α-particle at which the probability of α-particle emission becomes comparable to that of γ-decay, and q does not exceed 1–2 MeV. For the probability of delayed fission and emission of delayed protons and alpha particles, the structure of$ S_{\beta}(E) $ in the excitation energy region from$ E_{\text {thr}} $ to$ Q_{\beta} $ is very important. For the probability of delayed neutron emission, the integral quantity$ S_{\beta}(E) $ in the region from$ E_{\text {thr}} $ to$ Q_{\beta} $ is substantial.$ P_{\beta d} = \frac{\int\limits_{E_{\text {thr}}}^{Q_{\beta}} {S_{\beta}(E)\,f(Q_{\beta}-E)\Gamma_{d}(E)/\Gamma_{\text{tot}}(E)\,dE}}{\int\limits_0^{Q_{\beta}} {S_{\beta}(E)\,f(Q_{\beta}-E)\,dE}}. $
(22) Naturally, for the analysis of delayed particle spectra, the structure of
$ S_{\beta}(E) $ is always important. When a peak in$ S_{\beta}(E) $ is near$ Q_{\beta} $ (Fig. 19, a) or$ E_{\text {thr}} $ (Fig. 19, b), information about the fine structure of$ S_{\beta}(E) $ is very important for correct calculation of$ P_{\beta d} $ . For processes of delayed proton and alpha particle emission and delayed fission Eqs. (21,22), when the energy dependence of the function$ \Gamma_{d}(E)/\Gamma_{\text{tot}}(E) $ is stronger than that of the function$ f(Q_{\beta} - E) $ ,$ P_{\beta d} $ increases when the peak in$ S_{\beta}(E) $ is in the region of energies$ Q_{\text {EC}} $ for$ \beta^{+} $ /EC-decay or$ Q_{\beta} $ for$ \beta^{-} $ -decay. In this case, statistical theory [26], assuming$ S_{\beta}(E) \sim \rho (E) $ , where$ \rho (E) $ is the level density of the daughter nucleus, may coincidentally yield that$ P_{\beta d} $ values agree fairly well with experiment (Fig. 19, a) for both statistical and non-statistical theories. Of course, for correct calculation of$ P_{\beta d} $ , non-statistical approaches taking into account the structure of$ S_{\beta}(E) $ should be used. For delayed neutron emission at$ E \gt B_{n} $ , the energy dependence of the function$ f(Q_{\beta} - E) $ may be stronger than that of the function$ \Gamma_{d}(E)/\Gamma_{\text{tot}}(E) $ , and$ P_{\beta d} $ will increase as the$ S_{\beta}(E) $ peak shifts into the energy range$ E \sim B_{n} $ (Fig. 19, b). For GT$ \beta^{-} $ -decay of neutron-rich nuclei, two types of peaks in$ S_{\beta}(E) $ are most significant. One is associated with back spin-flip (BSF) type configurations (Fig. 2), and the other with core polarization (CP) type configurations (Fig. 2). The CP peak corresponds to the situation shown in Fig. 19, a, and the BSF peak to the situation in Fig. 19, b.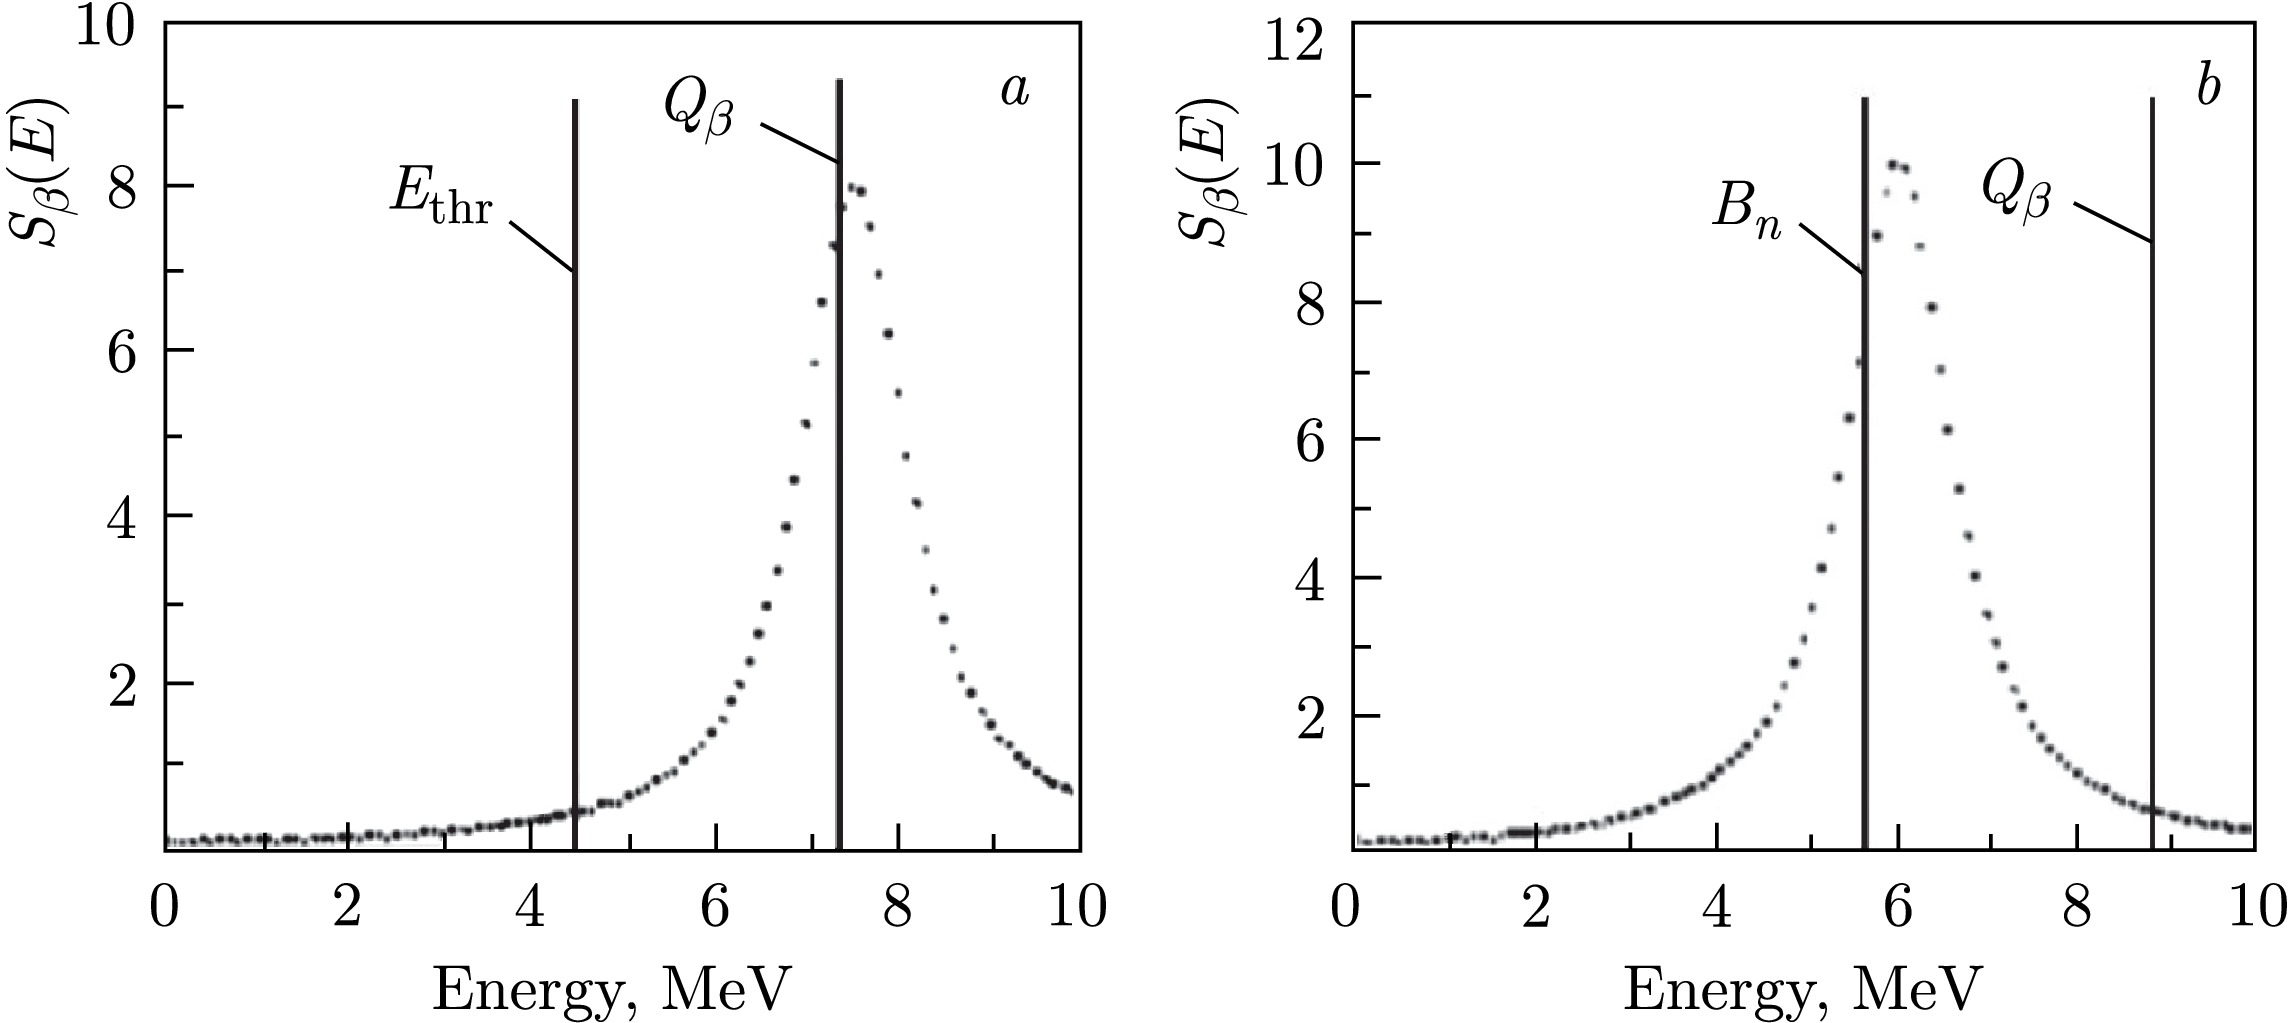
Figure 19. Two different peak position options of the
$ S_{\beta}(E) $ in ($ Q_{\beta} - E_{\text {thr}}) $ energy window. Descriptions for (a) and (b) are given in the textThe spectrum of delayed particles depends on the structure of nuclear states populated in β-decay and the structure of states populated after the delayed process [1−6, 11, 33−35]. Delayed particle spectra are determined both by the shape and structure of the beta-transition strength function
$ S_{\beta}(E) $ and by the probability of delayed particle emission from populated states or the ratio$ \Gamma_{d}(E)/\Gamma_{\text{tot}}(E) $ . For example, GT$ \beta^{-} $ -decay of the nucleus$ ^{135} {\rm{Sb}}$ populates three-quasiparticle states in the nucleus$ ^{135} {\rm{Te}}$ . Transition to the ground state of the even-even nucleus$ ^{134} {\rm{Te}}$ with emission of delayed neutrons from three-quasiparticle states of$ ^{135} {\rm{Te}}$ is forbidden if the ground state of$ ^{134} {\rm{Te}}$ is considered as a quasiparticle vacuum [4]. At the same time, emission of delayed neutrons exciting the$ 2^{+} $ state in$ ^{134} {\rm{Te}}$ is allowed, since the structures of the ground and excited states are different. This conclusion was experimentally confirmed: for all states populated in$ \beta^{-} $ -decay of$ ^{135} {\rm{Sb}}$ , neutron decay to the ground state of$ ^{134} {\rm{Te}}$ is forbidden by a factor of 30—40. Therefore, since the structure of initial and final states is significant, statistical methods can be used to calculate the width ratio$ \Gamma_{d}(E)/\Gamma_{\text{tot}}(E) $ only as an approximation [4, 6, 11]. In the study of delayed processes, it is necessary to take into account the resonant character of$ S_{\beta}(E) $ for both GT- and FF-type β-transitions. Experimental data on the resonant character of$ S_{\beta}(E) $ for FF β-transitions were obtained [11−13]. Nevertheless, the influence of the resonant character of$ S_{\beta}(E) $ for FF β-transitions on the probability of delayed processes is still poorly studied.Delayed fission, i.e., fission of nuclei after β-decay (Fig. 20), is a unique tool for studying fission barriers far from the β-stability line. However, to obtain information about the fission barrier, one must know the shape of
$ S_{\beta}(E) $ [1−4]. The probability of delayed fission Eq. (27) and Eq. (28) substantially depends on the structure of the strength function for β-transitions. The influence of the beta-decay strength function structure on the probability of delayed fission was investigated for the first time in [1−3]. Then, the method developed for describing delayed processes taking into account the structure of$ S_{\beta}(E) $ was used to analyze delayed fission for a wide range of nuclei [1−6, 11, 29].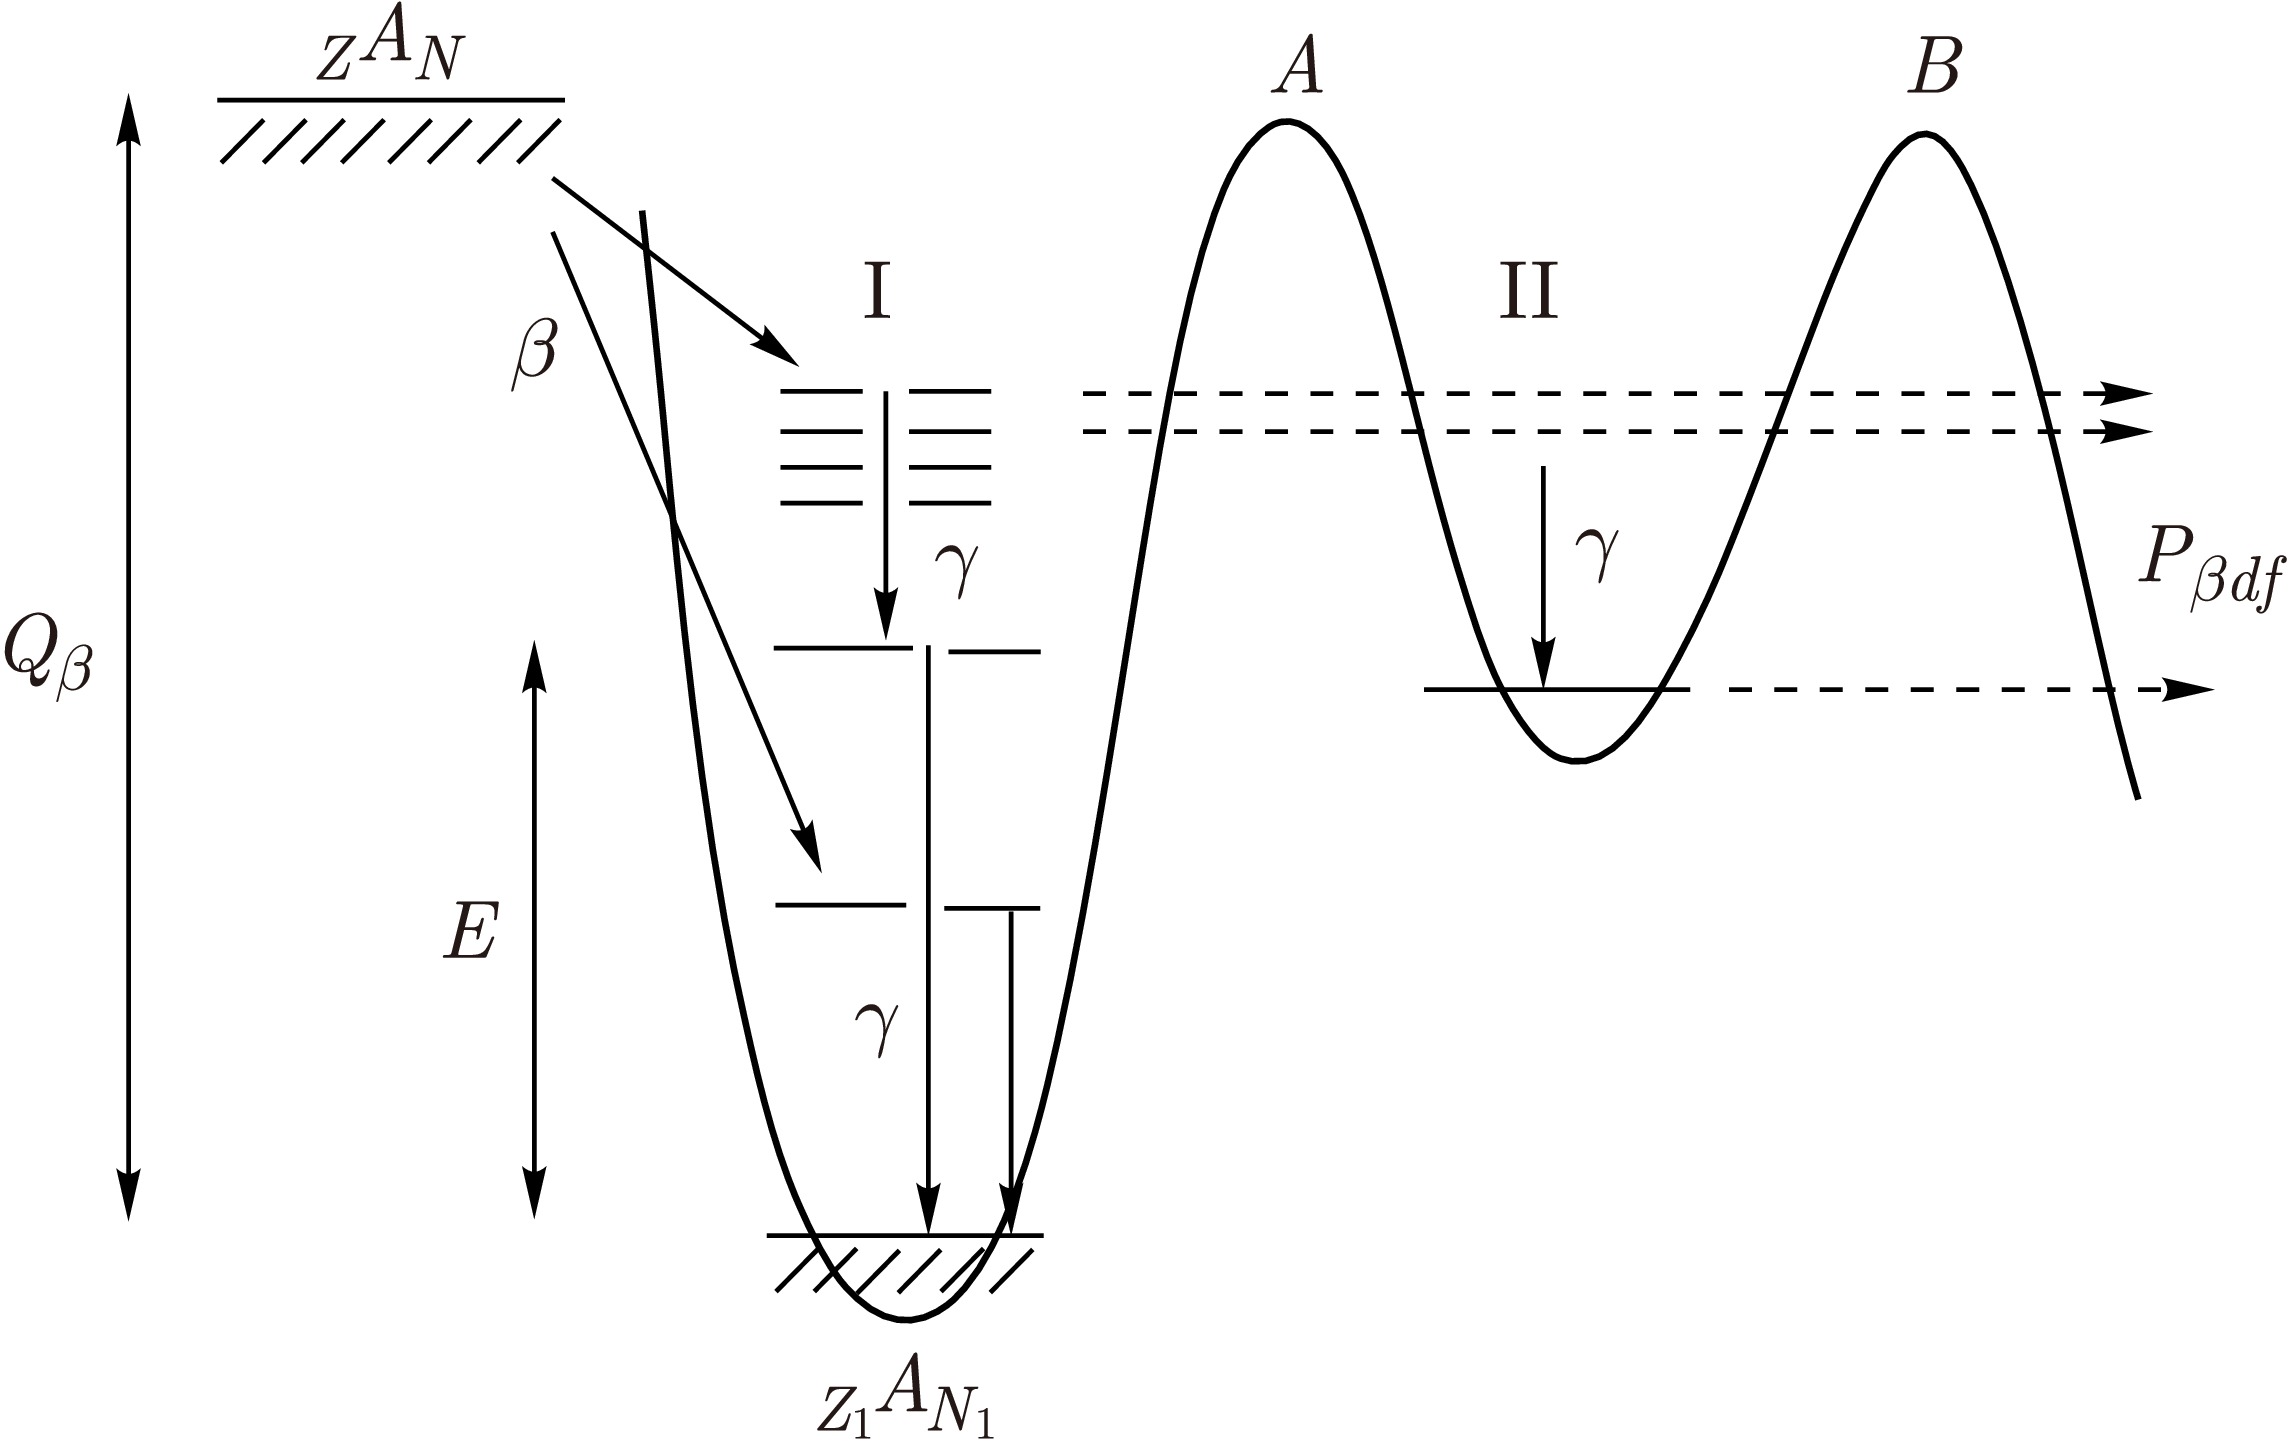
Figure 20. Scheme of the β-delayed fission (
$ \beta df $ ). The heights of inner (A) and outer (B) fission barriers of the daughter nucleus are indicatedThe probability of delayed fission (Fig. 20) substantially depends on the resonant structure of
$ S_{\beta}(E) $ for both$ \beta^{-} $ and$ \beta^{+} $ /EC-decays. Therefore, from the analysis of experimental data on delayed fission, it can be concluded that the latter can be correctly described only using a non-statistical β-decay strength function reflecting nuclear structure effects [1−6].Beta-delayed fission makes it possible to investigate the fission barrier for nuclei far from β-stability. However, before any information about the fission barrier can be extracted, the influence of low-lying structures in the beta-decay strength function
$ S_{\beta}(E) $ on the$ \beta df $ yield must be considered.Delayed fission of
$ ^{236,\,238} {\rm{U}}$ [1, 2, 4, 6, 11] occurs after β-decay of$ ^{236,\,238} {\rm{Pa}}$ . Calculation of$ S_{\beta}(E) $ for$ ^{236,\,238} {\rm{Pa}}$ was performed in [1, 2, 4] within the shell model with residual GT spin-isospin interaction. Most of the β-transition strength (Fig. 20) is concentrated in the GT giant resonance located near the isobaric analogue state. At energies 7—8 MeV below the analogue state, a second peak is observed, due to spin-flip and core polarization type transitions. At energies about 18 MeV below the analogue state, a peak arises from back spin-flip type transitions (Figs. 2 and 21), which make the main contribution to the probability of delayed fission of$ ^{236,\,238} {\rm{U}}$ .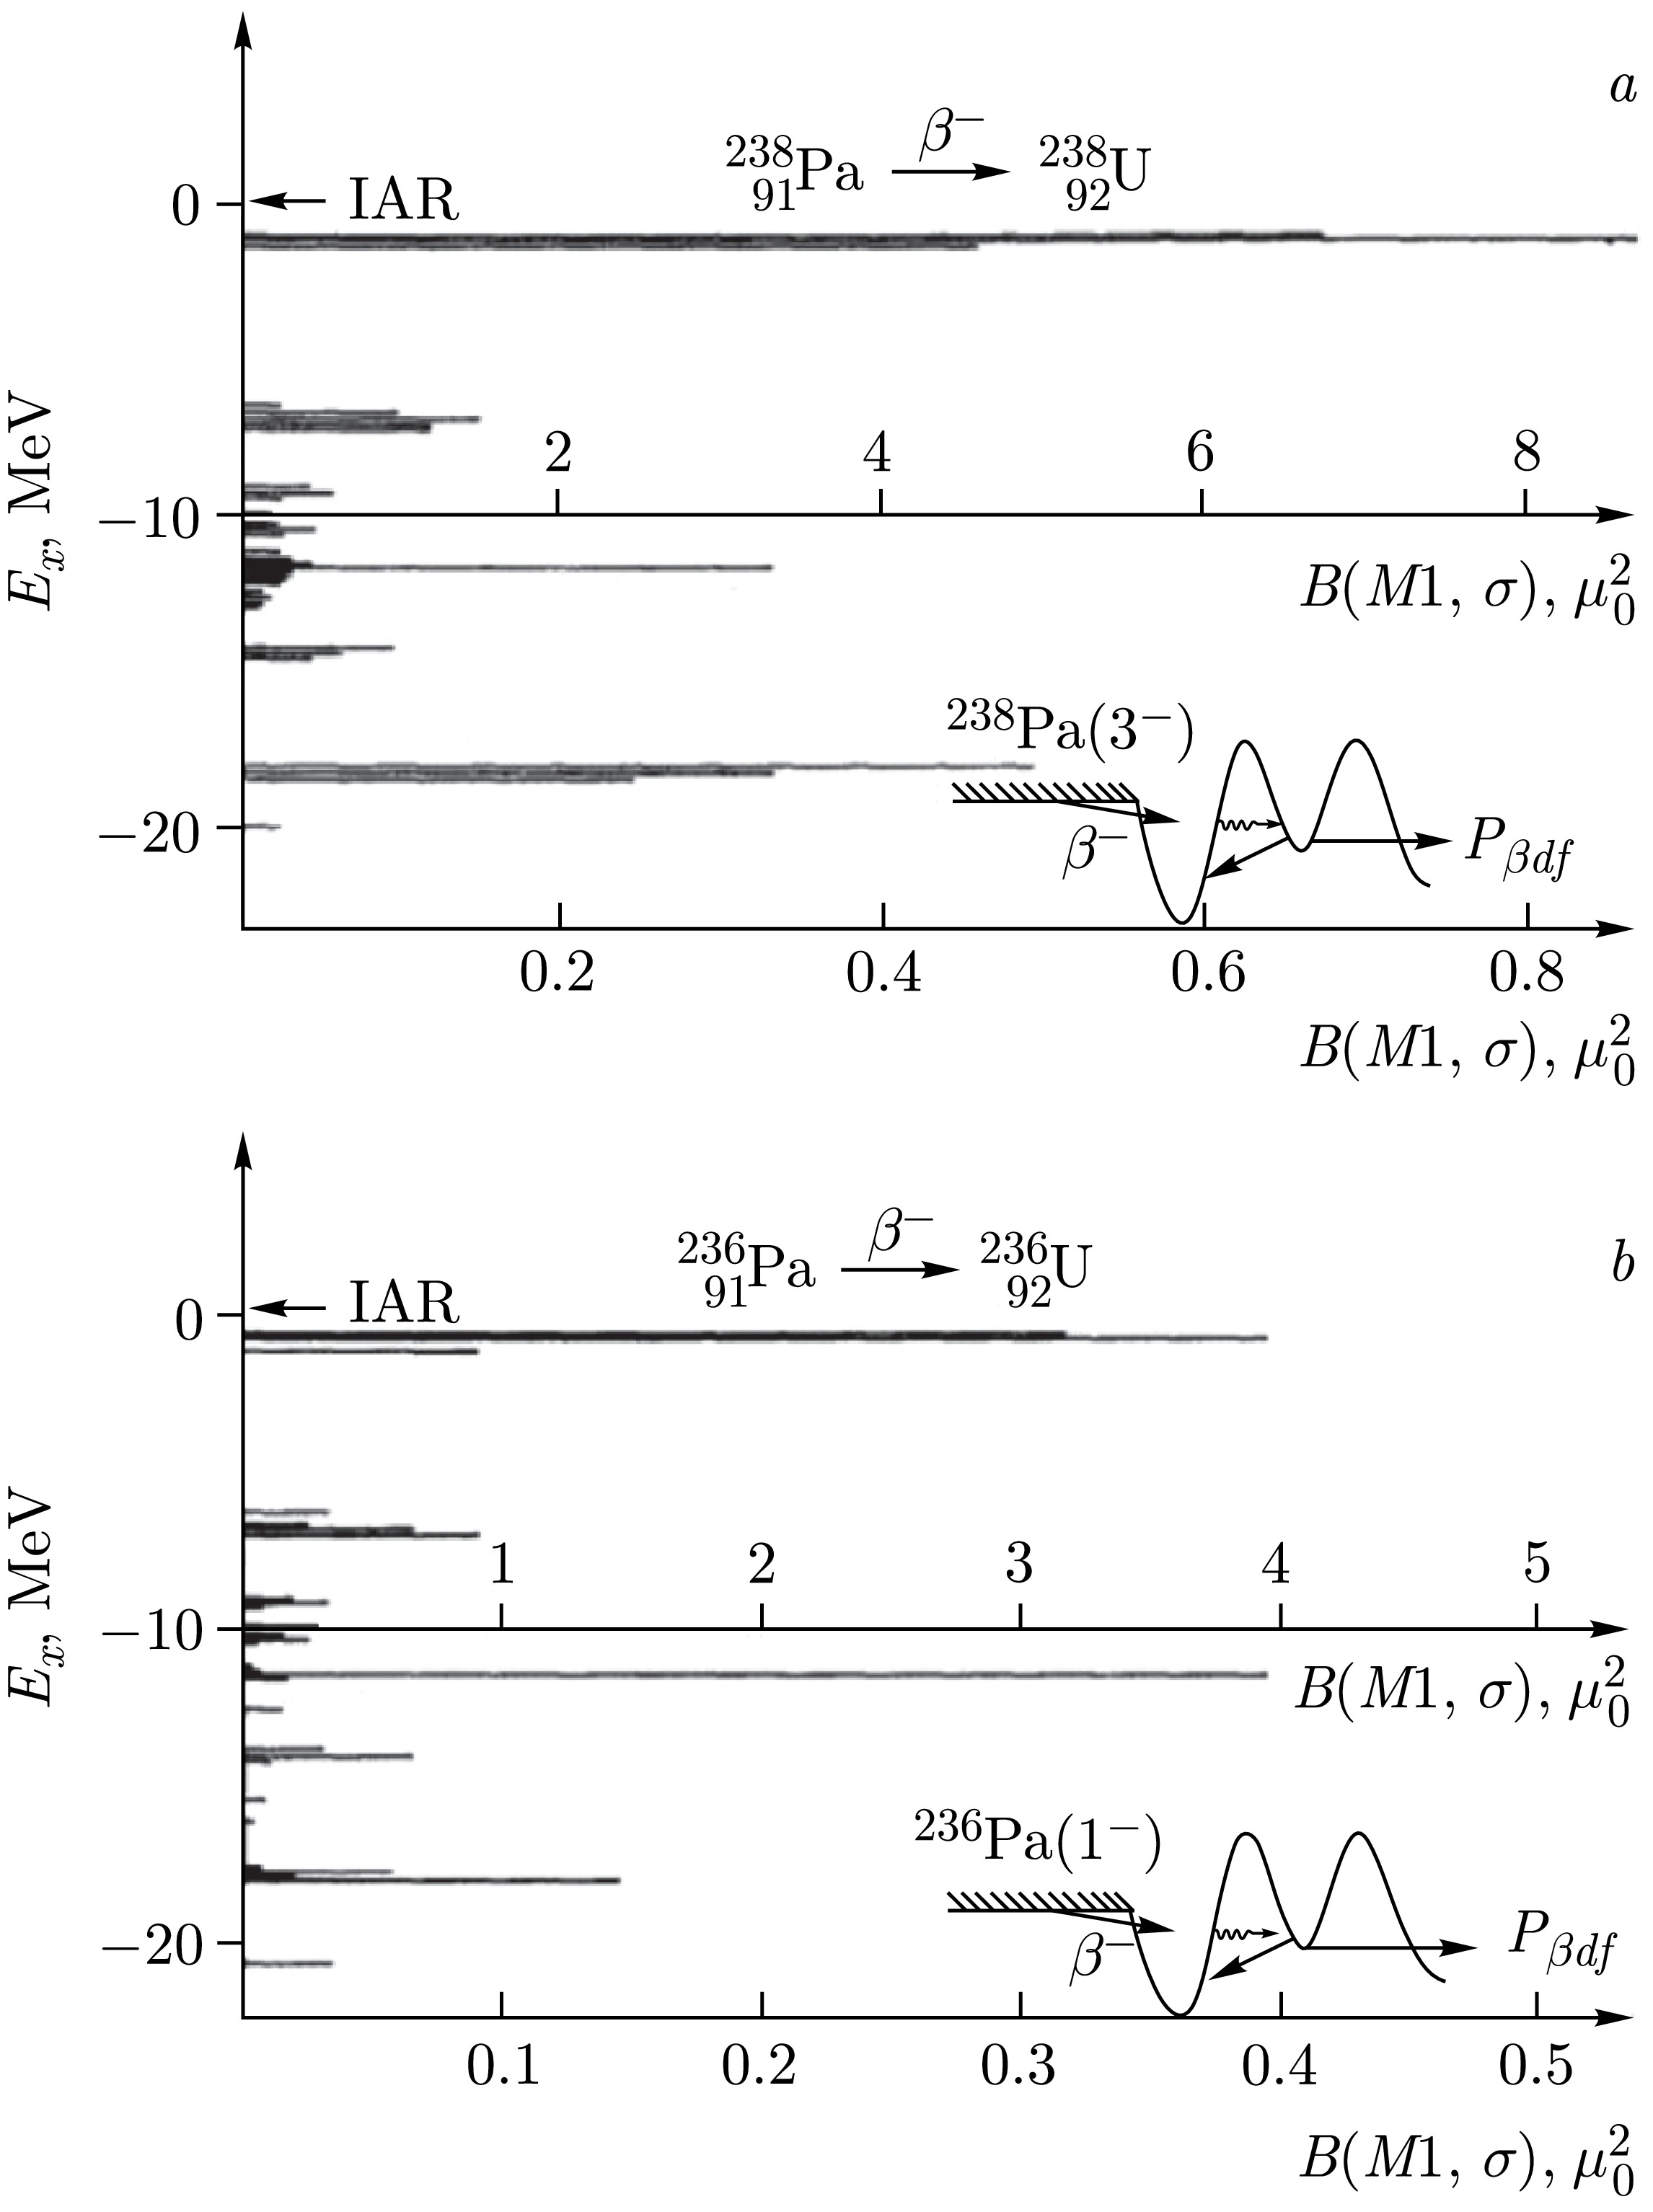
Figure 21.
$ S_{\beta}(E) $ for the$ \beta^{-} $ -decay of$ ^{238} {\rm{Pa}}$ (a),$ ^{236} {\rm{Pa}}$ (b) and the$ ^{236,\,238} {\rm{U}}$ fission barriers.$ B(M1,\sigma) = 11\,633/(T \cdot ft) = $ $ {\text {const}} \cdot S_{\beta}(E) $ , where$ B(M1,\sigma) $ is in units of$ \mu_{0}^{2} $ ($ \mu_{0} $ – the nuclear magneton), and$ ft $ is in seconds, T is the isospin of the ground state of the daughter nucleusTable 3 presents calculated values of
$ P_{\beta df} $ for various assumptions about$ S_{\beta}(E) $ . Calculation of$ P_{\beta df} $ using statistical models for$ S_{\beta}(E) $ gives$ P_{\beta df} $ values that are 5—6 orders of magnitude larger than experimental ones in the case of$ S_{\beta} \sim \rho (E) $ , proportional to the level density of daughter nuclei, while for$ S_{\beta} = {\text {const}} $ ,$ P_{\beta df} $ values are 2—3 orders of magnitude larger for$ ^{236} {\rm{U}}$ and$ ^{238} {\rm{U}}$ . Thus, for delayed fission of$ ^{236} {\rm{U}}$ and$ ^{238} {\rm{U}}$ , the assumptions used in statistical models,$ S_{\beta} = {\text {const}} $ and$ S_{\beta} \sim \rho (E) $ , give$ P_{\beta df} $ values that significantly exceed experimental values, whereas the use of non-statistical$ S_{\beta}(E) $ , reflecting nuclear structure effects, leads to better agreement between experimental and calculated$ P_{\beta df} $ values for$ ^{238} {\rm{U}}$ . The latter calculation predicts that$ P_{\beta df} $ decreases when going from$ ^{238} {\rm{U}}$ to$ ^{236} {\rm{U}}$ , which also agrees with the data.Nucleus Values of $ P_{\beta df} $ for various choices of$ S_{\beta}(E) $ Experiment $ S_{\beta}(E) = {\text {const}} $ $ S_{\beta}(E) \sim \rho (E) $ Non-statistical model, $ S_{\beta}(E) $ from Fig. 21$ ^{236} {\rm{U}}$ $ 6 \cdot 10^{-7} $ $ 6\cdot 10^{-4} $ $ 10^{-12} $ $ 10^{-9} $ $ ^{238} {\rm{U}}$ $ 2 \cdot 10^{-5} $ $ 10^{-2} $ $ 10^{-8} $ $ 10^{-8} $ Table 3. Probabilities
$ P_{\beta df} $ of the$ ^{236} {\rm{U}}$ and$ ^{238} {\rm{U}}$ delayed-fission: experimental data and calculated values with various hypotheses about$ S_{\beta}(E) $ Delayed fission of
$ ^{256m} {\rm{Es}}$ $ \,\to\,{}^{256} {\rm{Fm}}$ $ \,\to \,\beta df $ was studied in [38]. The delayed fission probability value was found to be$ P_{\beta df} \approx 2\cdot 10^{-5} $ , and the decay scheme of$ ^{256} {\rm{Fm}}$ was studied. It was experimentally shown that delayed fission occurs mainly after$ \beta^{-} $ -decay to a level with excitation energy$ E \approx 1425 $ keV, i.e., manifestation of resonant structure in$ S_{\beta}(E) $ was experimentally supported in delayed fission. Calculations also predict a resonance in$ S_{\beta}(E) $ near excitation energies$ E \approx 1.5 $ MeV [6, 11].A rather large fraction of delayed fission is observed [39] for
$ \beta^{+} $ /EC-delayed fission of$ ^{232} {\rm{Pu}}$ ,$ ^{232} {\rm{Am}}$ $ \,\to\,{}^{232} {\rm{Pu}}$ $ \,\to\,{}\beta df $ :$ P_{\beta df} \approx 1.3\cdot 10^{-2} $ . Data on delayed fission after$ \beta^{+} $ /EC-decay of$ ^{232} {\rm{Am}}$ were used in [39] to find the parameters of the inner fission barrier (barrier A in Fig. 20) of$ ^{232} {\rm{Pu}}$ . The results [39], obtained under the assumption$ S_{\beta}(E) = {\text {const}} $ , give$ P_{\beta df} = 1.3\cdot 10^{-2} $ for an inner fission barrier height$ E_{A} = 5.3 $ MeV, which is 1—2 MeV higher than predicted by Strutinsky calculations ($ E_{\text {thr}} = 3.5{-}4.3 $ MeV [3]). In [39], it was concluded on this basis that the "experimental" and theoretical fission barrier values for$ ^{232} {\rm{Pu}}$ do not agree with each other. However, as shown in [3], the choice$ S_{\beta} = {\text {const}} $ is not justified and does not reflect the peculiarities of$ \beta^{+} $ /EC-decay in this specific case of the nucleus$ ^{232} {\rm{Am}}$ . The structure of the strength function$ S_{\beta}(E) $ of$ \beta^{+} $ /EC-decay of$ ^{232} {\rm{Am}}$ was calculated in [3] based on the idea of Gamow–Teller charge-exchange excitations and is shown in Fig. 22. Non-statistical effects leading to resonant structure in$ S_{\beta}(E) $ significantly change the analysis of$ P_{\beta df} $ values. The value of the total$ \beta^{+} $ /EC-decay energy,$ Q_{\beta} = 5.2 $ MeV, is marked by an arrow in Fig. 22 and was obtained using the Garvey–Kelson mass formula. Also shown in Fig. 22 is the fission barrier of$ ^{232} {\rm{Pu}}$ calculated by the Strutinsky shell correction method. In calculations of$ P_{\beta df} $ , the following fission barrier parameters for$ ^{232} {\rm{Pu}}$ were used:$ E_{B} = 4.21 $ MeV,$ \hbar \omega_{A}=0.9 $ MeV,$ \hbar \omega_{B}=0.6 $ MeV, and the inner barrier height$ E_{A} $ was varied. Under the assumption$ S_{\beta}(E)={\text {const}} $ and$ P_{\beta df} = 1.3\cdot 10^{-2} $ , it was found that$ E_{A}=5.3 $ MeV, i.e., the same result as in [39], which is 1—2 MeV higher than in Strutinsky calculations ($ E_{\text {thr}}=3.5{-}4.3 $ MeV). However, if one uses$ S_{\beta}(E) $ calculated in [3, 4, 6, 11] and introduces a realistic width ($ {\text {FWHM}} = 1 $ MeV), then without any fitting we find that$ E_{A}=4.0 $ MeV corresponds to$ P_{\beta df} = 5.0\cdot 10^{-2} $ , which agrees with experiment [39] and with the Strutinsky fission barrier calculation. Consequently, based on the analysis [3, 4, 6, 11], it can be concluded that: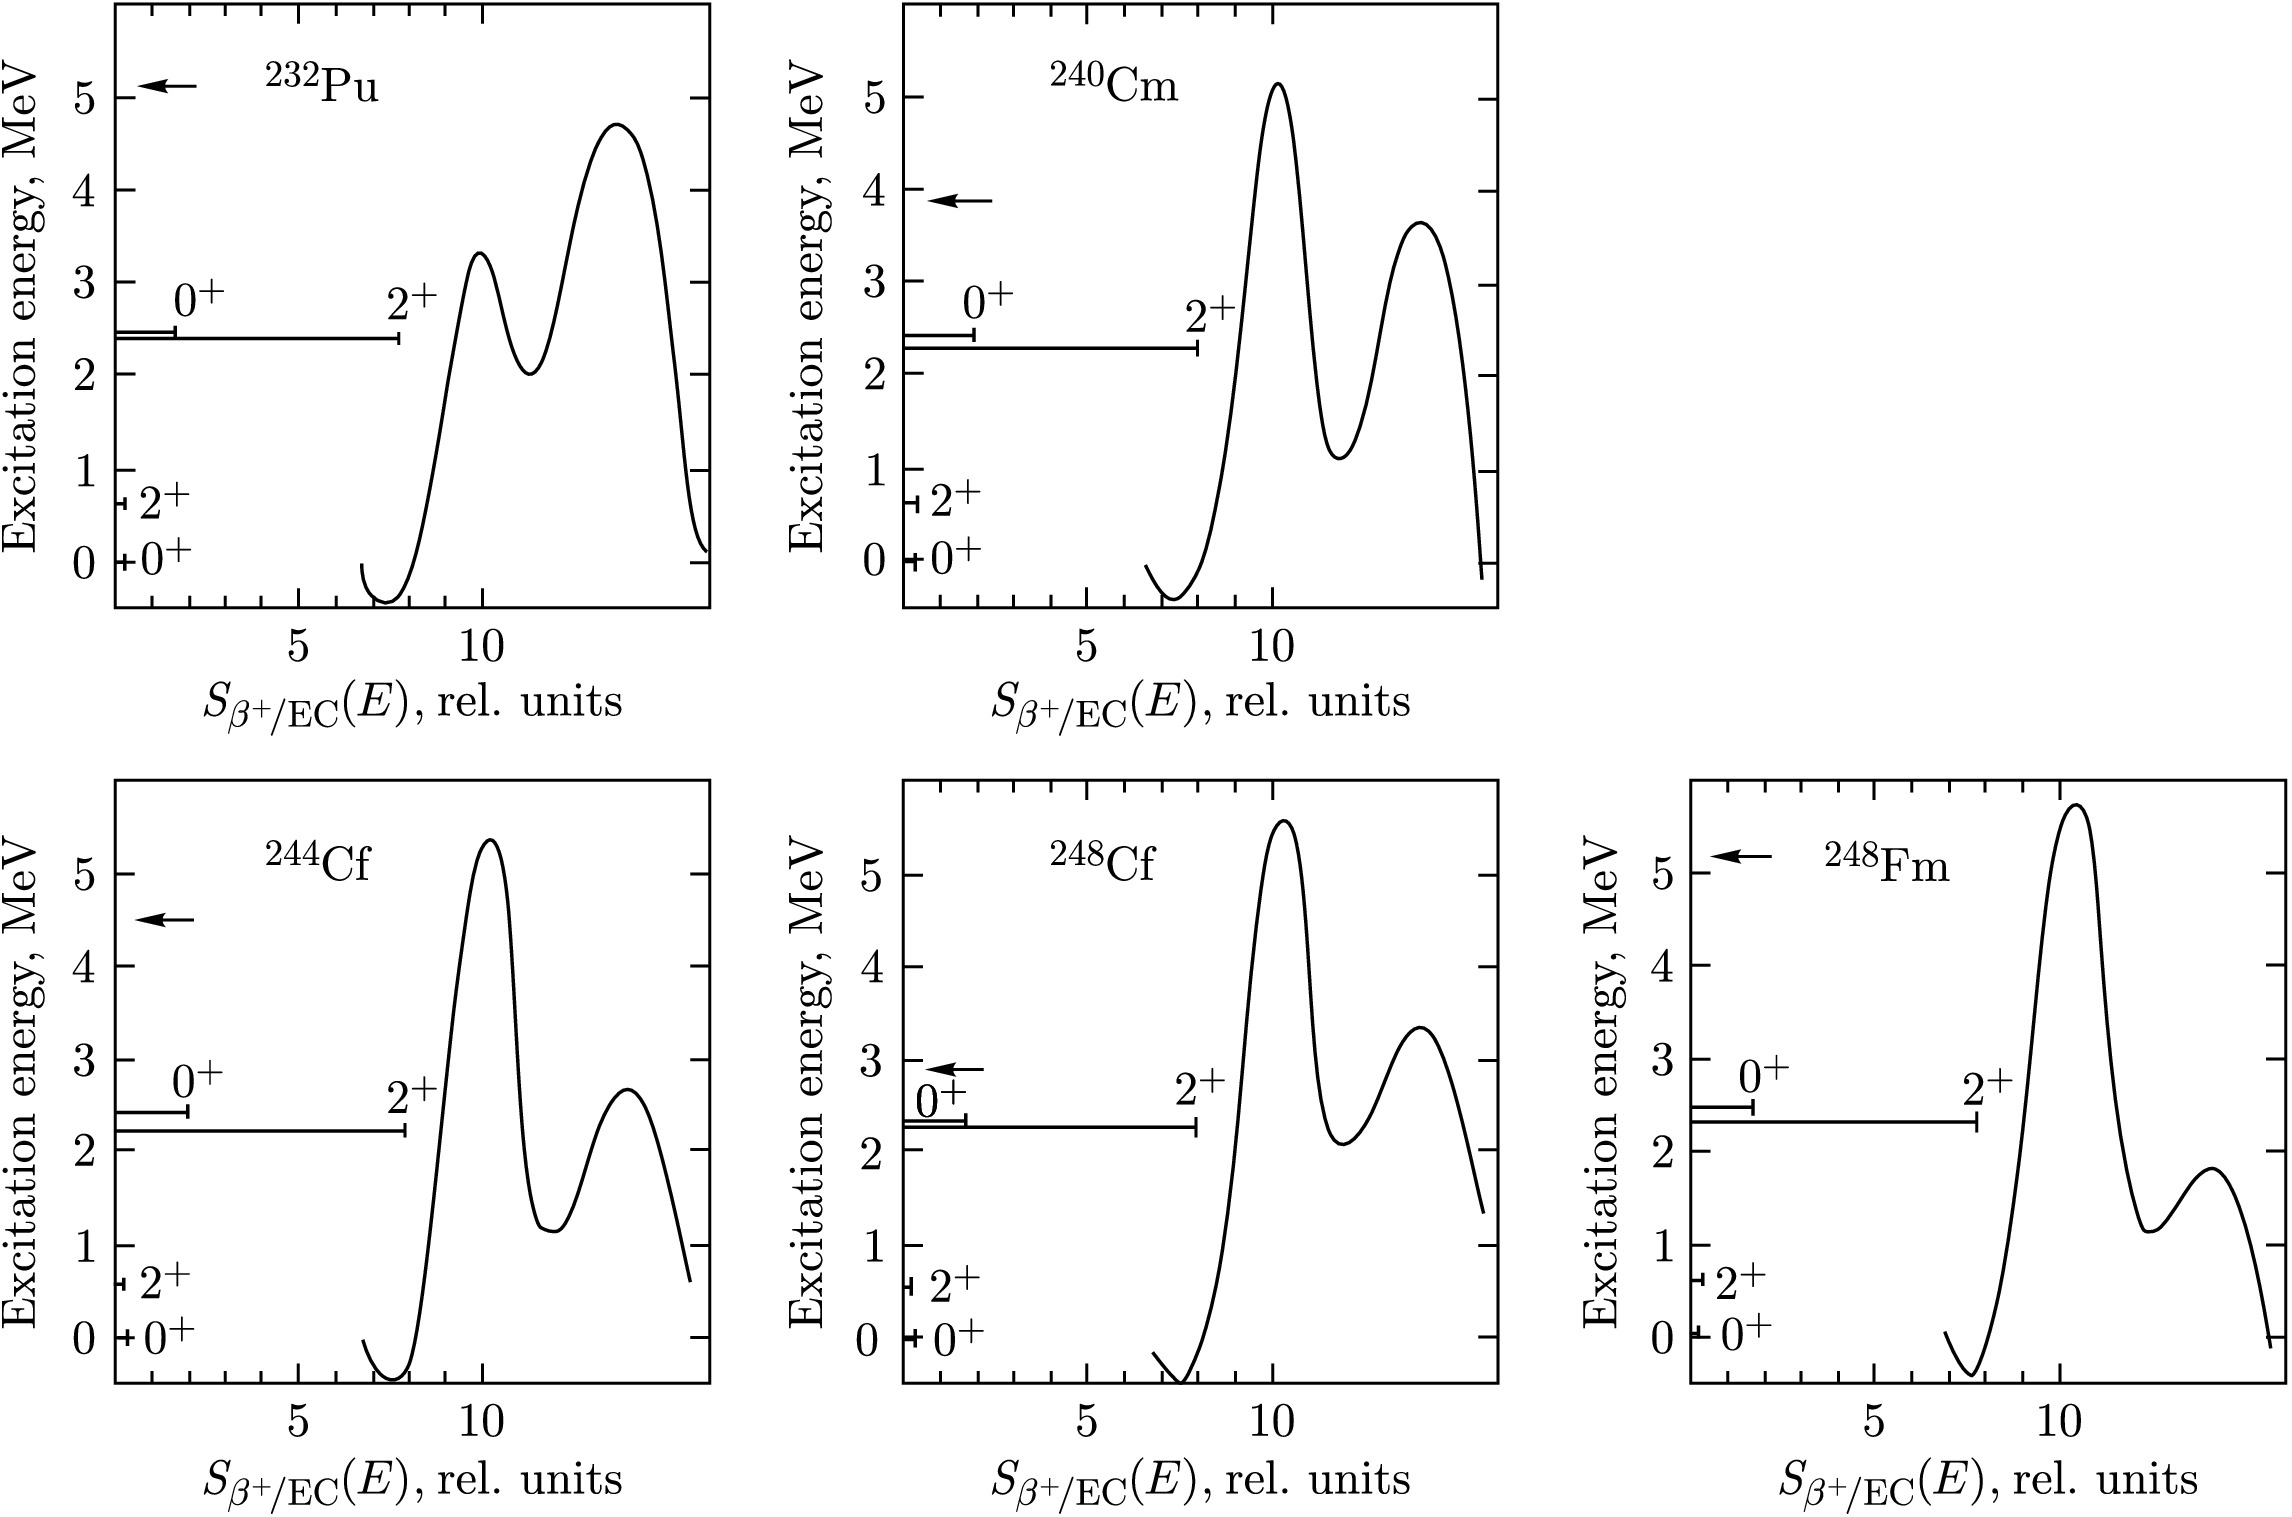
Figure 22. Fission barriers of
$ ^{232} {\rm{Pu}}$ ,$ ^{240} {\rm{Cm}}$ ,$ ^{244,248} {\rm{Cf}}$ ,$ ^{248} {\rm{Fm}}$ and$ S_{\beta}(E) $ structure of the$ \beta^{+} $ /EC-decay of$ ^{232} {\rm{Am}}$ ,$ ^{240} {\rm{Bk}}$ ,$ ^{244,248} {\rm{Es}}$ , and$ ^{248} {\rm{Md}}$ . The total energies of the EC-decay are indicated by the arrows and were calculated using the Garvey–Kelson mass formulas1. If the structure of
$ S_{\beta}(E) $ is properly taken into account, experimental data on delayed fission of$ ^{232} {\rm{Pu}}$ can be explained.2. There is no basis to assert that fission barriers calculated by the Strutinsky method fail to describe delayed fission data, as was done in [39].
In the actinide region, the
$ \beta^{+} $ /EC-delayed fission has also been studied for the following processes:$ \begin{array}{c} {}^{240}{\text {Bk}}\,\to\,{}^{240}{\text {Cm}} \to \beta df, \\ {}^{244,\,248}{\text {Es}}\,\to\,{}^{244,\,248}{\text {Cf}} \to \beta df, \\ {}^{248}{\text {Md}}\,\to\,{}^{248}{\text {Fm}} \to \beta df, \\ {}^{234}{\text {Am}}\,\to\,{}^{234}{\text {Pu}} \to \beta df. \end{array} $
In Fig. 22 and Table 4, we present results of calculations [3, 4, 6, 11] of
$ S_{\beta}(E) $ ,$ P_{\beta df\; {\text {theor}}} $ , and the experimental values$ P_{\beta df\,\exp} $ for a number of nuclei. In calculating$ P_{\beta df\; {\text {theor}}} $ , peaks in$ S_{\beta}(E) $ were approximated by Gaussians with$ {\text {FWHM}} = 1 $ MeV. The ratio of the "peak" area to the "background" under the peak was chosen to be 100. These parameters for width and background correspond to systematics [4, 6, 11]. In this case, inclusion of background models β-transitions of various forbiddenness degrees. From Table 4, we see that the calculated values of$ S_{\beta}(E) $ and$ P_{\beta df} $ , together with fission barriers calculated by the Strutinsky method, lead to a description of experiment. Some discrepancies are observed where experimental$ P_{\beta df} $ values are small (for$ ^{240} {\rm{Cm}}$ and$ ^{240} {\rm{Cf}}$ ), but by varying the fission barrier height within acceptable limits (no more than 0.5 MeV), agreement with experiment can be reached.Nucleus $ E_{A} $ , MeV$ E_{B} $ , MeV$ \hbar \omega_{A} $ , MeV$ \hbar \omega_{B} $ , MeV$ Q_{\beta} $ , MeV$ P_{\beta df\,\exp} $ $ P_{\beta df {\text {theor}}} $ $ ^{232} {\rm{Pu}}$ 4.0 4.2 0.9 0.6 5.2 $ 1.3\cdot 10^{-2} $ $ 5\cdot 10^{-2} $ $ ^{244} {\rm{Cf}}$ 5.3 2.8 0.9 0.6 4.5 $ 5\cdot 10^{-4} $ $ 4\cdot 10^{-4} $ $ ^{248} {\rm{Fm}}$ 5.7 1.8 0.9 0.6 5.2 $ 3\cdot 10^{-3} $ $ 2\cdot 10^{-3} $ $ ^{248} {\rm{Cf}}$ 5.7 3.3 0.9 0.6 2.9 $< 10^{-7} $ $ 2\cdot 10^{-7} $ $ ^{240} {\rm{Cm}}$ 5.2 3.7 0.9 0.6 3.9 $ 10^{-5} $ $ 9\cdot 10^{-7} $ Table 4. Experimental [3, 4, 6, 11, 29, 40] and theoretical values of the delayed-fission probabilities
$ P_{\beta df} $ for$ ^{232} {\rm{Pu}}$ ,$ ^{244,248} {\rm{Cf}}$ ,$ ^{248} {\rm{Fm}}$ , and$ ^{240} {\rm{Cm}}$ .$ P_{\beta df} $ was calculated using the non-statistical strength functions [3] of the$ \beta^{+} $ /EC-decay (Fig. 22). The fission barriers were calculated using the Strutinsky methodDelayed fission of
$ ^{234} {\rm{Am}}$ was studied in [40]. It was shown that$ P_{\beta df} = (6.6\pm 1.8)\cdot 10^{-5} $ . Calculations [6, 11] predict that$ S_{\beta}(E) $ has a resonance near excitation energy$ E\approx 2.5 $ MeV, determining the probability of delayed fission of$ ^{234} {\rm{Am}}$ . In this case, the experimental$ P_{\beta df} $ value corresponds to a fission barrier of$ ^{234} {\rm{Pu}}$ with parameters$ E_{A}=4.7 $ MeV,$ \hbar \omega_{A}=0.9 $ MeV,$ E_{B}=4.2 $ MeV, and$ \hbar \omega_{B}=0.6 $ MeV, which agree with values calculated by the Strutinsky method [6, 11]. Thus, from analysis of experimental data on delayed fission in the actinide region, it can be concluded that delayed fission can be correctly described only using a non-statistical beta-transition strength function reflecting nuclear structure effects [1−4, 6, 11].Delayed fission of a number of pre-actinide nuclei can be used as a test to verify various models used to calculate
$ S_{\beta}(E) $ or fission barriers. For this, studies of$ \beta^{-} $ -delayed fission [6, 11, 42] of$ ^{232} {\rm{Fr}}$ $ \,\to\,{}^{232} {\rm{Ra}}$ $ \,\to\,{}\beta df $ are very useful. The experimental estimate$ P_{\beta df\,\exp} \lt 2\cdot 10^{-6} $ for$ ^{232} {\rm{Ra}}$ was obtained in [43]. The experimental estimate for$ P_{\beta df\,\exp} $ strongly contradicts the theoretical value [44]$ P_{\beta df\; {\text {theor}}} \approx 0.3 $ . Calculations of$ P_{\beta df} $ are very sensitive to parameters such as total beta-decay energy$ Q_{\beta} $ , fission barrier height$ B_{f} $ , barrier curvature$ \hbar \omega_{f} $ , and the structure of the beta-decay strength function. The dependence of$ P_{\beta df} $ on barrier height and curvature$ \hbar \omega_{f} $ is particularly strong in some cases. Calculations performed in [6, 11, 42] showed that for$ \beta^{-} $ -decay of$ ^{232} {\rm{Fr}}$ , the strength function$ S_{\beta}(E) $ has a maximum at excitation energy$ E^{\ast} \approx 5.5 $ MeV and can be approximated by a Gaussian of width$ {\text {FWHM}} = 1 $ 1 MeV. If the effective one-humped fission barrier parameter for$ ^{232} {\rm{Ra}}$ is chosen as$ \hbar \omega_{f} = 1 $ MeV, the experimental estimate$ P_{\beta df\exp} \lt 2\cdot 10^{-6} $ corresponds to a barrier height$ B_{f} \gt 7.7 $ MeV in$ ^{232} {\rm{Ra}}$ . The value of$ Q_{\beta} $ was chosen as in [45] (systematics):$ Q_{\beta} = (5.7\pm 0.7) $ MeV.Theoretical calculations [46] indicate that fission barriers for
$ ^{228} {\rm{Ra}}$ and$ ^{232} {\rm{Ra}}$ are approximately equal. Experimental data on the effective one-humped barrier of$ ^{228} {\rm{Ra}}$ are given in [47, 48]:$ B_{f} \approx 7.8 $ MeV,$ \hbar \omega_{f} = 0.9 $ MeV; and$ B_{f} = (8.7\pm 0.4) $ MeV. Thus, the estimate [42]$ B_{f} \gt 7.7 $ MeV for the barrier in$ ^{232} {\rm{Ra}}$ agrees with a number of experimental and theoretical results. The value of$ P_{\beta df} $ obtained in [44] is too large, which may be related to an incorrect choice of barrier parameters.For nuclei far from the β-stability line, calculations of
$ P_{\beta df} $ can give widely differing results if the energy parameters$ [Q_{\beta} $ ,$ B_{f} $ ,$ S_{\beta}(E)] $ are not known accurately enough. Solving the inverse problem, i.e., estimating barrier parameters from delayed fission data, can provide valuable information [6, 11]. However, in this case, information about the structure of the beta-transition strength function is necessary. Since the results of barrier height estimates from$ P_{\beta df} $ will strongly depend on the position and width of$ S_{\beta}(E) $ , much more effort must be applied to investigate the details of$ S_{\beta}(E) $ both experimentally and theoretically.The spectrum of delayed protons [4, 33, 35] has a typical bell shape with a typical FWHM of 2—3 MeV. Therefore, the delayed proton spectrum allows investigating a fairly narrow energy interval in
$ S_{\beta}(E) $ and obtaining information about the structure of$ S_{\beta}(E) $ . If this energy interval does not contain a peak of$ S_{\beta}(E) $ , the shape of the delayed proton spectrum agrees fairly well with the statistical model. If a peak of$ S_{\beta}(E) $ falls into the energy interval determining delayed proton emission, then no variations of parameters allow reproducing the shape of the delayed proton spectrum for a wide range of nuclei if the structure of$ S_{\beta}(E) $ is ignored [4, 6, 11]. The first case is illustrated by the delayed proton spectrum for$ ^{69} {\rm{Se}}$ [4, 49]. Here (Fig. 23), calculation within the statistical model with$ S_{\beta}(E) = {\text {const}} $ reproduces the bell-shaped part of the spectrum fairly well. Note that statistical calculations with modeling of various fluctuations can in principle yield "peaks" in delayed particle spectra, but they do not allow describing regularities in intensities and positions of peaks for different nuclei [4, 6, 11].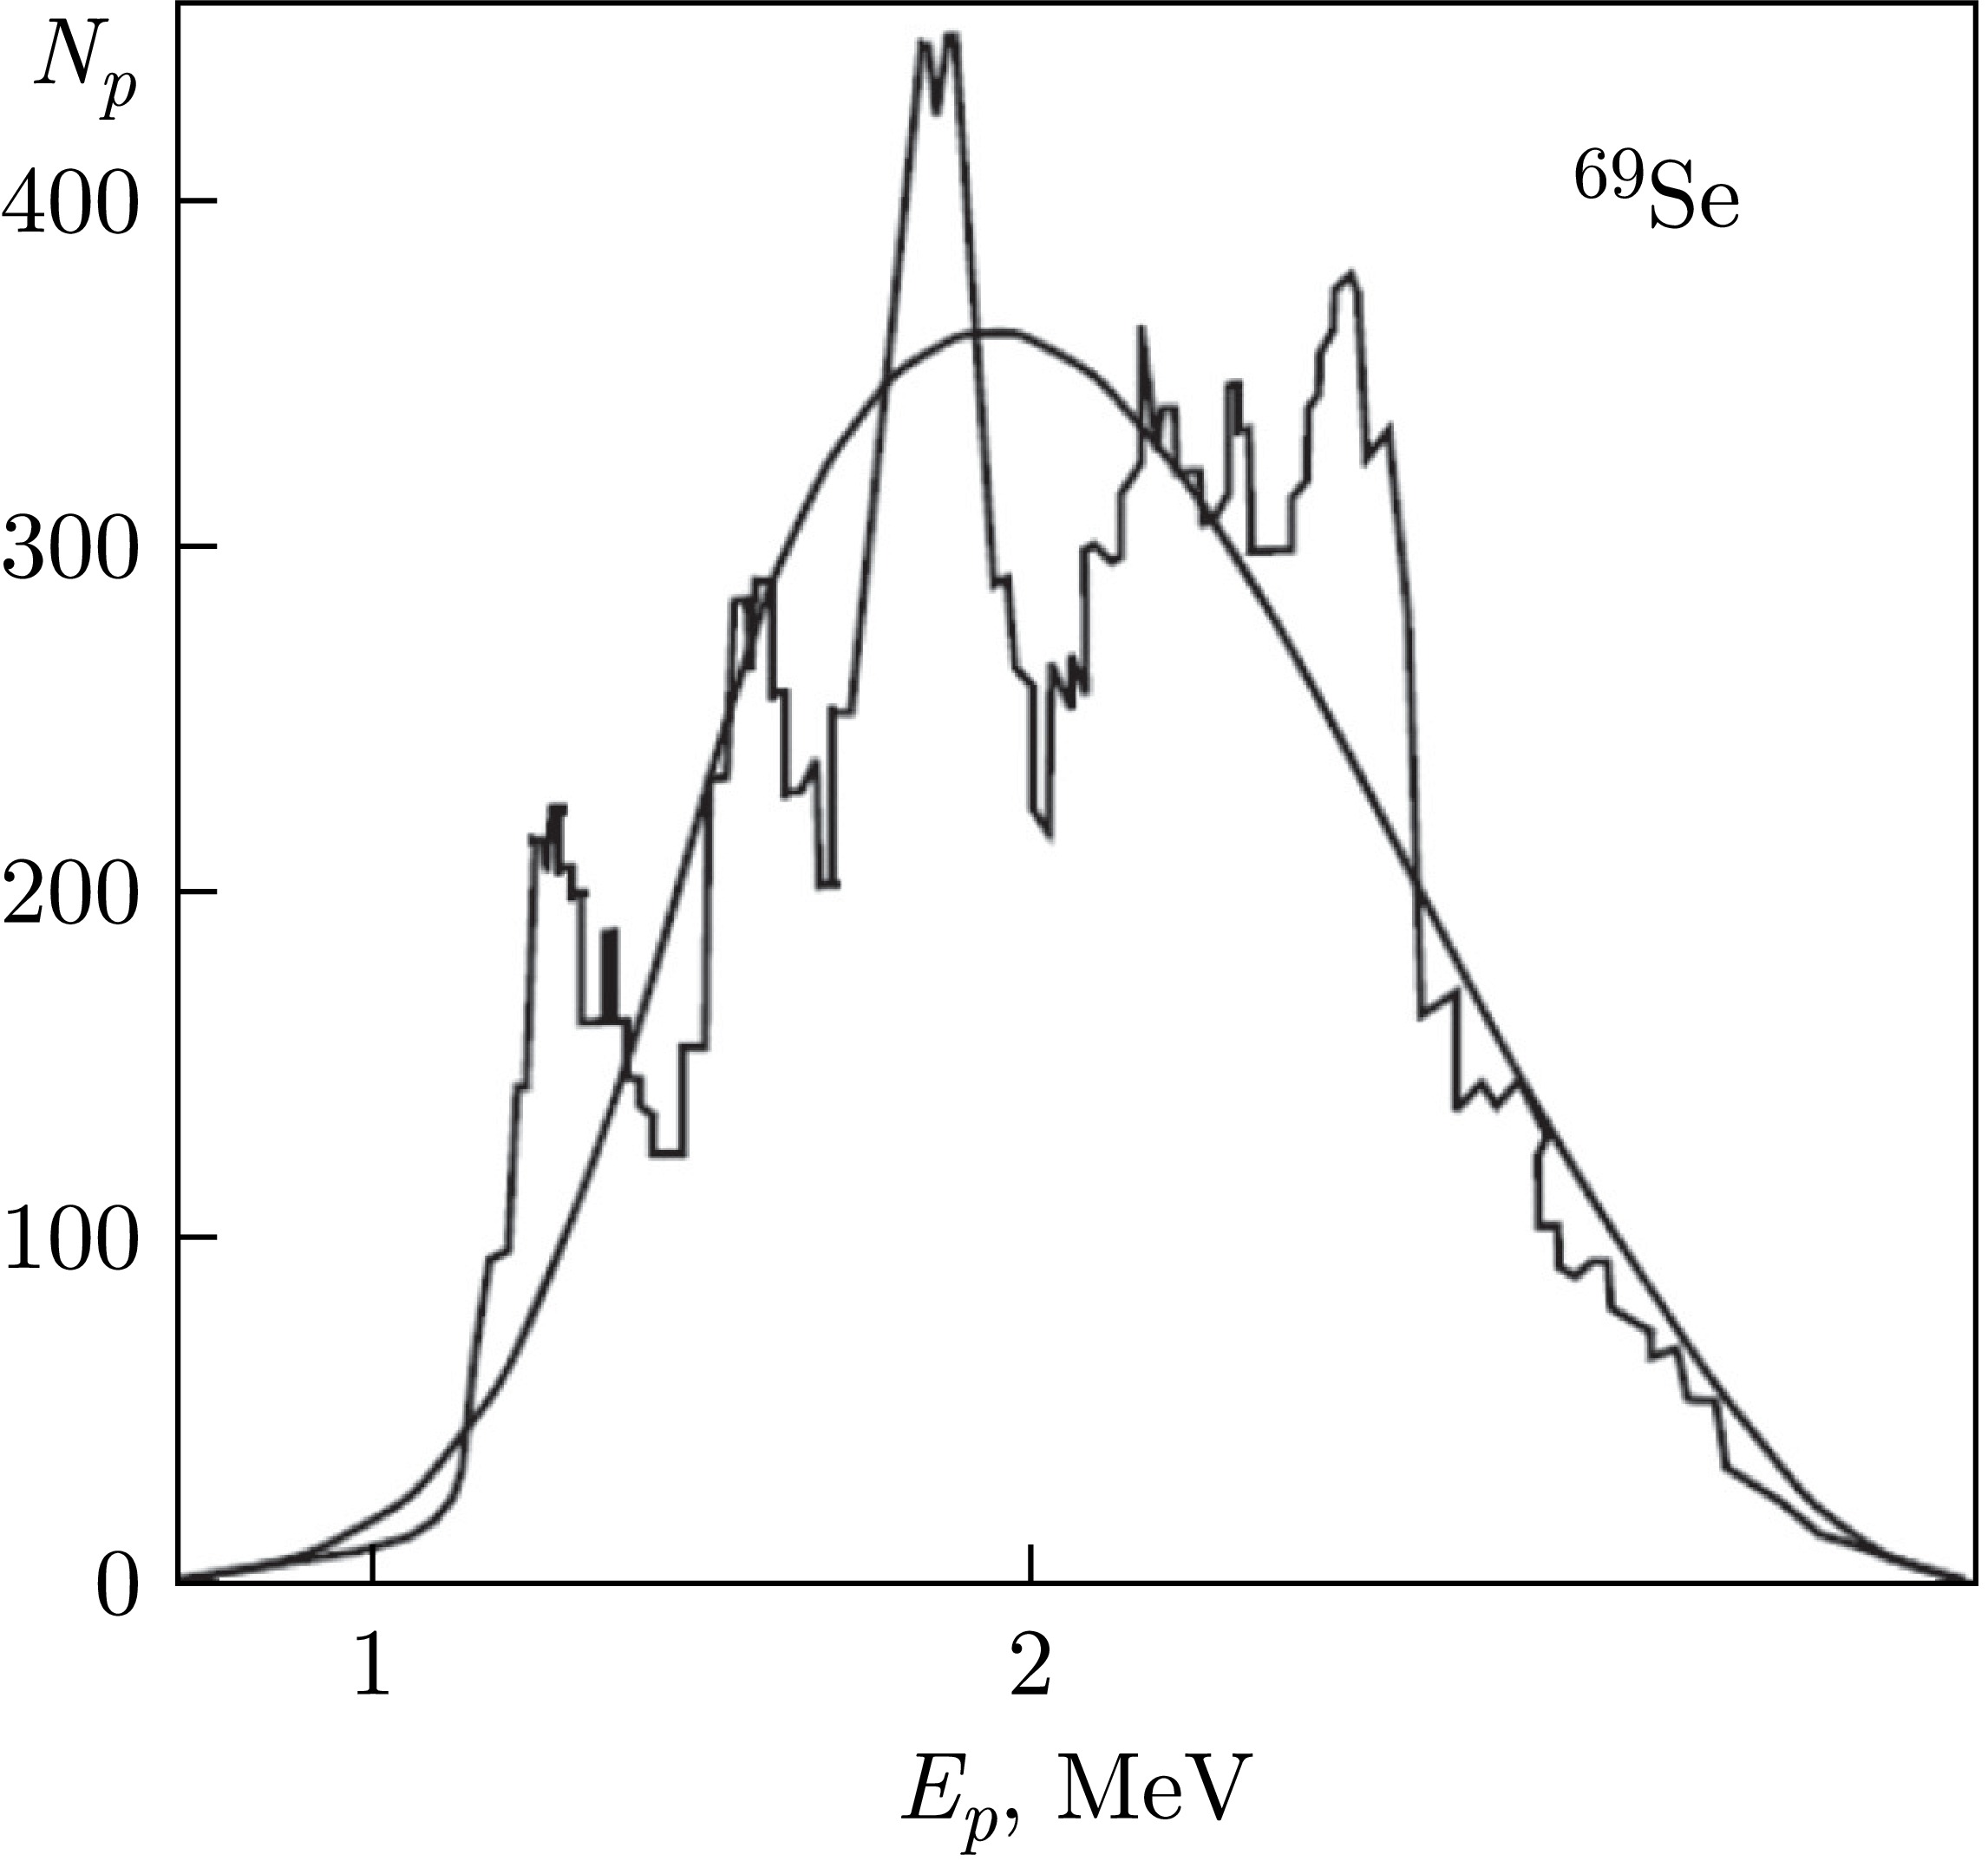
The latter case is most clearly illustrated by the delayed proton spectrum for
$ ^{109} {\rm{Te}}$ [4, 50]. Here the delayed proton spectrum can be described only by taking into account the structure of$ S_{\beta}(E) $ (Fig. 24). Adequate description of the resonant structure in$ S_{\beta}(E) $ allows explaining experimental data on the shape of delayed proton spectra for a great variety of nuclei [29, 33, 35].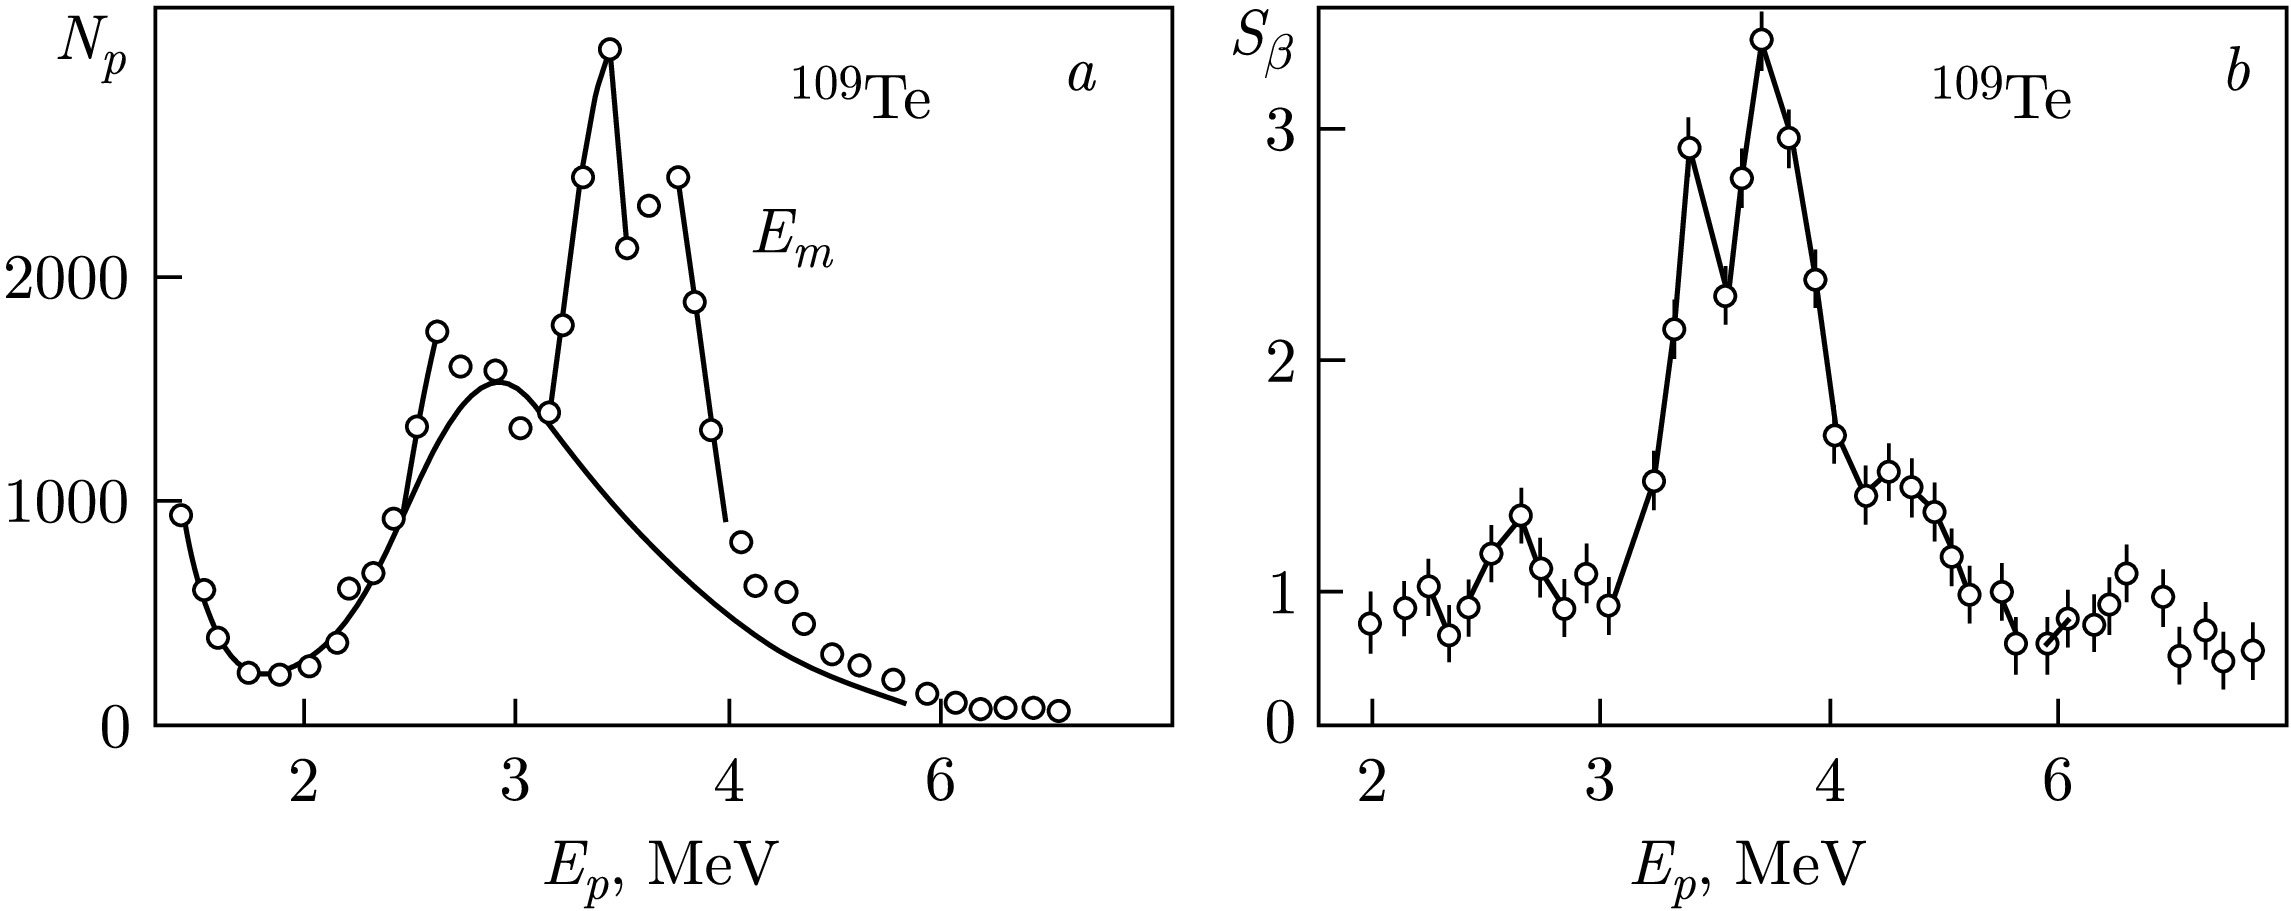
Below
$ Q_{\beta} $ , there exist local maxima in$ S_{\beta}(E) $ for both GT and FF β-transitions. The fine structures of these maxima in$ \beta ^{+} $ /EC-decay strength function manifest as resonances in the delayed proton spectrum.The study of delayed neutrons (Fig. 25) allows obtaining more detailed information about the structure of
$ S_{\beta}(E) $ in a wider energy window than the study of delayed protons, since there is no Coulomb barrier. Manifestations of the resonant structure of$ S_{\beta}(E) $ in delayed neutron spectra have been observed for many nuclei [4−6, 11, 29, 34]. An example of the strength function for$ \beta^{-} $ -decay of$ ^{95} {\rm{Rb}}$ , obtained from analysis of the delayed neutron spectrum [4–6, 51], is shown in Fig. 25 together with calculations of$ S_{\beta}(E) $ within different models. From comparison of experimental and theoretical data [4−6, 51], it is seen that the delayed neutron spectrum for$ ^{95} {\rm{Sr}}$ can be correctly described only by taking into account non-statistical effects in$ S_{\beta}(E) $ .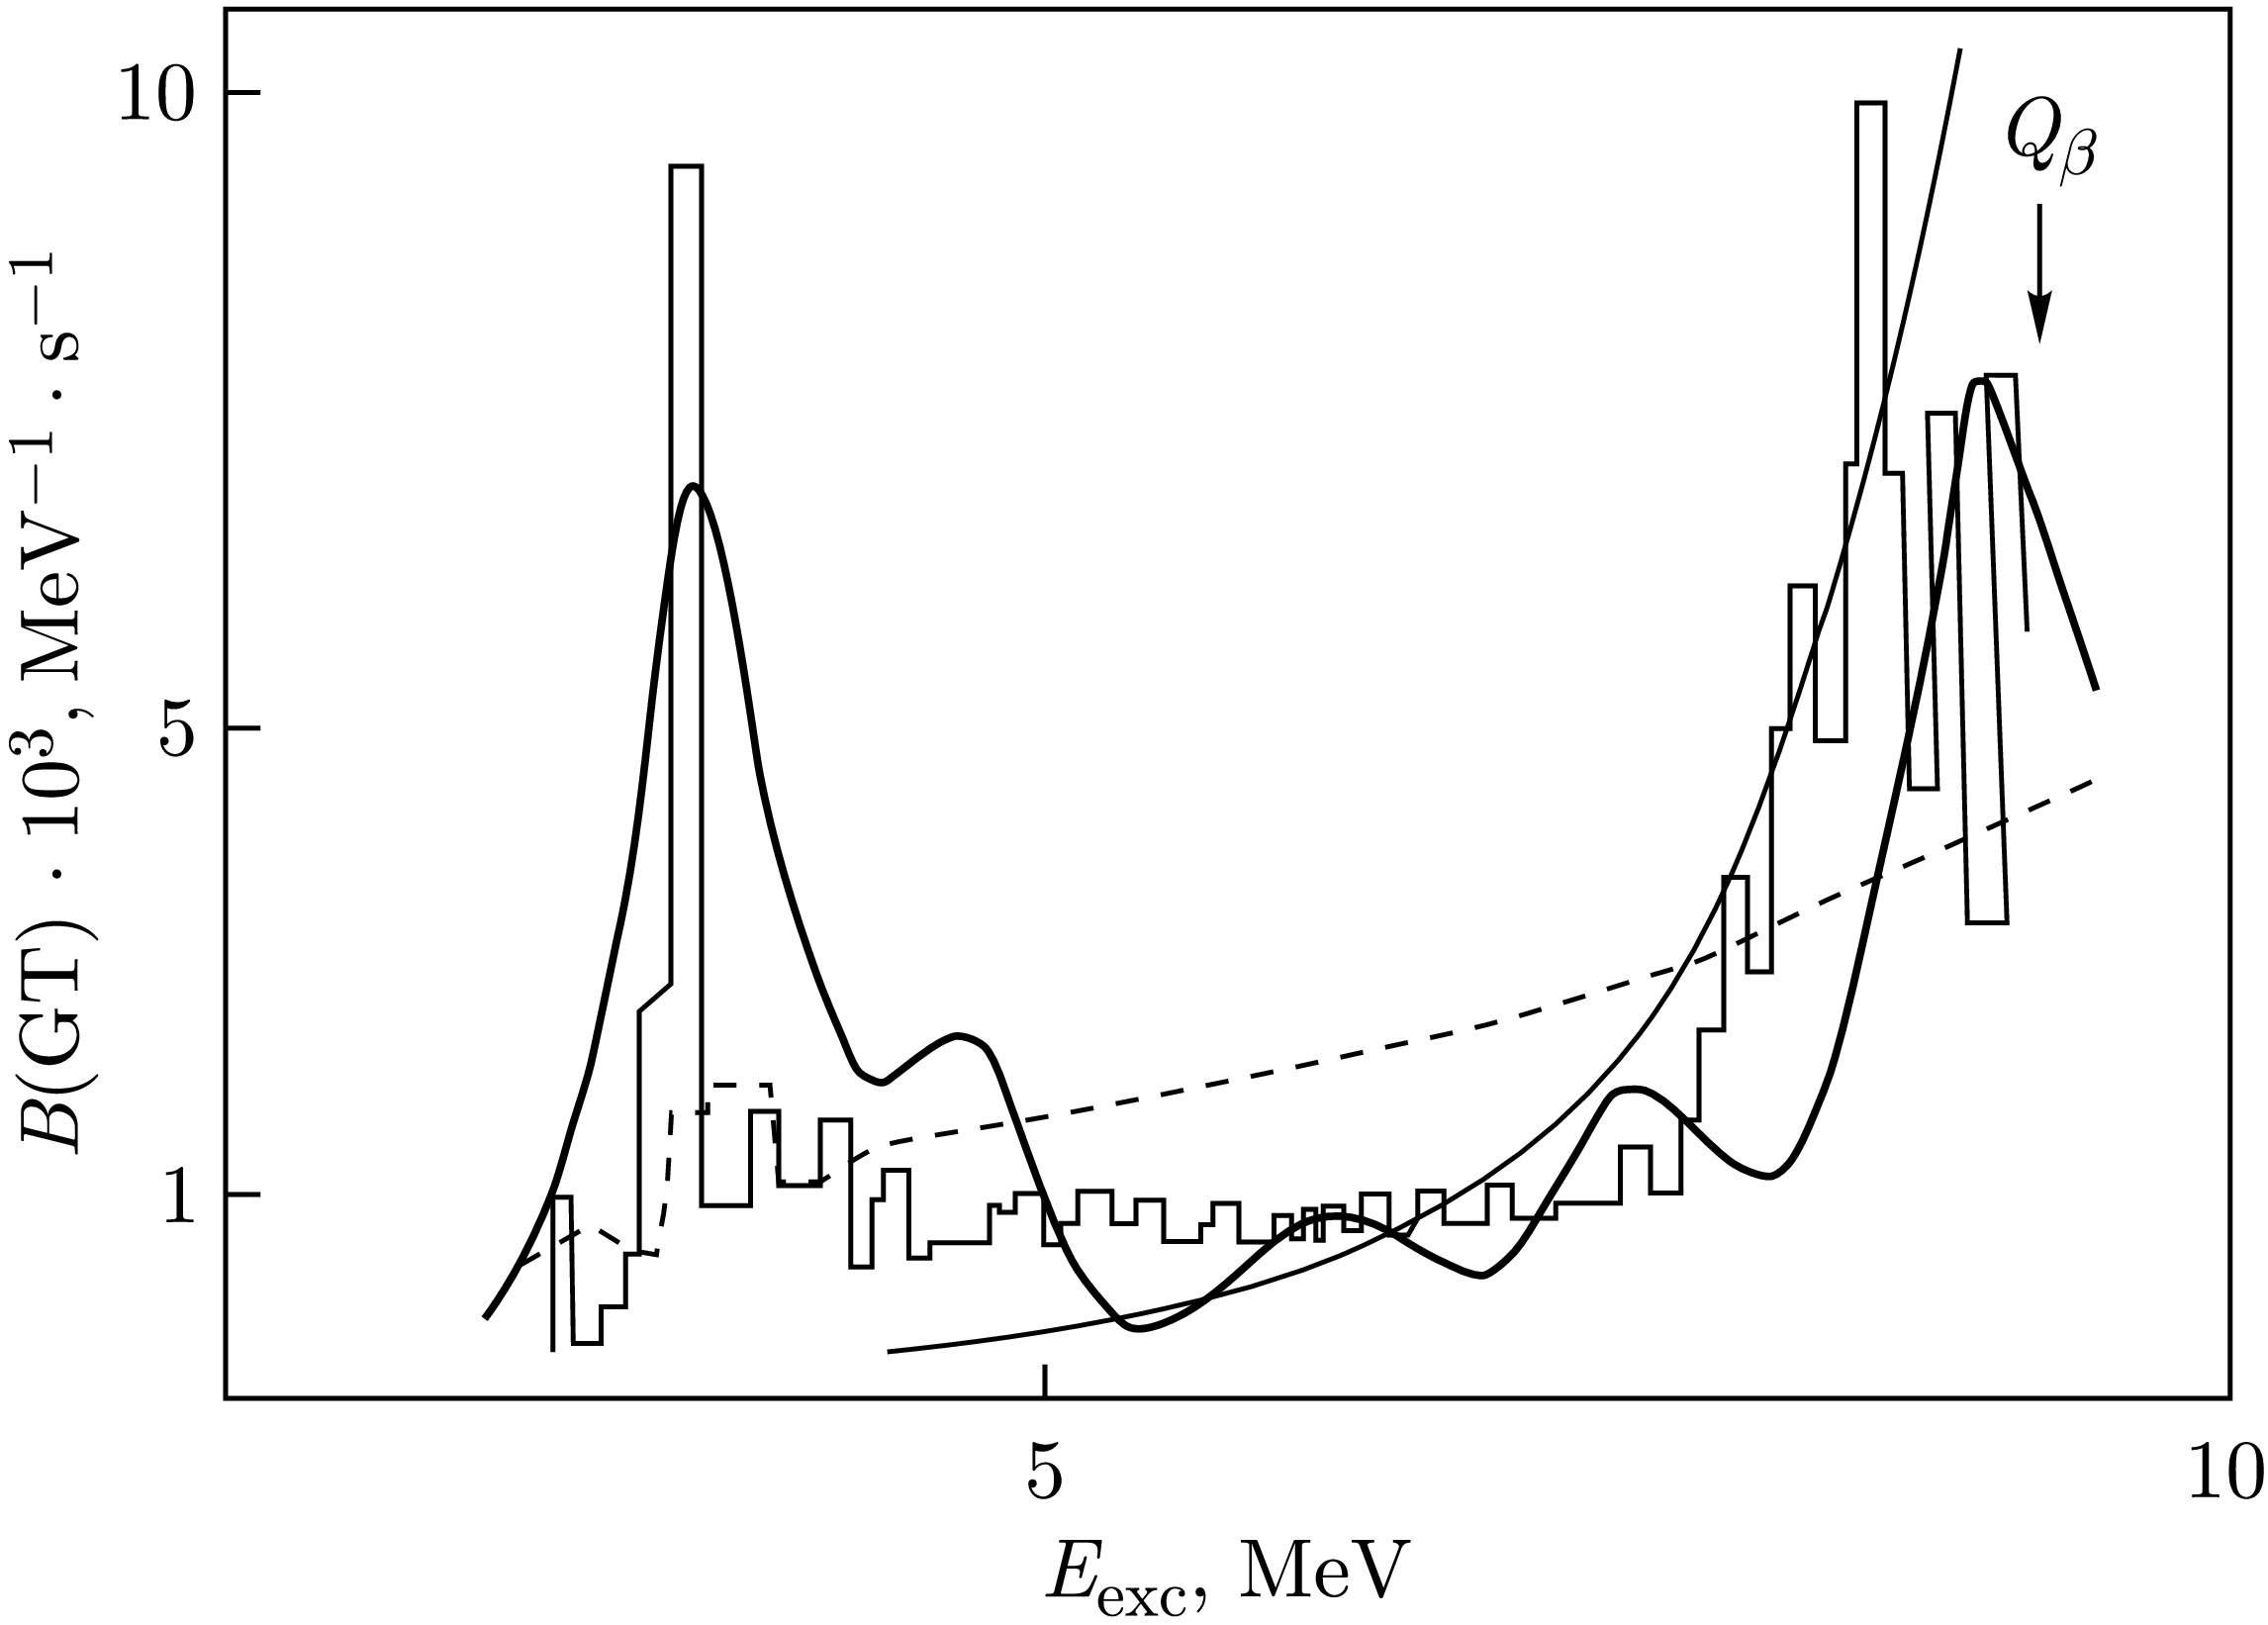
Figure 25.
$ S_{\beta}(E) $ for the$ \beta^{-} $ -decay of$ ^{95} {\rm{Rb}}$ to$ ^{95} {\rm{Sr}}$ : experimental data from analysis of the delayed neutron spectra and theoretical calculations. The heavy solid line denotes$ S_{\beta}(E) $ calculated using the microscopic model including the Gamow–Teller residual interaction, histogram$ S_{\beta }(E) $ is obtained by processing the delayed neutron spectrum of$ ^{95} {\rm{Sr}}$ , the thin solid line represents the calculation using the statistical model$ S_{\beta} \sim \rho (E) $ , and the dashed line is the calculation using the gross theoryIn some studies, data are given only on the probabilities of delayed neutron emission
$ P_{n} $ , i.e., the probability of delayed neutron emission per act of$ \beta^{-} $ -decay Eq. (22), where$ \Gamma_{n} \equiv \Gamma_{d} $ and$ \Gamma_{n}/\Gamma_{\text{tot}} $ is the ratio of neutron width to total width for decay of a level with excitation energy E.$ P_{n} $ values vary from fractions of a percent to tens of percent [4−6, 11, 29, 34] and are sensitive to the shape of$ S_{\beta}(E) $ . Only by considering the structure of$ S_{\beta}(E) $ can one describe$ P_{n} $ for a wide range of nuclei [4−6, 11, 52]. However, it is not always possible to achieve close agreement between theoretical and experimental$ P_{n} $ values and spectral characteristics of delayed neutrons. This is related to the fact that one should use$ S_{\beta}(E) $ with realistic peak widths, while reliable calculation of widths is quite problematic. Additionally, statistical approaches are applied to calculate$ \Gamma_{n} $ and$ \Gamma_{\text{tot}} $ , which is a kind of approximation [4, 6, 11].Another remark, general for calculations of delayed process characteristics, is that the reliability of calculations is rather low if the parameters determining the energetics of the delayed process (
$ Q_{\beta } $ ,$ B_{x} $ , etc.) are poorly known. This adverse effect on calculations is especially strong when$ S_{\beta}(E) $ has peaks close to$ Q_{\beta} $ or$ B_{x} $ . Therefore, one should be cautious with predictions of delayed process characteristics in the region of nuclei far from the β-stability line [4, 6, 11].For analyzing the probability of beta-delayed fission, emission of beta-delayed protons, and beta-delayed alpha particles, the energy dependence of
$ S_{\beta}(E) $ is very significant in the window$ (Q_{\beta} - E_{\text {thr}}) $ . For beta-delayed neutrons, generally only the integral quantity of beta-strength in$ (Q_{\beta} - E_{\text {thr}}) $ is important. Of course, for analyzing delayed particle spectra, the energy dependence of$ S_{\beta}(E) $ is significant in all cases.In β-decay, simple (non-statistical) configurations are populated, and, as a consequence, non-statistical effects can be observed in the γ-decay of such configurations. In analyzing delayed processes, γ-decay widths
$ \Gamma_{\gamma} $ are calculated using the statistical model, which, generally speaking, can only be an approximation. Since information about γ-decay is very important for analyzing delayed processes, it is necessary to account for the influence of non-statistical effects on the probability of delayed processes not only for β-decay but also for γ-decay. Strong non-statistical effects have been observed for both$ M1 $ - and$ E2 $ γ-transitions in nuclear ($ p,\gamma $ ) reactions [6, 53] for γ-decay of non-analogue resonances.However, since the resonance wave function can also contain an admixture of a statistical component [6, 53], this admixture leads to statistical fluctuations in the distribution of values of the
$ E2/M1 $ multipole mixing ratio δ (Fig. 26). From the magnitude of these fluctuations, one can estimate the fraction of the non-statistical component in the resonance wave function. It turned out that for the considered γ-decays of non-analogue resonances with fixed spin-parity values$ I^{\pi} = 3/2^{-} $ in$ ^{59,\,61,\,63} {\rm{Cu}}$ , the fraction of the non-statistical component in the resonance wave function is about several tens of percent (from 20% to 50% [6, 53]).
Figure 26.
$ ^{62} {\rm{Ni}}$ $ (p,\gamma)^{63} {\rm{Cu}}$ reaction,$ E_{p} = 1943{-}3175 $ keV,$ E_{\text {res}} = 8040{-}9250 $ keV. Dependence of the$ E2/M1 $ multipole mixture δ (experimental data) for the γ-decay of$ 3/2^{-} $ nonanalog resonances to the g.s. ($ 3/2^{-}) $ of$ ^{63} {\rm{Cu}}$ on the proton energies. The experimental average value of δ is$ \langle \delta \rangle = 0.6 \pm 0.1 $ , while the statistical model gives$ \langle \delta \rangle = 0 $ Experimental data are presented (Figs. 26 and 27) that clearly indicate manifestation of non-statistical effects in the γ-decay of non-analogue resonances of the compound nucleus in reactions with protons [6, 53]. Non-statistical effects are associated with elementary modes of nuclear excitations, e.g., proton particle and neutron hole coupled to spin
$ 1^{+} $ , similar to GT β-decay. At the same time, resonances excited in reactions with neutrons are generally well described by the statistical model. Such a difference between properties of neutron and proton resonances may be related to the existence and structure of neutron excess in target nuclei [6, 53].
Figure 27. Distribution of the
$ E2/M1 $ multipole mixture δ for the γ-decay of$ 3/2^{-} $ nonanalog resonances to the g.s.($ 3/2^{-} $ ) of$ ^{63} {\rm{Cu}}$ .$ ^{62} {\rm{Ni}}$ $ (p,\gamma)^{63} {\rm{Cu}}$ reaction. The distribution of experimental values of δ is radically different from the statistical model (Cauchy distribution). Statistical model (dotted line) gives$ \langle\delta \rangle = 0 $ , experiment can be described by the normal distribution with$ \langle \delta \rangle = 0.6 $ .$ E_{p} = 1943{-}3175 $ keV,$ E_{\text {res}} = 8040{-}9250 $ keV [53]For correct calculations of probabilities of beta-delayed processes
$ P_{\beta d} $ , information and systematics are needed both on the structure of$ S_{\beta}(E) $ and on the values of$ \Gamma_{\gamma} $ . Only after proper accounting of non-statistical effects for both β-decay and γ-decay can quantitative conclusions about delayed processes be made. -
In general, the term "halo" is used when the halo nucleon(s) spend at least 50% of the time outside the potential core region, i.e., in the classically forbidden region [54−59]. Necessary conditions for halo formation are: small binding energy of the valence particle(s), small relative angular momentum
$ L=0,1 $ for two-particle or hyper-momentum$ K=0,1 $ for three-particle halo systems, and not too high level density (weak mixing with non-halo states). The Coulomb barrier can suppress proton halo formation at$ Z \gt 10 $ . Neutron and proton halos have been observed in several nuclei [54−57]. In Borromean systems (Borromean halo), two-particle correlations are too weak to bind any pair of particles, while three-particle correlations are responsible for binding the system as a whole. In states where there is one and only one bound subsystem, the bound particles move in phase and were therefore called "tango-halo" [16−18, 20].When the parent nuclear state has a structure of a two-neutron Borromean halo, the isobaric analogue resonance and configuration states can simultaneously have
$ nn $ and$ np $ components of a Borromean halo in their wave functions [19, 20]. After$ M1 $ γ-decay of an IAR with npnp Borromean halo structure or GT$ \beta^{-} $ -decay of parent nuclei with$ nn $ Borromean halo structure, states with$ np $ tango-type halo structure or mixed structure of type$ np $ tango halo$ \,+\,nn $ Borromean halo can be populated [20−22]. Resonances in the GT beta-decay strength function$ S_{\beta }(E) $ of halo nuclei can have an$ np $ tango-halo structure or a mixed structure$ np $ tango halo$ \,+\,nn $ Borromean halo.The two neutrons forming an
$ nn $ halo in the ground state (g.s.) of 6He occupy the$ 1p $ orbit (configuration$ p_{3/2} $ with 7% admixture of$ p_{1/2} $ configuration). The remaining two neutrons and two protons occupy the$ 1s $ orbit. The operator$ {\boldsymbol{T}}_{-} $ lowers the isospin projection by one unit without changing the isospin magnitude. Therefore, action of the operator$ {\boldsymbol{T}}_{-} $ on the ground state wave function of the nucleus 6He ($ T = 1 $ ,$ T_{z} = 1 $ ) leads to formation of an analogue state with a configuration corresponding to a$ np $ halo [60]. This IAR is in the nucleus 6Li ($ T = 1 $ ,$ T_{z} = 0 $ ) at an excitation energy of 3.56 MeV. The width of this state is$ \Gamma = 8.2 $ eV, corresponding to a half-life$ T_{1/2} = 6\cdot 10^{-17} $ s. Theoretical and experimental data indicate that this IAR state has an$ np $ halo [17, 60−62]. Formation of configuration states is forbidden by the Pauli principle. The isobaric analogue state (IAS) of the g.s. of 6He (an$ nn $ Borromean halo nucleus), i.e., the$ I=0^{+} $ state of 6Li with energy 3.56 MeV, has a Borromean-type$ np $ halo structure [17, 18, 60].In general [63], the IAS (Figs. 28 and 29) is a coherent superposition of neutron hole – proton particle type excitations coupled to angular momentum
$ J = 0^{+} $ . The IAS has isospin$ T=T_{z}+1 = $ $ (N-Z)/2+1 $ , where$ T_{z}=(N-Z)/2 $ is the isospin projection. The isospin of the g.s. is$ T = T_{z} = (N-Z)/2 $ . When the IAS energy corresponds to the continuum, the IAS can be observed as a resonance. Configuration states (CS) are not a coherent superposition of such excitations and have$ T = T_{z}= (N-Z)/2 $ . One of the most studied CS is the anti-isobaric analogue state (AIAS) (Fig. 30). Formation of CS can be limited by the Pauli principle. The double isobaric analogue state (DIAS) has isospin$ T = T_{z}+ 2 $ and is formed (Figs. 28 and 31) as a coherent superposition of two neutron holes – two protons type excitations coupled to angular momentum$ J = 0^{+} $ .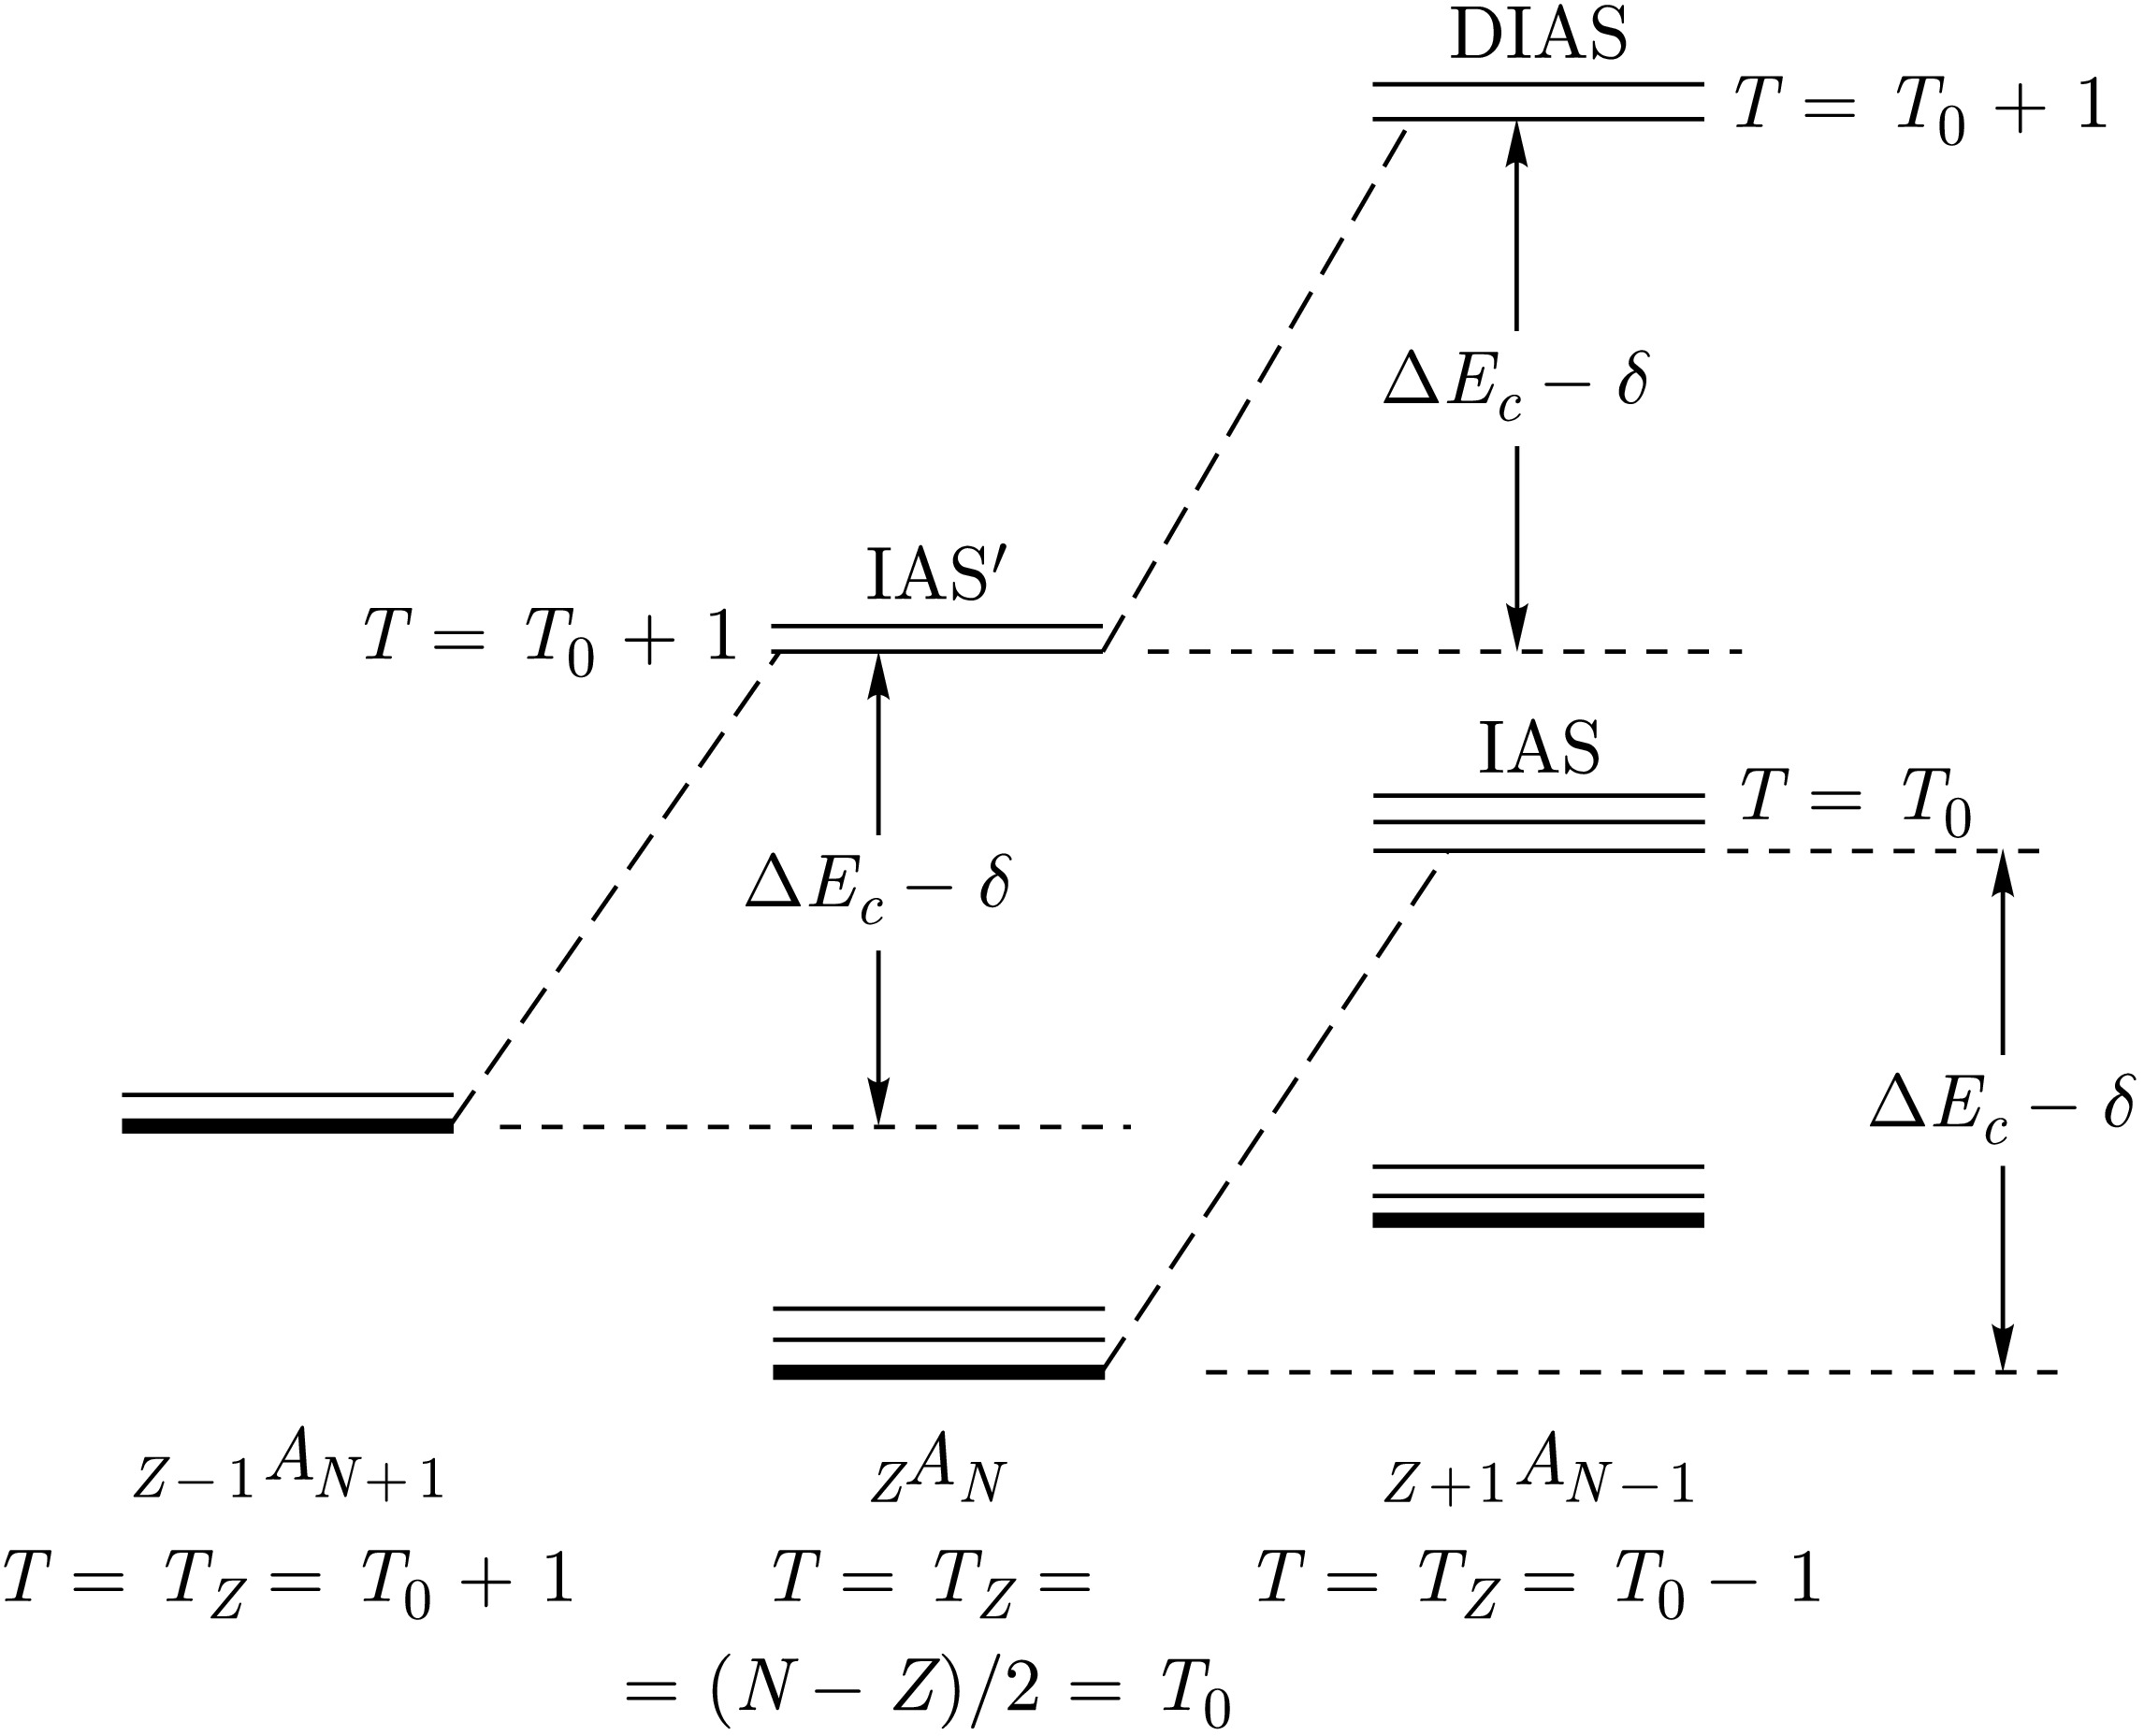
Figure 28. Diagram of isobar-analog (analog) and double isobar-analog (double analog) states, where δ is the difference of the proton and neutron masses and
$ \Delta E_{c} $ is the Coulomb energy of the added proton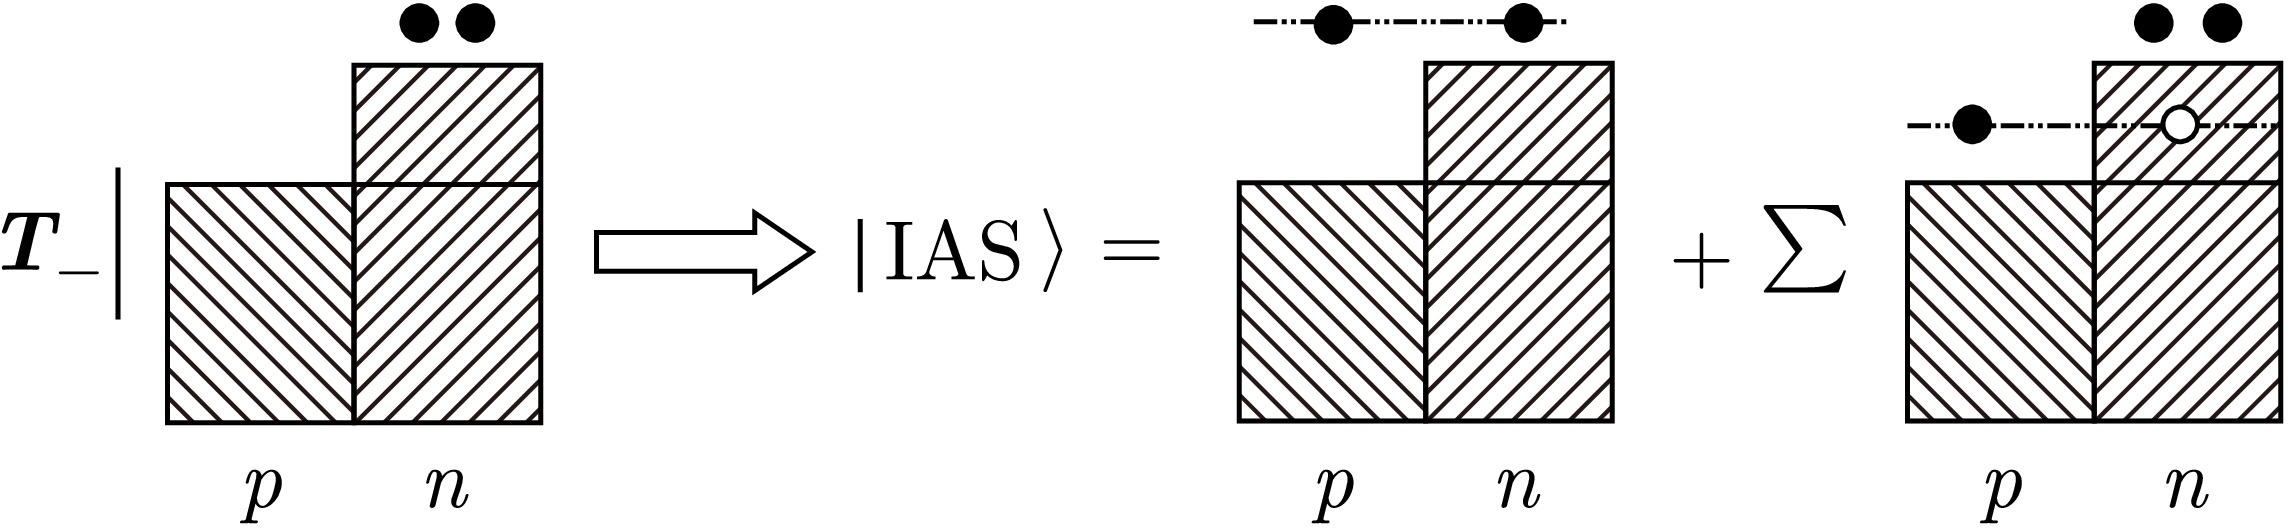
Figure 29. Structure of the IAS wave function obtained upon the application of the operator
$ {\boldsymbol{T}}_{-} $ to the wave function for the parent$ nn $ halo nucleus [17, 18, 60]. Closed circles above the respective squares represent neutrons and protons of the$ nn $ and$ pn $ halos, while an open circle within the square denotes neutron holes. Rectangles stand for the states occupied by protons and neutrons, respectively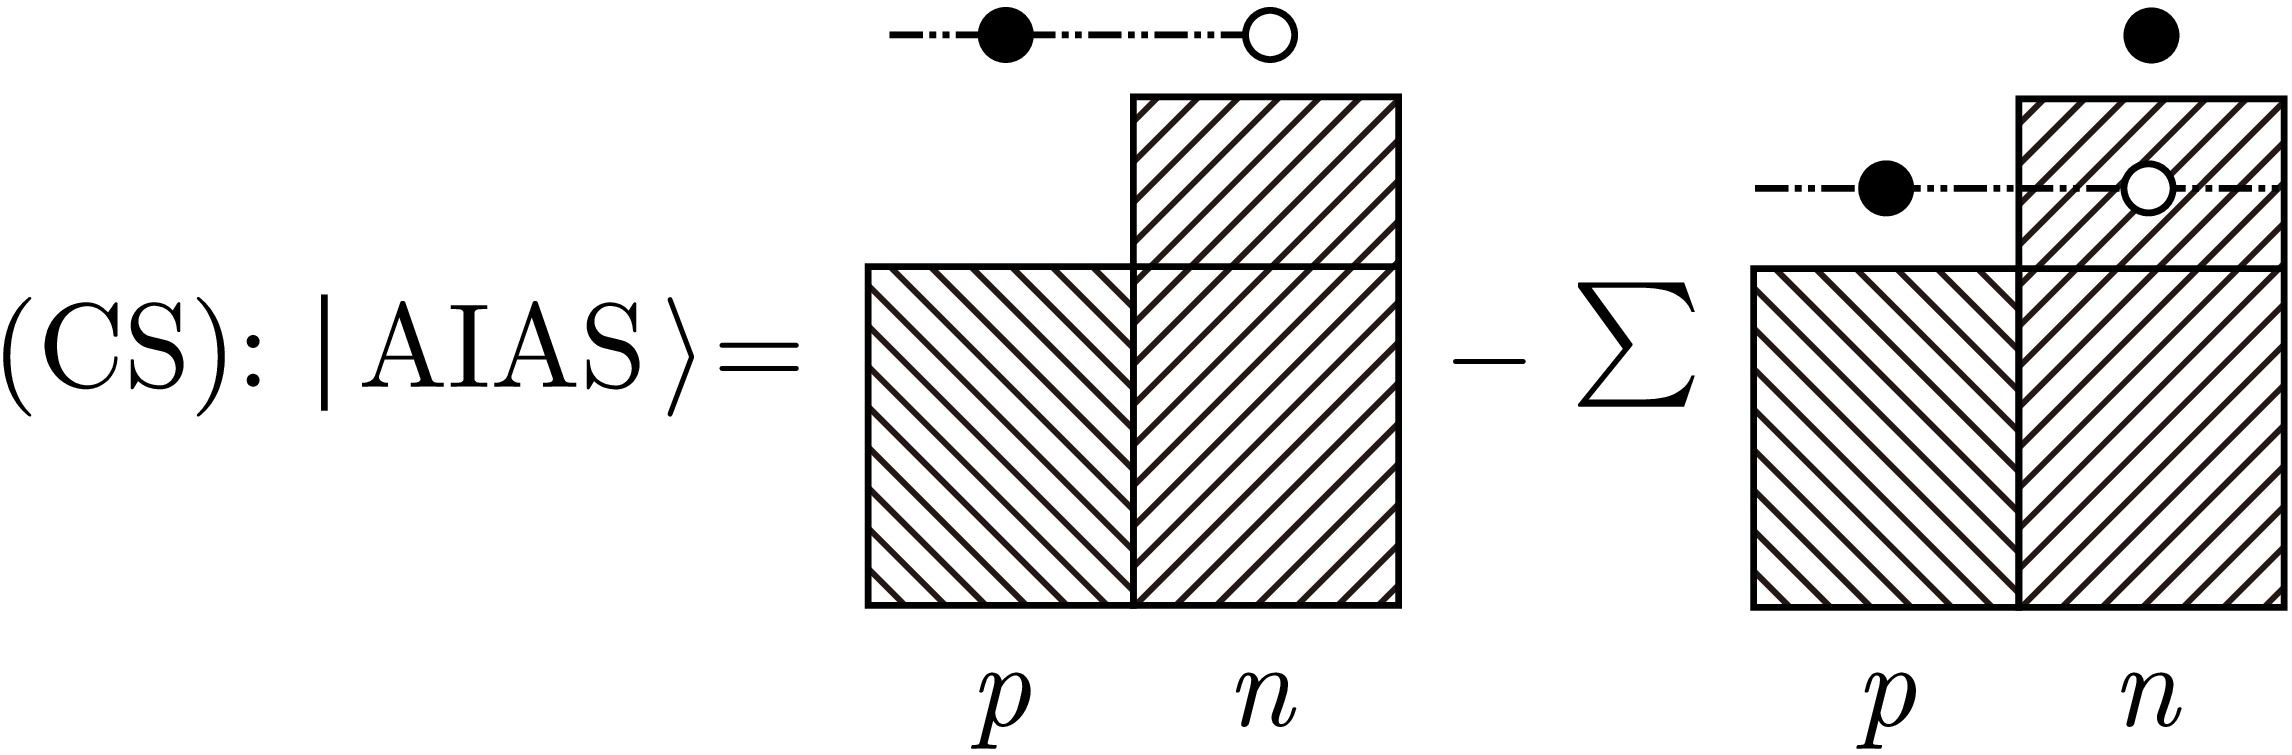
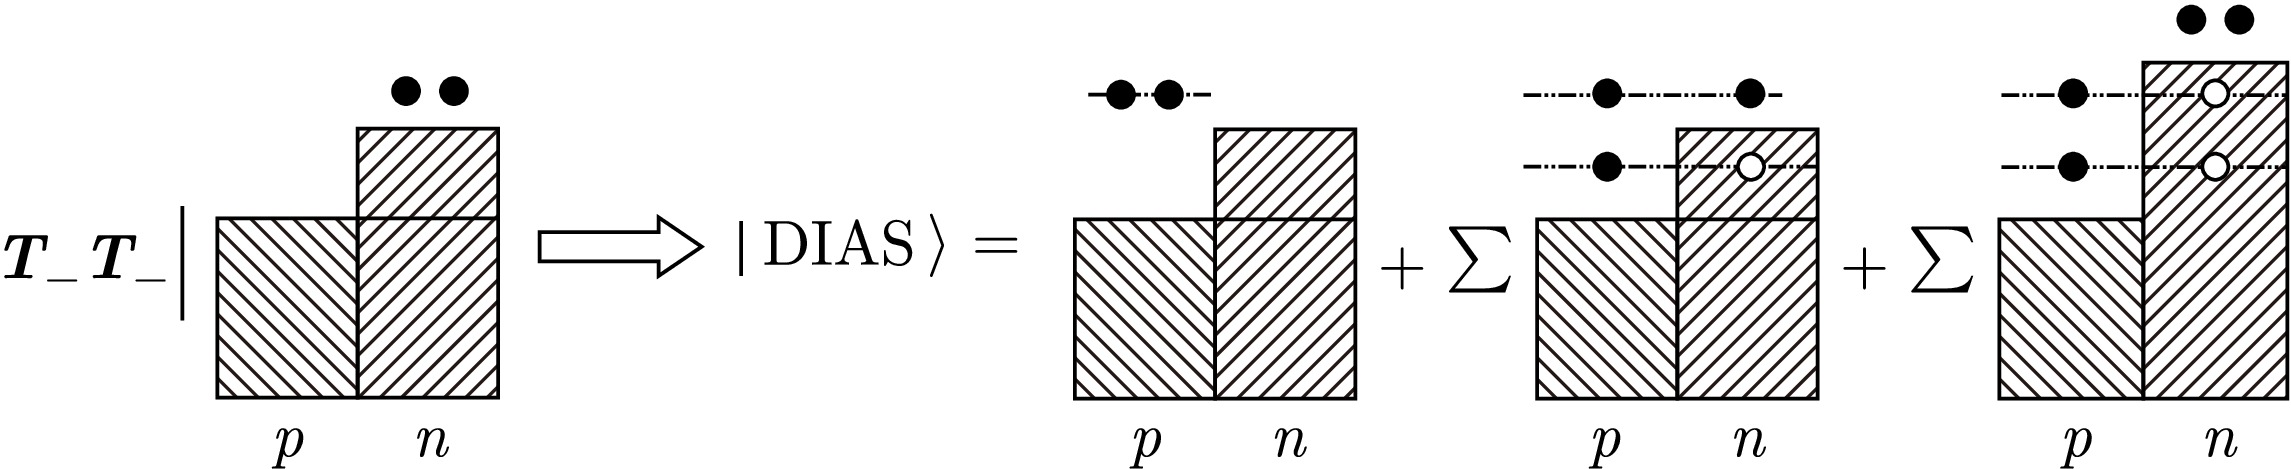
Figure 31. Structure of the DIAS wave function for halo nuclei can be obtained after application of the operator
$ {\boldsymbol{T}}_{-}{\boldsymbol{T}}_{-} $ to the wave function for the parent$ nn $ halo nucleus. The DIAS wave function will contain the$ pp $ ,$ pn $ , and$ nn $ halo configurations [16–22]. The notation for neutrons and protons in the parent nucleus and for neutron holes in the DIAS is identical to that in Fig. 29For Fermi
$ \beta^{-} $ -transitions, significant configurations include states formed from the g.s. of the parent nucleus by the action of the nuclear isospin ladder operator$ {\boldsymbol{T}}_{-} $ :$ {\boldsymbol{T}}_- = \Sigma\,{\boldsymbol{a}}_{{\boldsymbol{i}}+} ({\boldsymbol{p}}) \cdot {\boldsymbol{a}}_{{\boldsymbol{i}}-} ({\boldsymbol{n}}) = \Sigma\,{{\tau}}({\boldsymbol{i}})_-. $
(23) $ {\boldsymbol{T}}_{-} $ is the operator for transformation of the neutron to the proton without a change in the function of the state in which the particle is. The β-decay strength of the Fermi-type β-transitions is concentrated in the IAS region. The wave function for IAS and CS [16–22] involves both configurations corresponding to the proton–neutron Borromean halo ($ np $ halo) and two-neutron Borromean halo ($ nn $ halo).For the GT
$ \beta^{-} $ -transitions, essential states include the configurations made up of the g.s. of parent nucleus by the action of the Gamow–Teller operator [18, 20–22]$ {\boldsymbol{Y}}_{-} $ :$ {\boldsymbol{Y}}_- = \Sigma\,{{\tau}}({\boldsymbol{i}})_- \,{ {\sigma}}({\boldsymbol{i}}), $
(24) where
$ {{\tau}}({\boldsymbol{i}})_{-} \,{ {\sigma}}({\boldsymbol{i}}) $ is a spin–isospin operator. Acting on the ground state of parent nuclei by the operator$ {\boldsymbol{Y}}_{-} $ results in formation of configurations of proton particle ($ \pi p) $ –neutron hole ($ \nu h $ ) coupled to a spin-parity$ I^{\pi}=1^{+} $ . These are [4, 6, 11, 20–22] the so-called (Figs. 2, 32–34) core polarization, back spin flip and spin flip configurations.Coherent superposition [4, 6, 11] of CP, BSF and SF configurations forms the GTR. Non-coherent superposition forms so-called satellite (or pigmy) resonances in
$ S_{\beta}(E) $ at excitation energy E lower than the energy of the GTR. Since after action of$ {\boldsymbol{Y}}_{-} $ operator on$ nn $ Borromean halo state with$ I^{\pi} = 0^{+} $ the$ np $ tango halo configurations with$ I^{\pi} = 1^{+} $ are formed (Figs. 32–34), the GT and pigmy resonances in$ S_{\beta}(E) $ will have components corresponding to$ np $ tango halo [20–22]. When neutron excess is high enough, the SF, CP and BSF configurations may simultaneously contain both$ nn $ Borromean halo component and$ np $ tango halo component and form (Figs. 32–34) the so-called mixed halo [16, 20–22].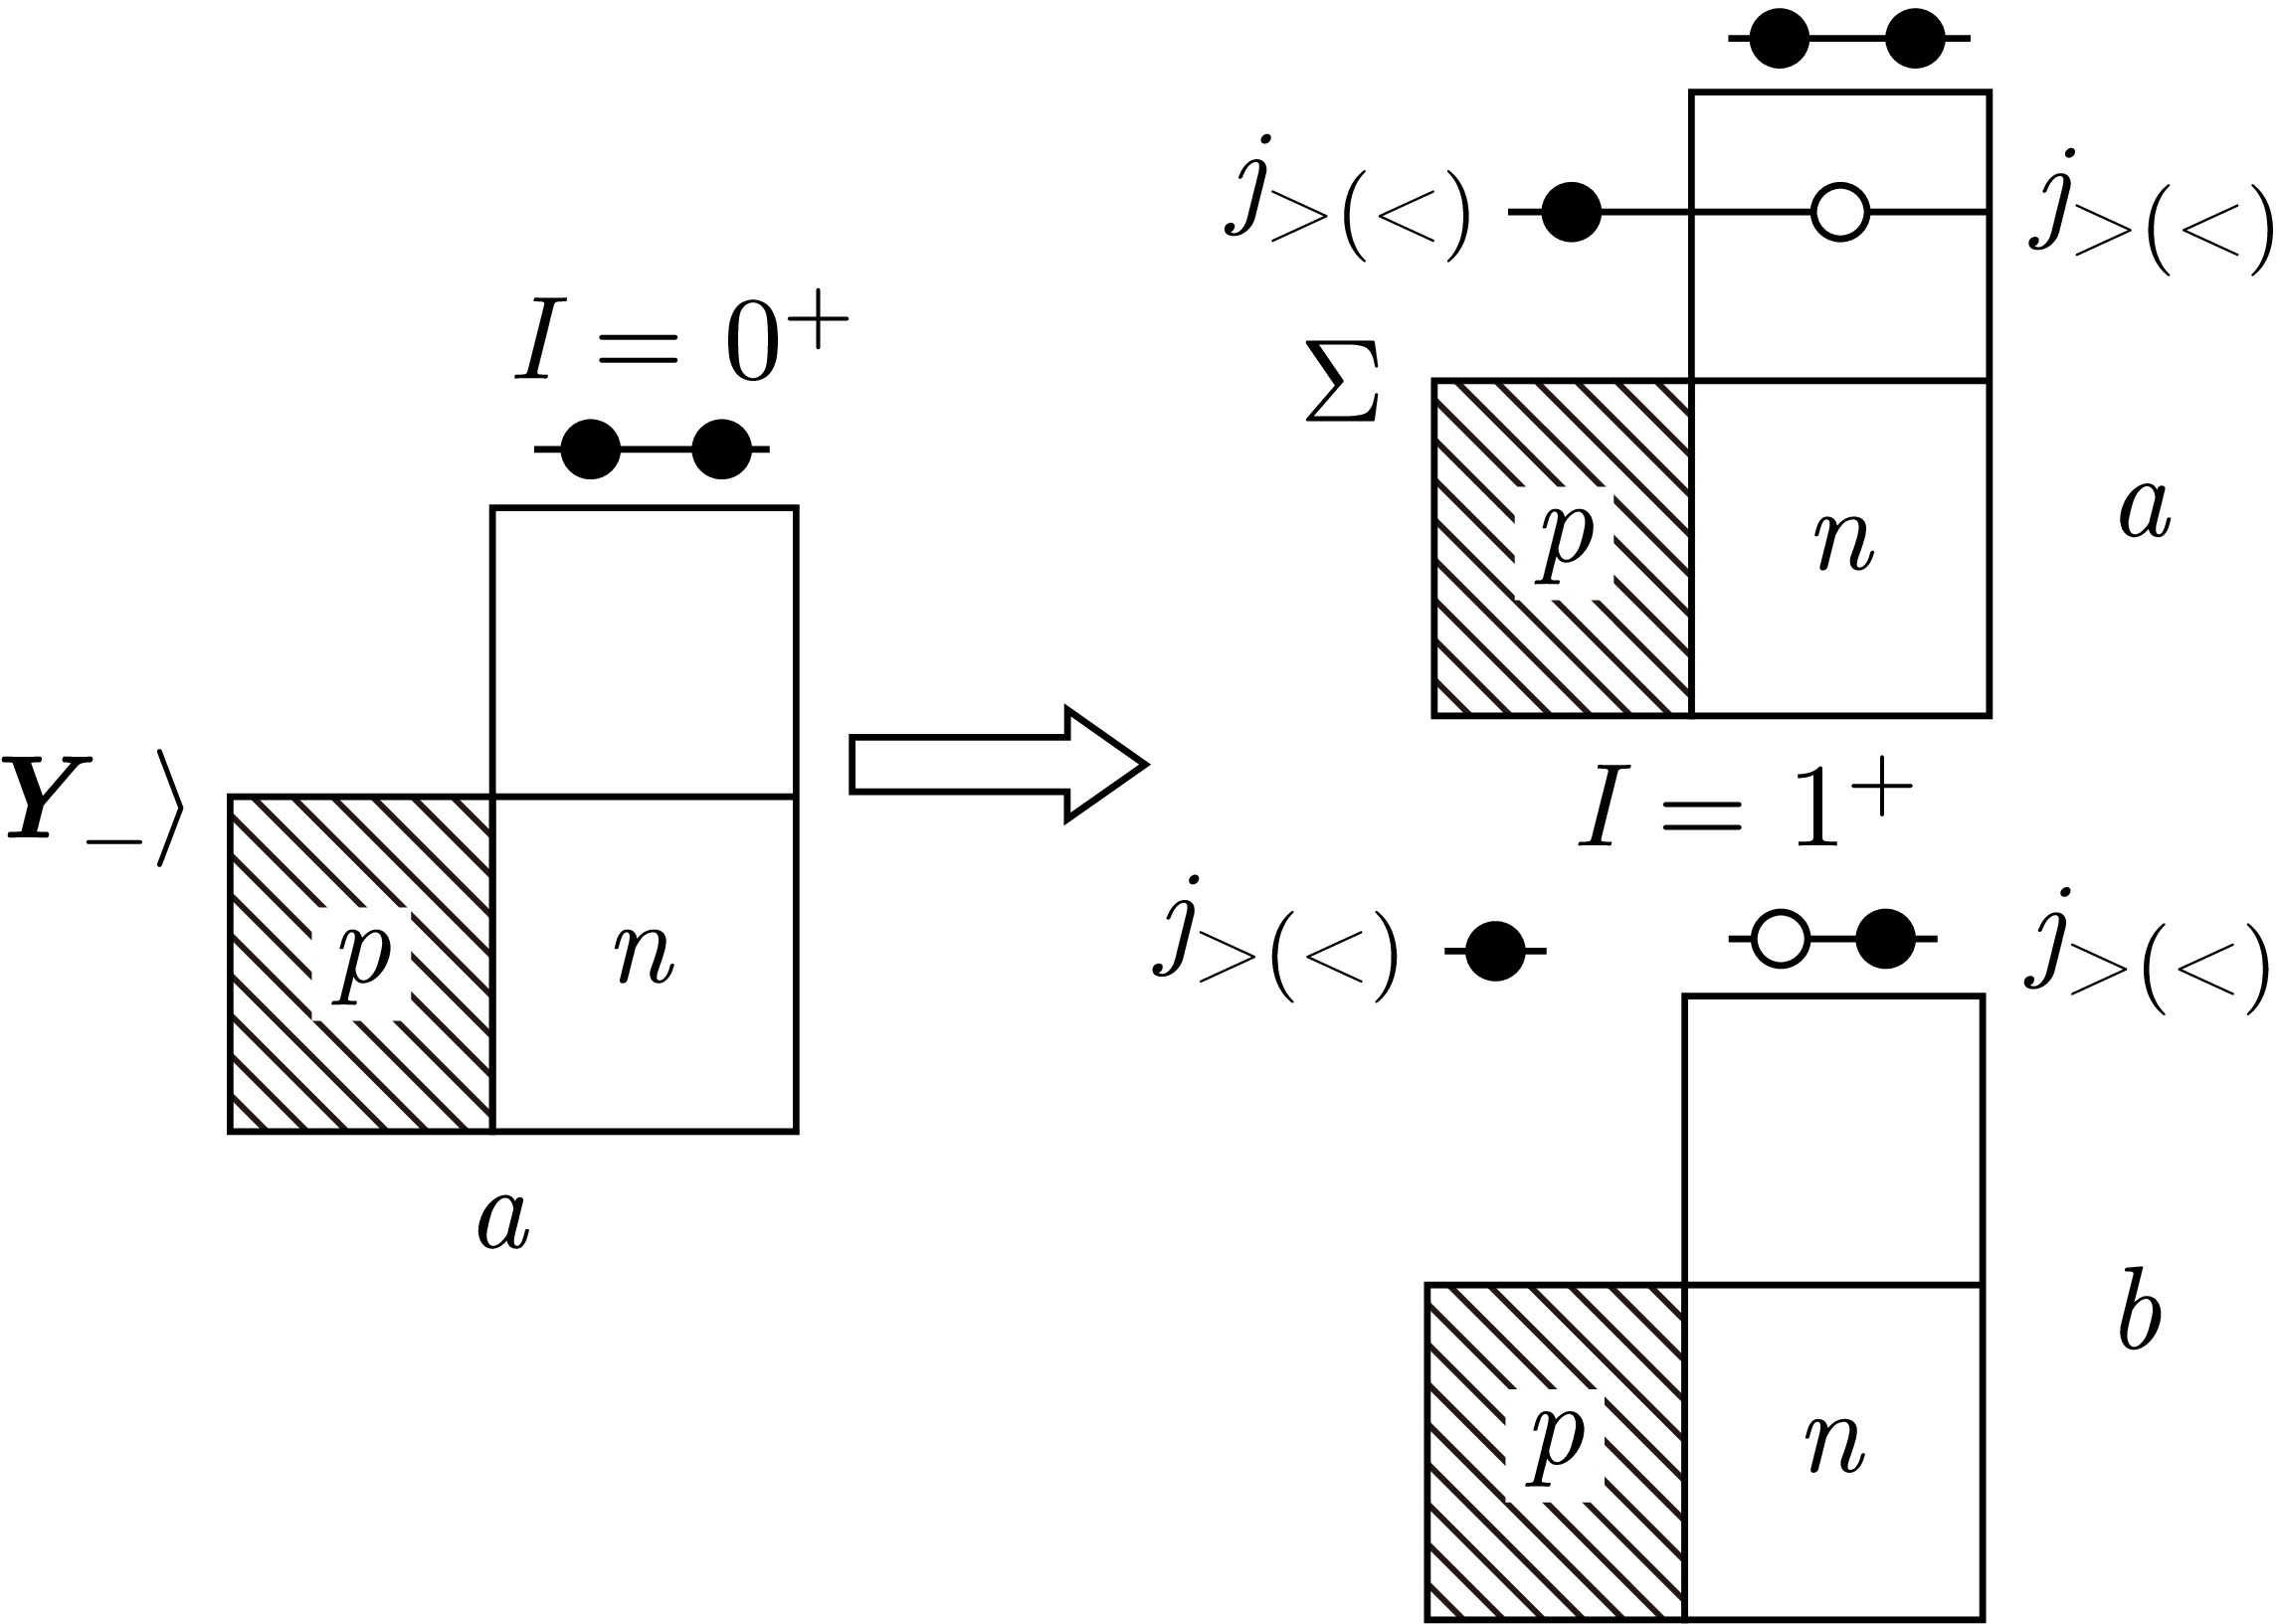
Figure 32. Structure of the CP states in halo nuclei. Proton particle–neutron hole coupled to form the spin-parity
$ I^{\pi} = 1^{+} $ and to form: a)$ nn $ Borromean halo component; b)$ np $ tango halo component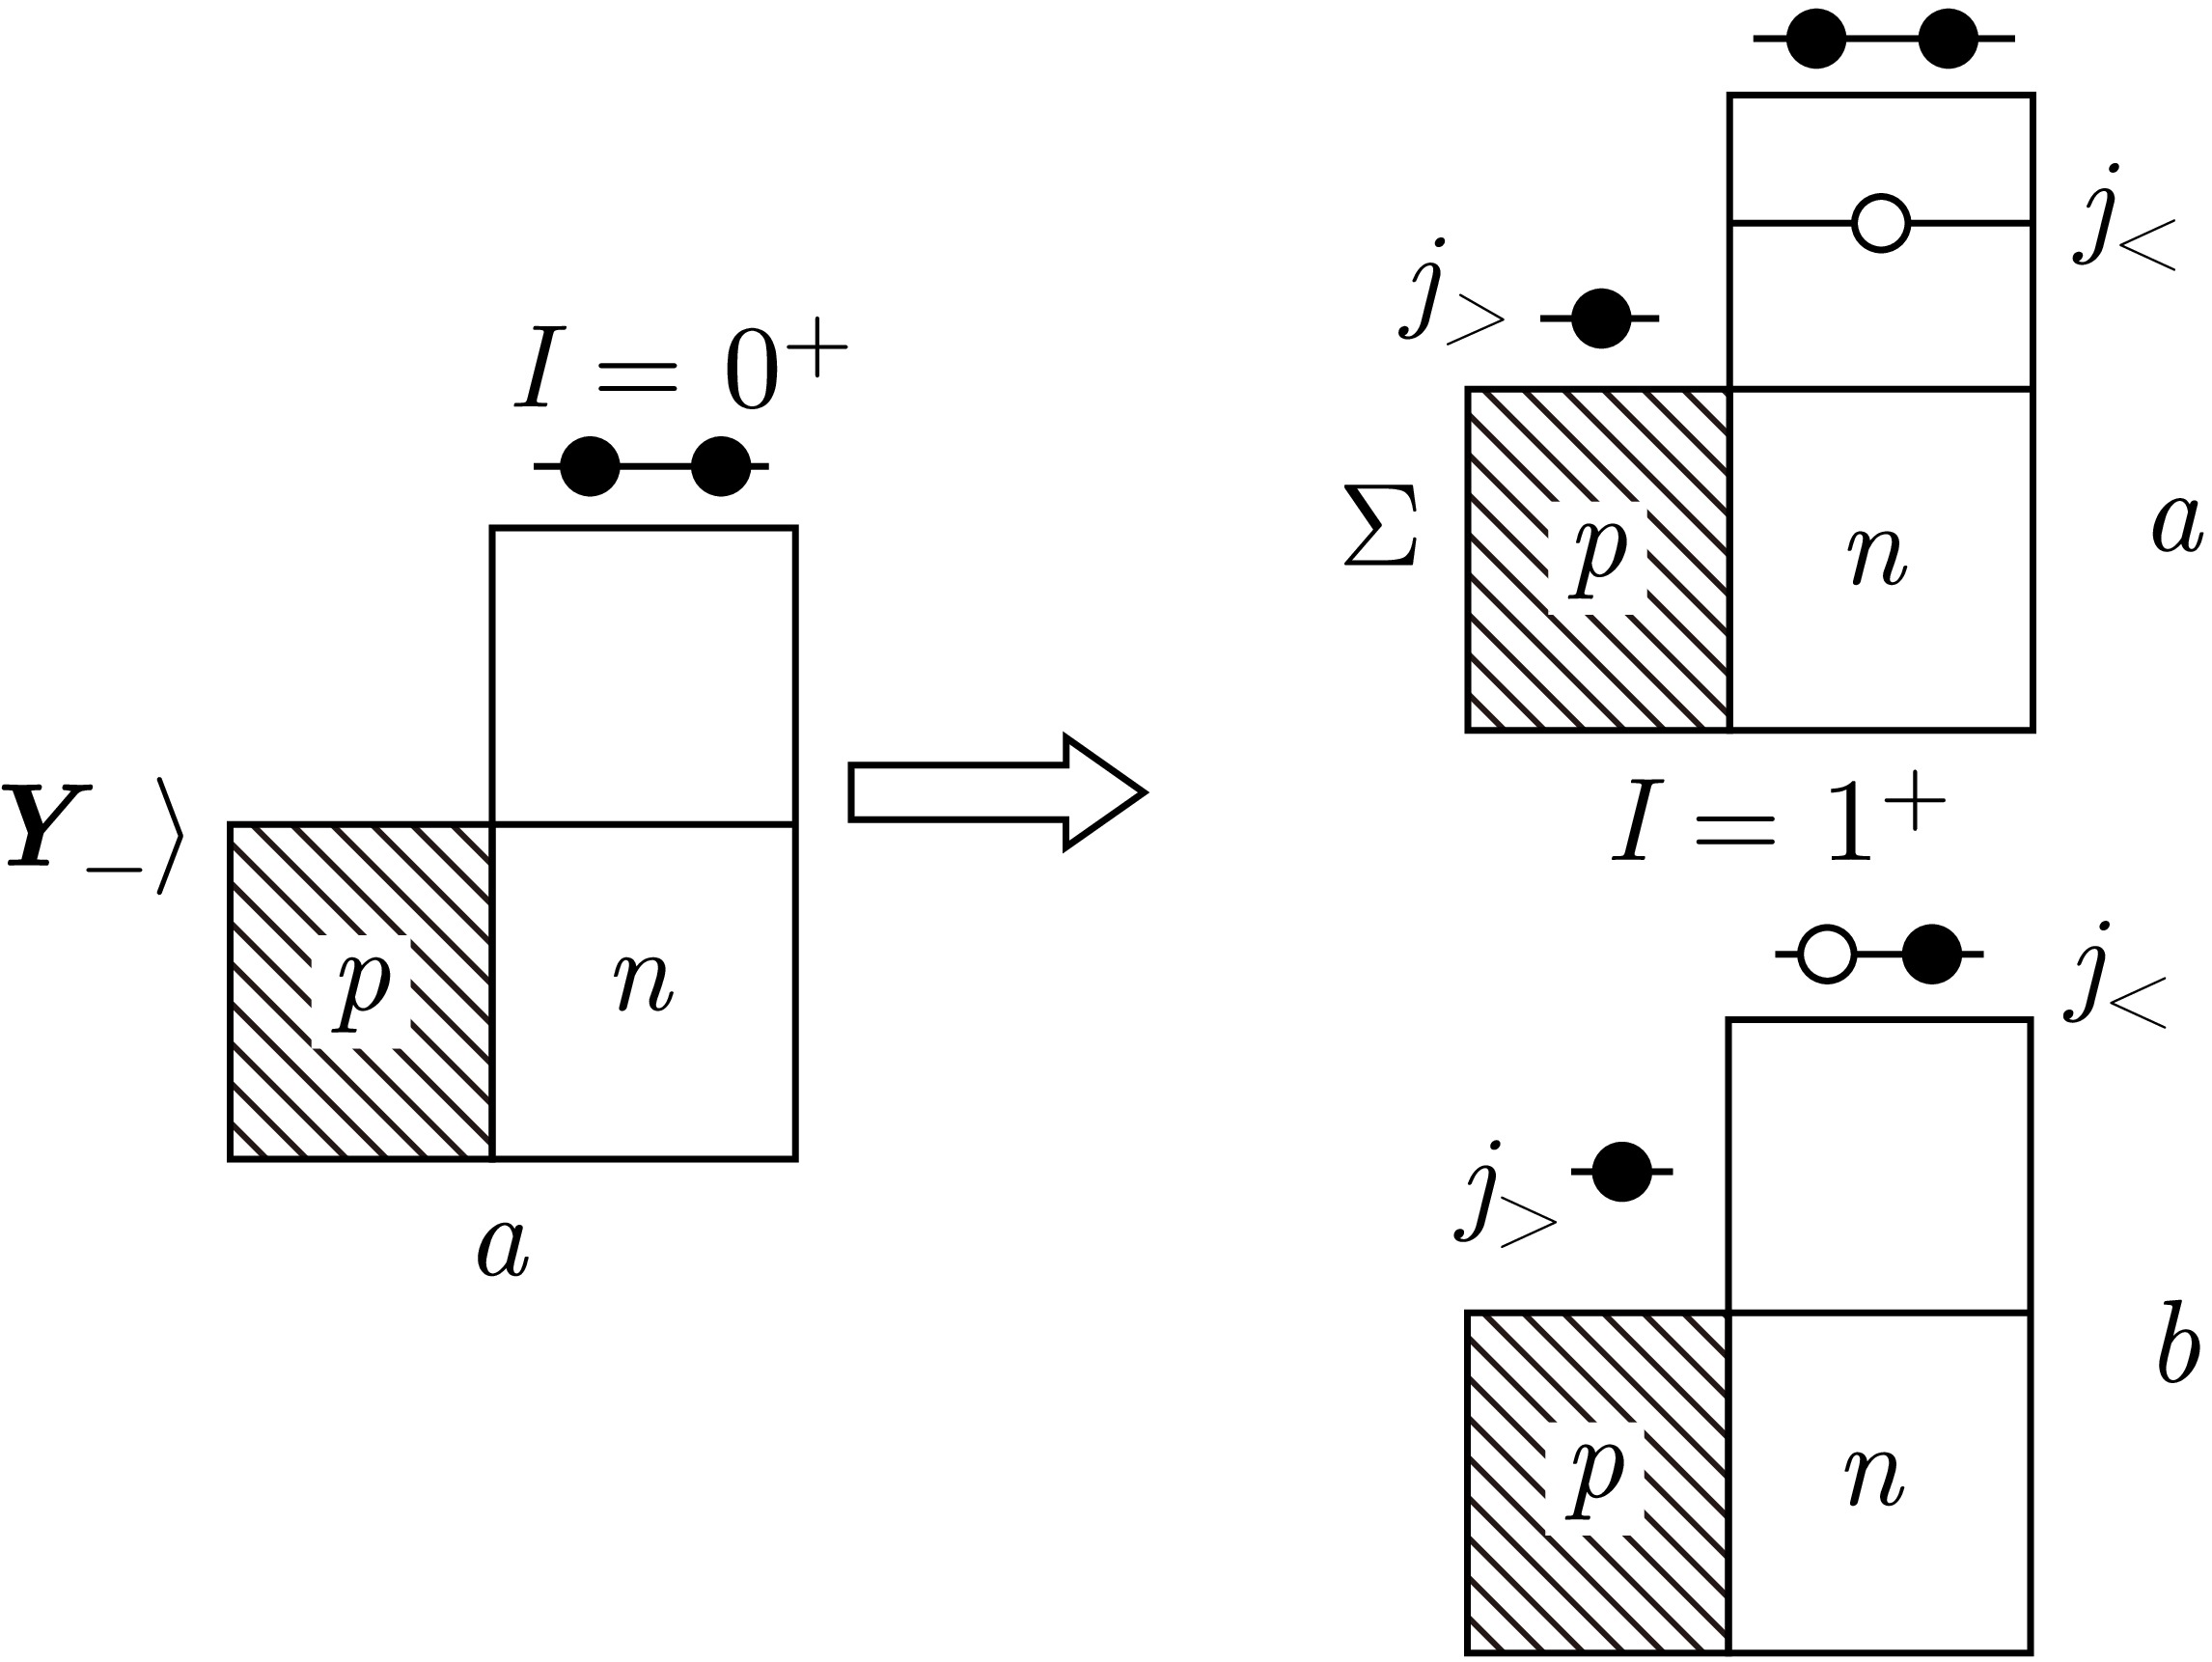
Figure 33. Structure of the BSF states in halo nuclei. Proton particle–neutron hole coupled to form the spin-parity
$ I^{\pi} = 1^{+} $ and to form: a)$ nn $ Borromean halo component; b)$ np $ tango halo component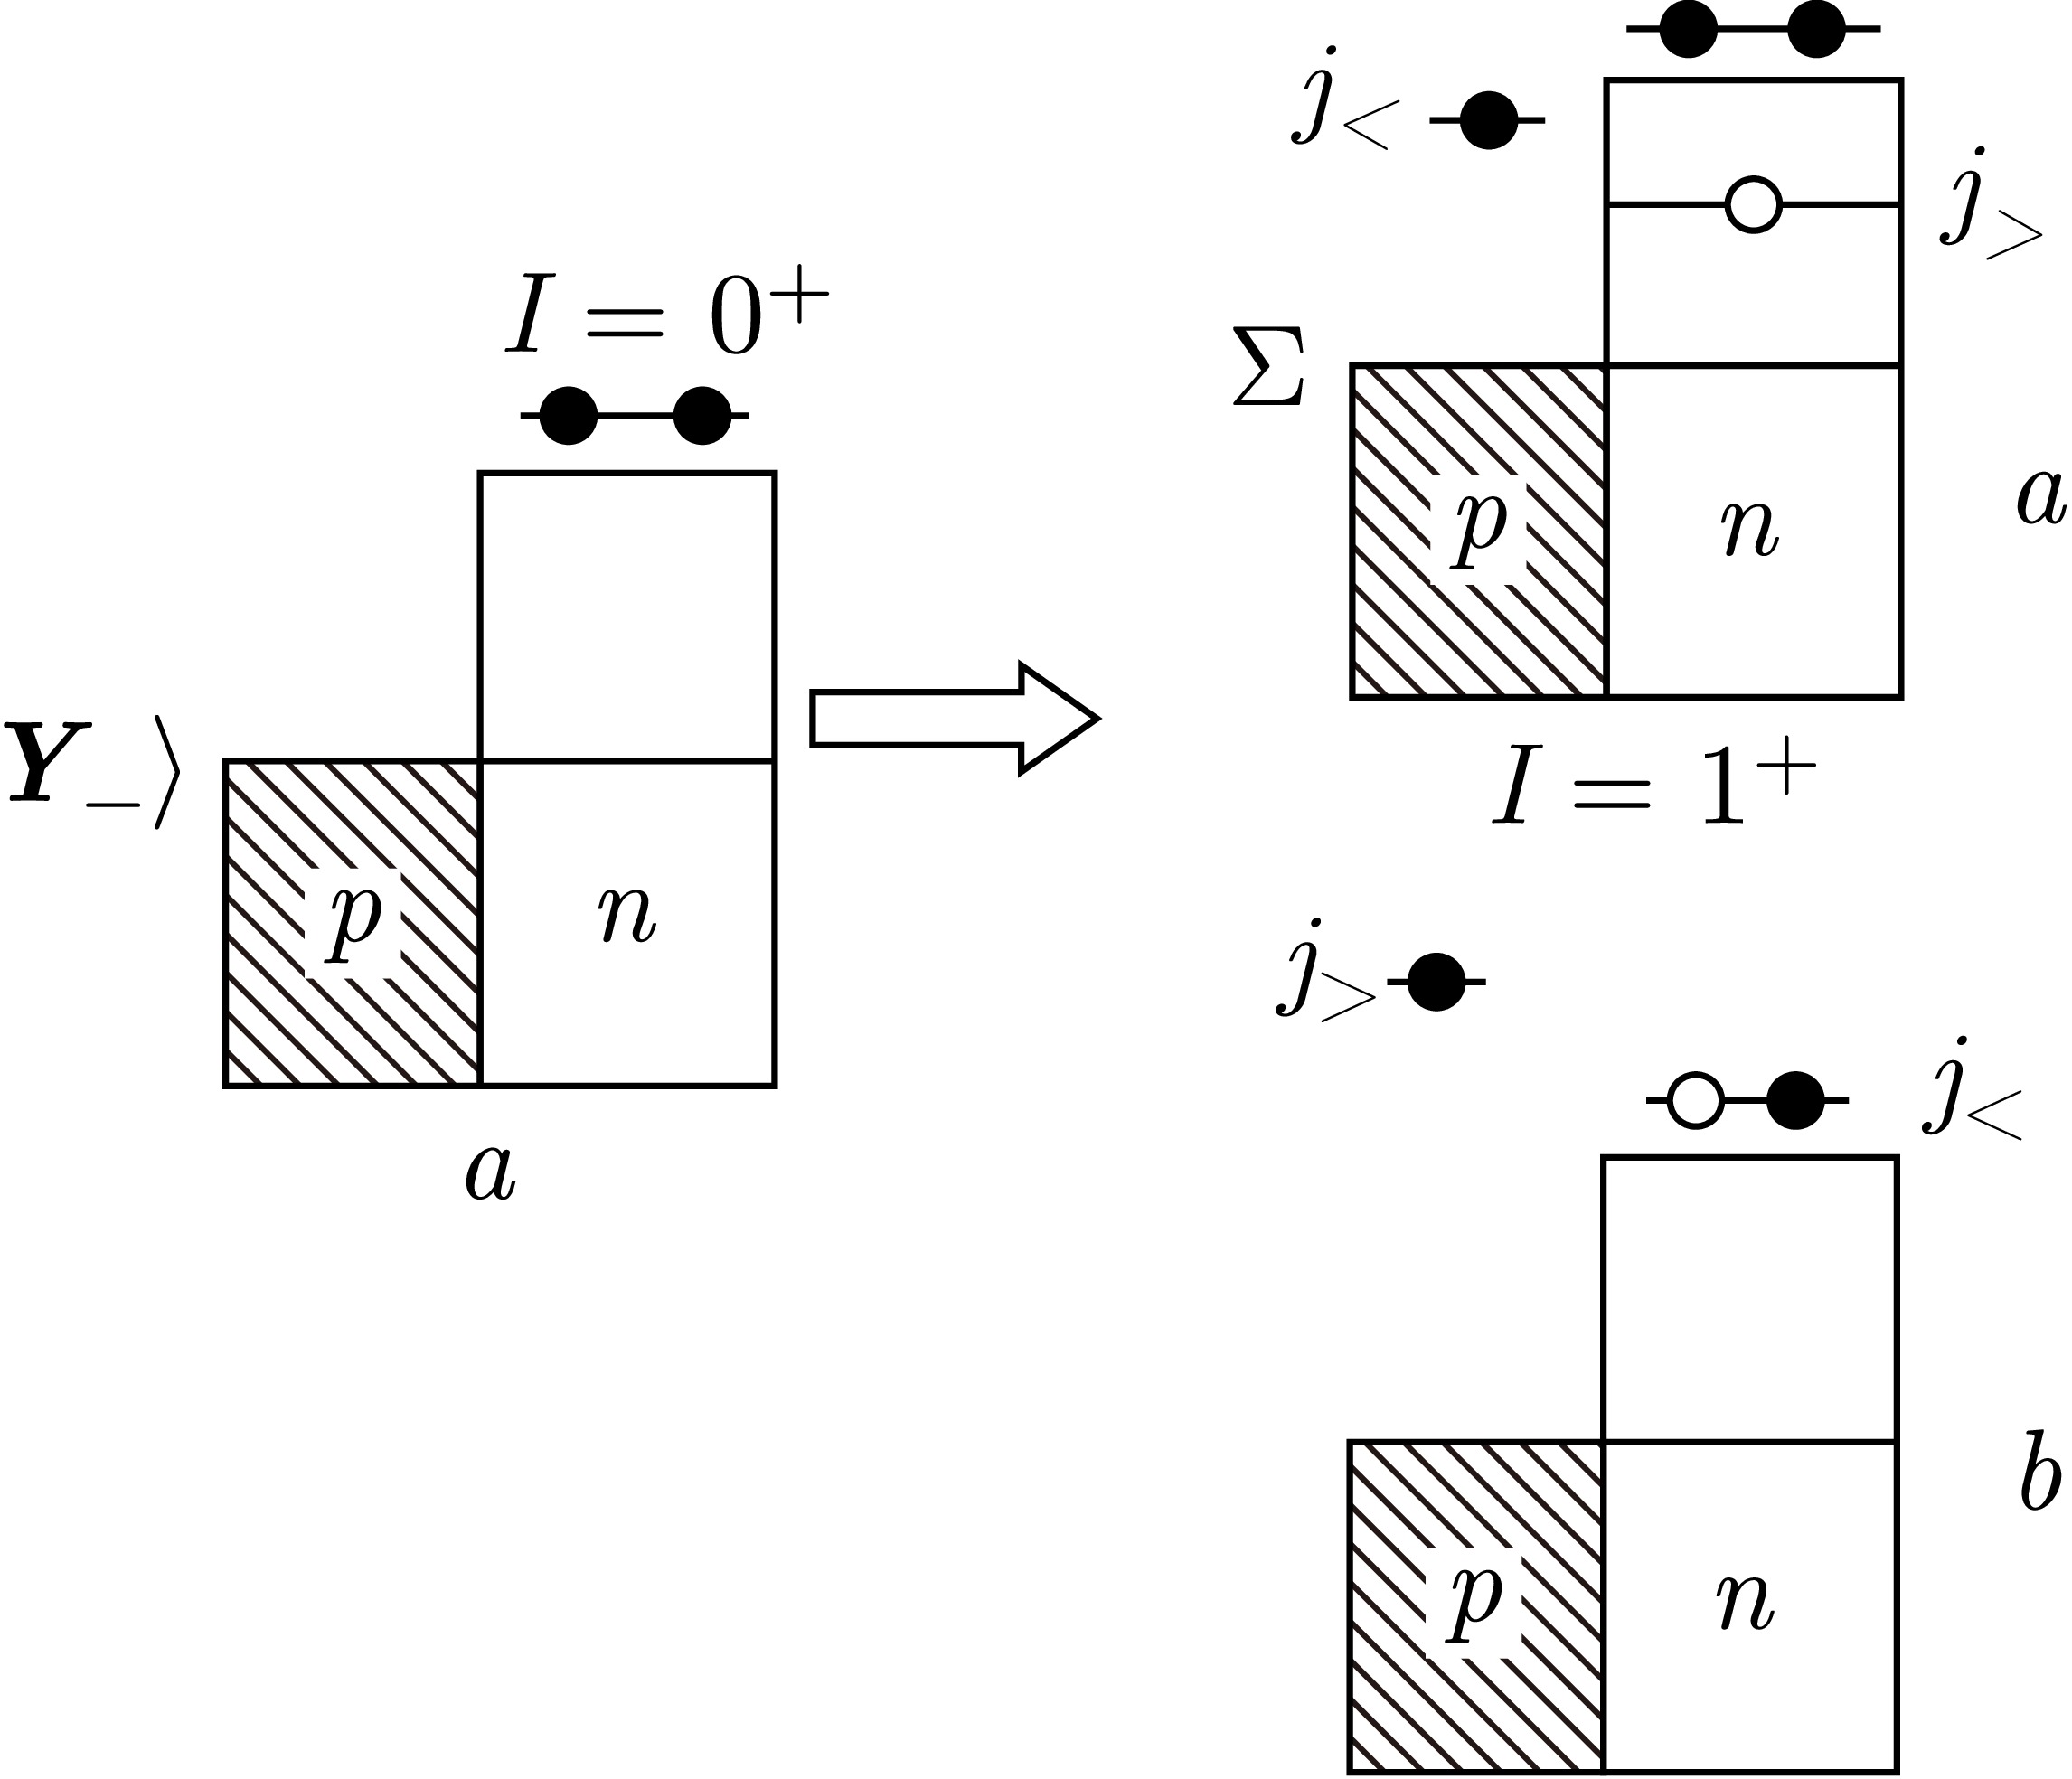
Figure 34. Structure of the SF states in halo nuclei. Proton particle–neutron hole coupled to form the spin-parity
$ I^{\pi} = 1^{+} $ and to form: a)$ nn $ Borromean halo component; b)$ np $ tango halo componentSince the operators of GT β-decay and
$ M1 $ γ-decay do not have spatial components (the radial factor in the$ M\lambda $ γ-transition operator is proportional to$ r^{\lambda-1} $ ), GT β-transitions and$ M1 $ γ-transitions between states with similar spatial shapes are enhanced. When the ground state does not exhibit halo structure, but an excited state may have it, isomer formation (halo-isomers) can occur [18].The IAS in 6Li has a Borromean structure because the
$ n{-}p $ subsystem is coupled to angular momentum$ J = 0^{+} $ , i.e., unbound, whereas the$ n{-}p $ subsystem for the ground state of 6Li is coupled to angular momentum$ J = $ $1 ^{+} $ , i.e., bound. According to halo classification, such a structure of the ground state of 6Li corresponds to a tango-halo. Since the IAS in 6Li has a Borromean structure,$ M1 $ γ-decay of the IAS would be hindered [18, 20−22] if the ground state of 6Li did not have a halo structure (Fig. 35).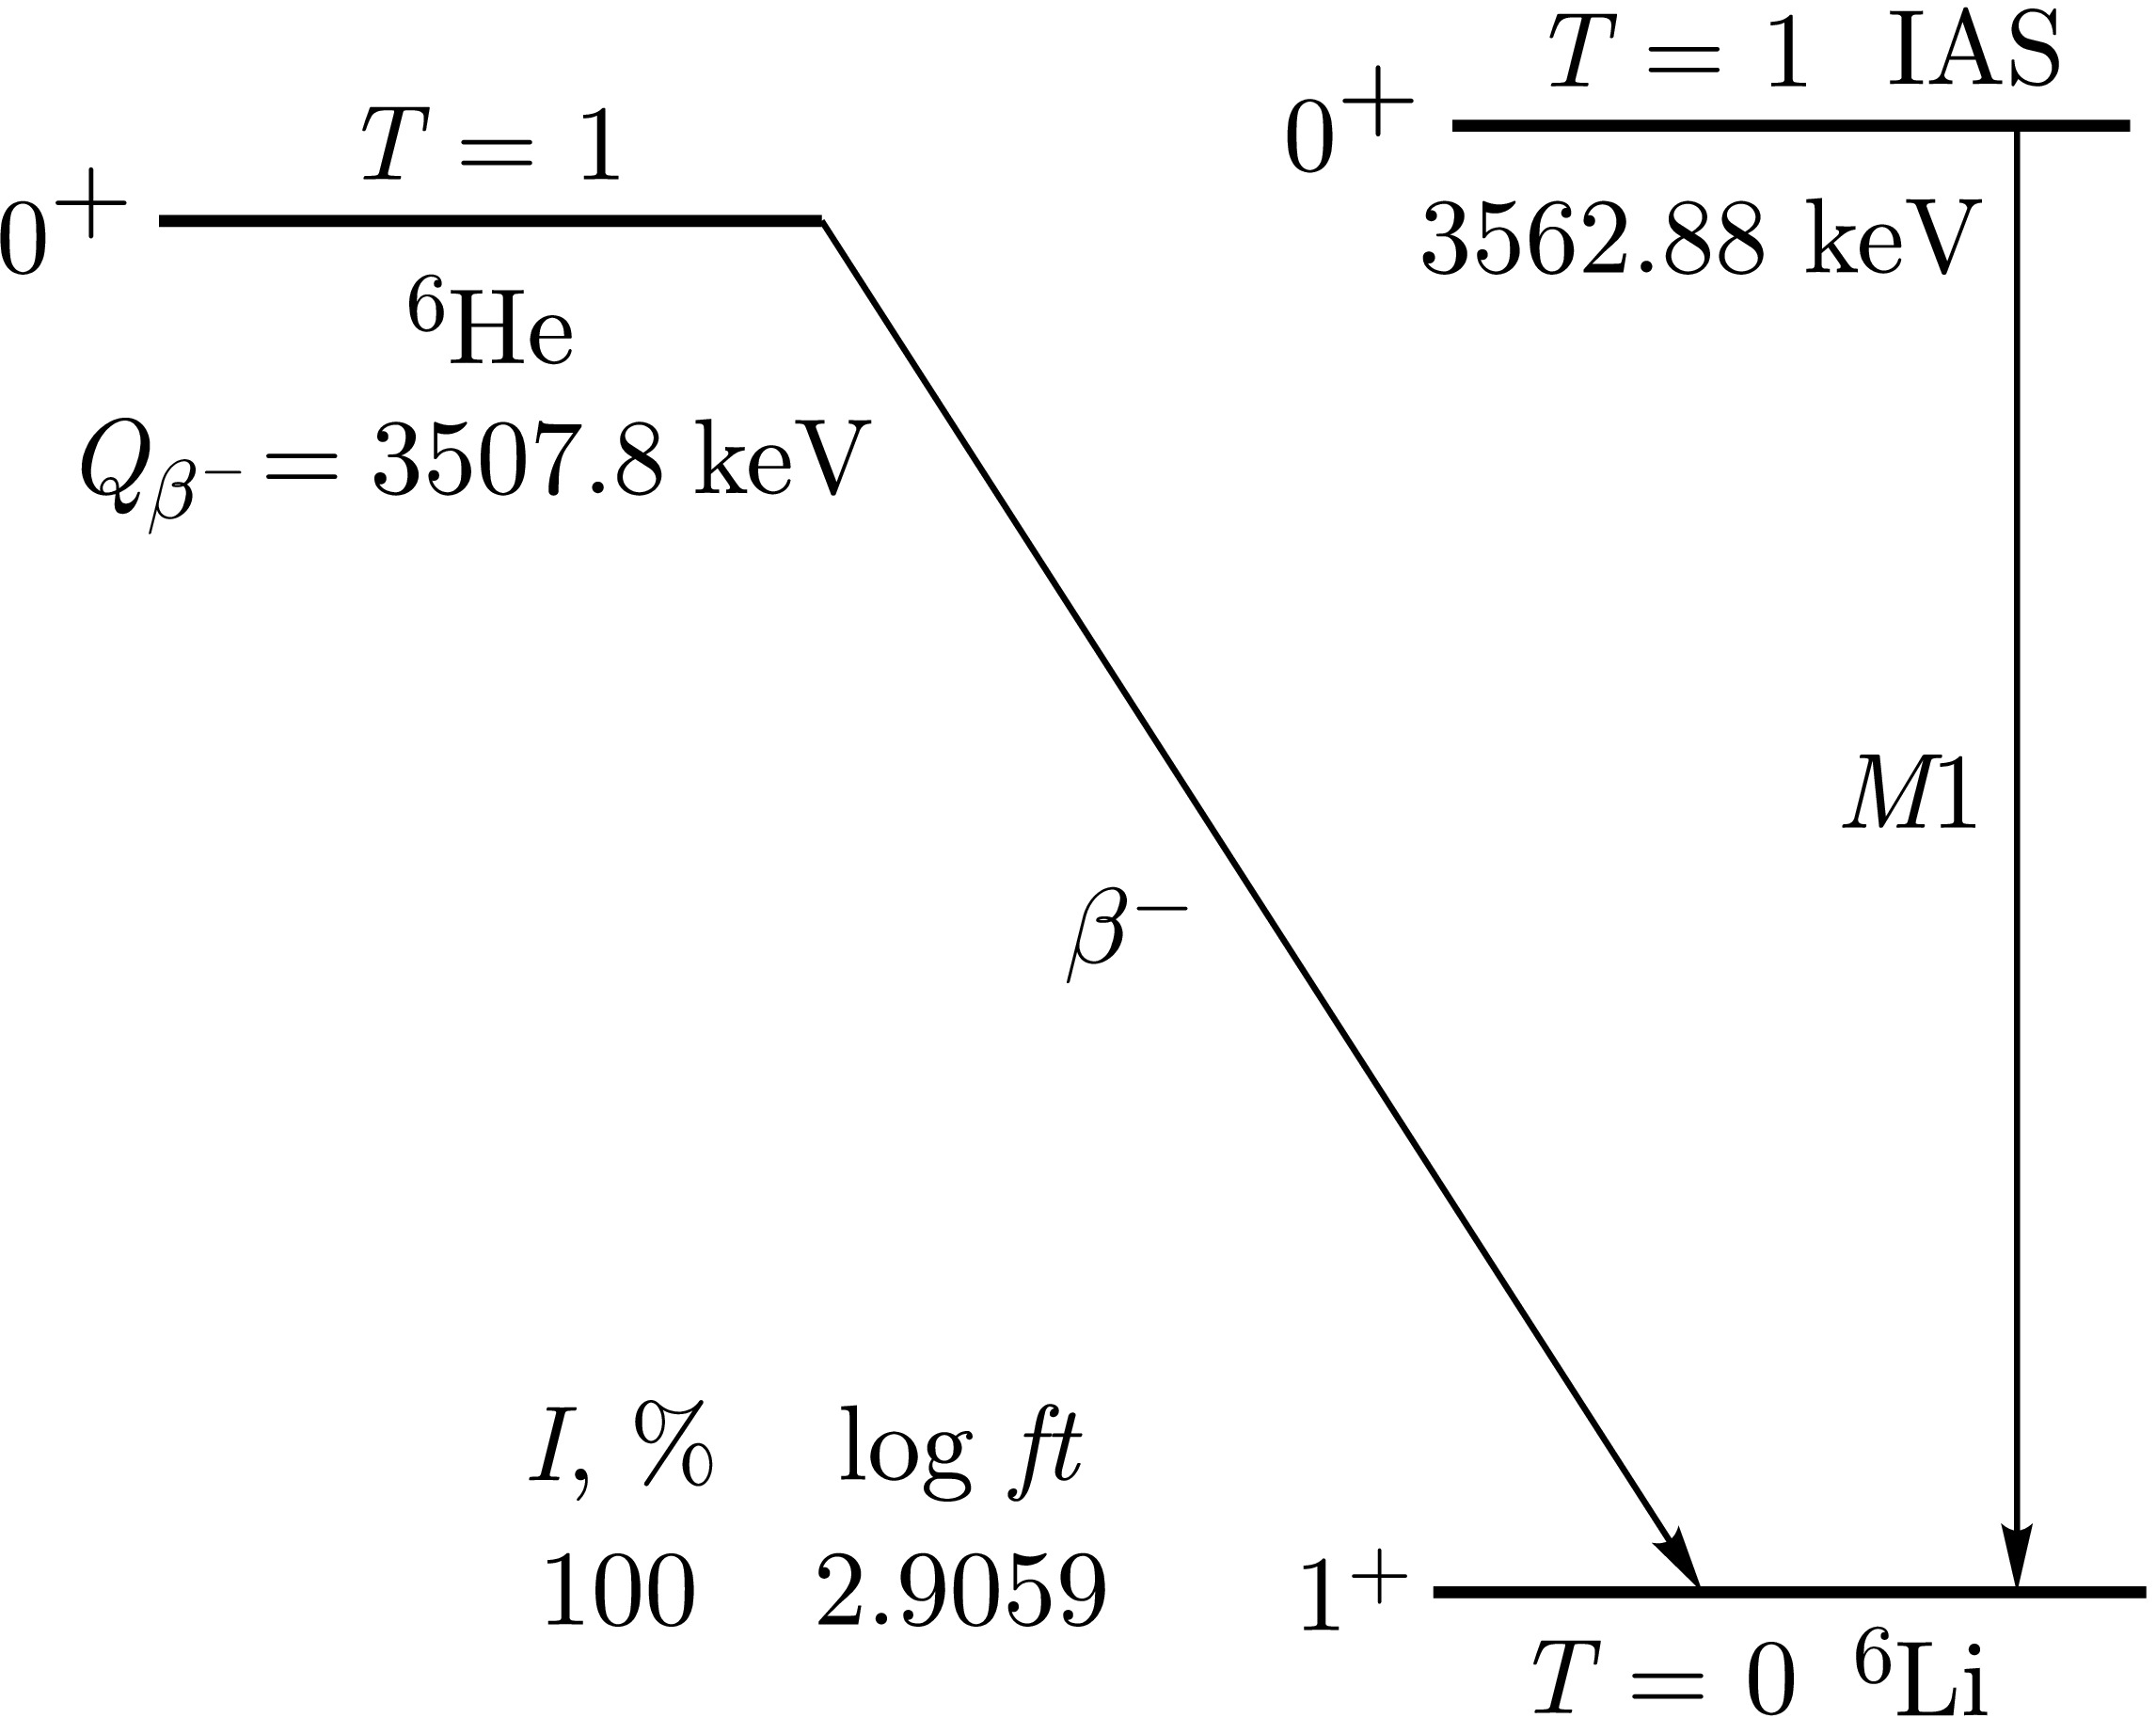
Figure 35.
$ ^{6} {\rm{He}}$ β-decay and$ M1 $ γ-decay of corresponding IASThe
$ ft $ value for GT β-decay of the parent nucleus (6He in the g.s.) and the reduced probability$ B(M1, \sigma) $ for γ-decay of the isobaric analogue state (6Li,$ E = 3562 $ keV) are related [20−22, 63] by the Eq. (25).$ ft = 11\,633/[T_{0} \cdot B(M1, \sigma)], $
(25) where
$ T_{0} $ is the isospin of the isobaric analogue state,$ ft $ is expressed in seconds, and$ B(M1, \sigma) $ is expressed in units of nuclear magnetons$ (\mu _{0})^{2} $ , for$ M1 $ γ-transitions$ {\text {W.u.}} = 1.79(\mu_{0})^{2} $ . As a result, it turned out that$ B(M1,\sigma) = 8.2 $ W.u. This means that the$ M1 $ γ-decay of the isobaric analogue state in 6Li is enhanced. From the experimental value [29]$ t_{1/2} = $ $ (806.7\pm 1.5) $ ms, log$ ft = 2.9059 $ and using Eqs. (10–13), we determine that$ B({\text{GT}}) = (7.63\pm 0.07)g_{V}^{2}/4\pi $ for the GT$ \beta^{-} $ -decay of 6He (Σ (Ikeda sum rule)$ = $ $ 6(g_{A{\text{eff}}})^{2}/4\pi) $ , i.e., the$ \beta^{-} $ -decay is also strongly enhanced. These experimental facts support the hypothesis that the ground state of the nucleus 6Li has a tango-halo structure [20−22].For nuclei with
$ |N-Z| \gg 0 $ , the maximum excitation energy corresponds to the main resonance in$ S_{\beta}(E) $ (Figs. 2 and 36). Other, weaker resonances (pygmy resonances) have lower excitation energies. This type of$ S_{\beta}(E) $ occurs for 11Be. Since the GT strength B(GT) for the resonance at energy 18.19 MeV ($ B({\text{GT}}) = 21.8(g_{V})^{2}/4\pi $ , Fig. 36) has a large value, we conclude that this resonance ($ E = 18.19 $ MeV) in 11Be corresponds to the GTR. For 11Be we have [29]$ E_{\text{IAR}} = 21.16 $ MeV, i.e.,$ E_{\text {GTR}} \lt E_{\text{IAR}} $ . GT-type resonances were not observed in 11Be at excitation energies above$ Q_{\beta} $ . The total strength of all observed β-decay transitions of 11Li is quite large according to the Ikeda sum rule. For nuclei with$ |N-Z| \gg 0 $ , theory predicts the maximum excitation energy for the main resonance (GTR) [4, 6, 11] in$ S_{\beta}(E) $ . If any additional GT-type resonance existed at excitation energy above 18.19 MeV, it would have, since$ |N-Z| \gg 0 $ , comparable strength to the 18.19 MeV resonance. In such a situation, we would obtain an additional large GT strength and a very strong modification of$ g_{A{\text{eff}}} $ in contradiction with systematics [25]. We neglected the possible contribution of experimentally unobserved GT strength at energy above 18.19 MeV in 11Be to the Ikeda sum rule. Comparing the experimental value [20−22, 29] of the total sum B(GT) with the Ikeda sum rule Eqs. (10-–13), we obtained [20−22] that$ (g_{A{\text{eff}}}/g_{V})^{2} = 1.5 \pm 0.2 $ for 11Li.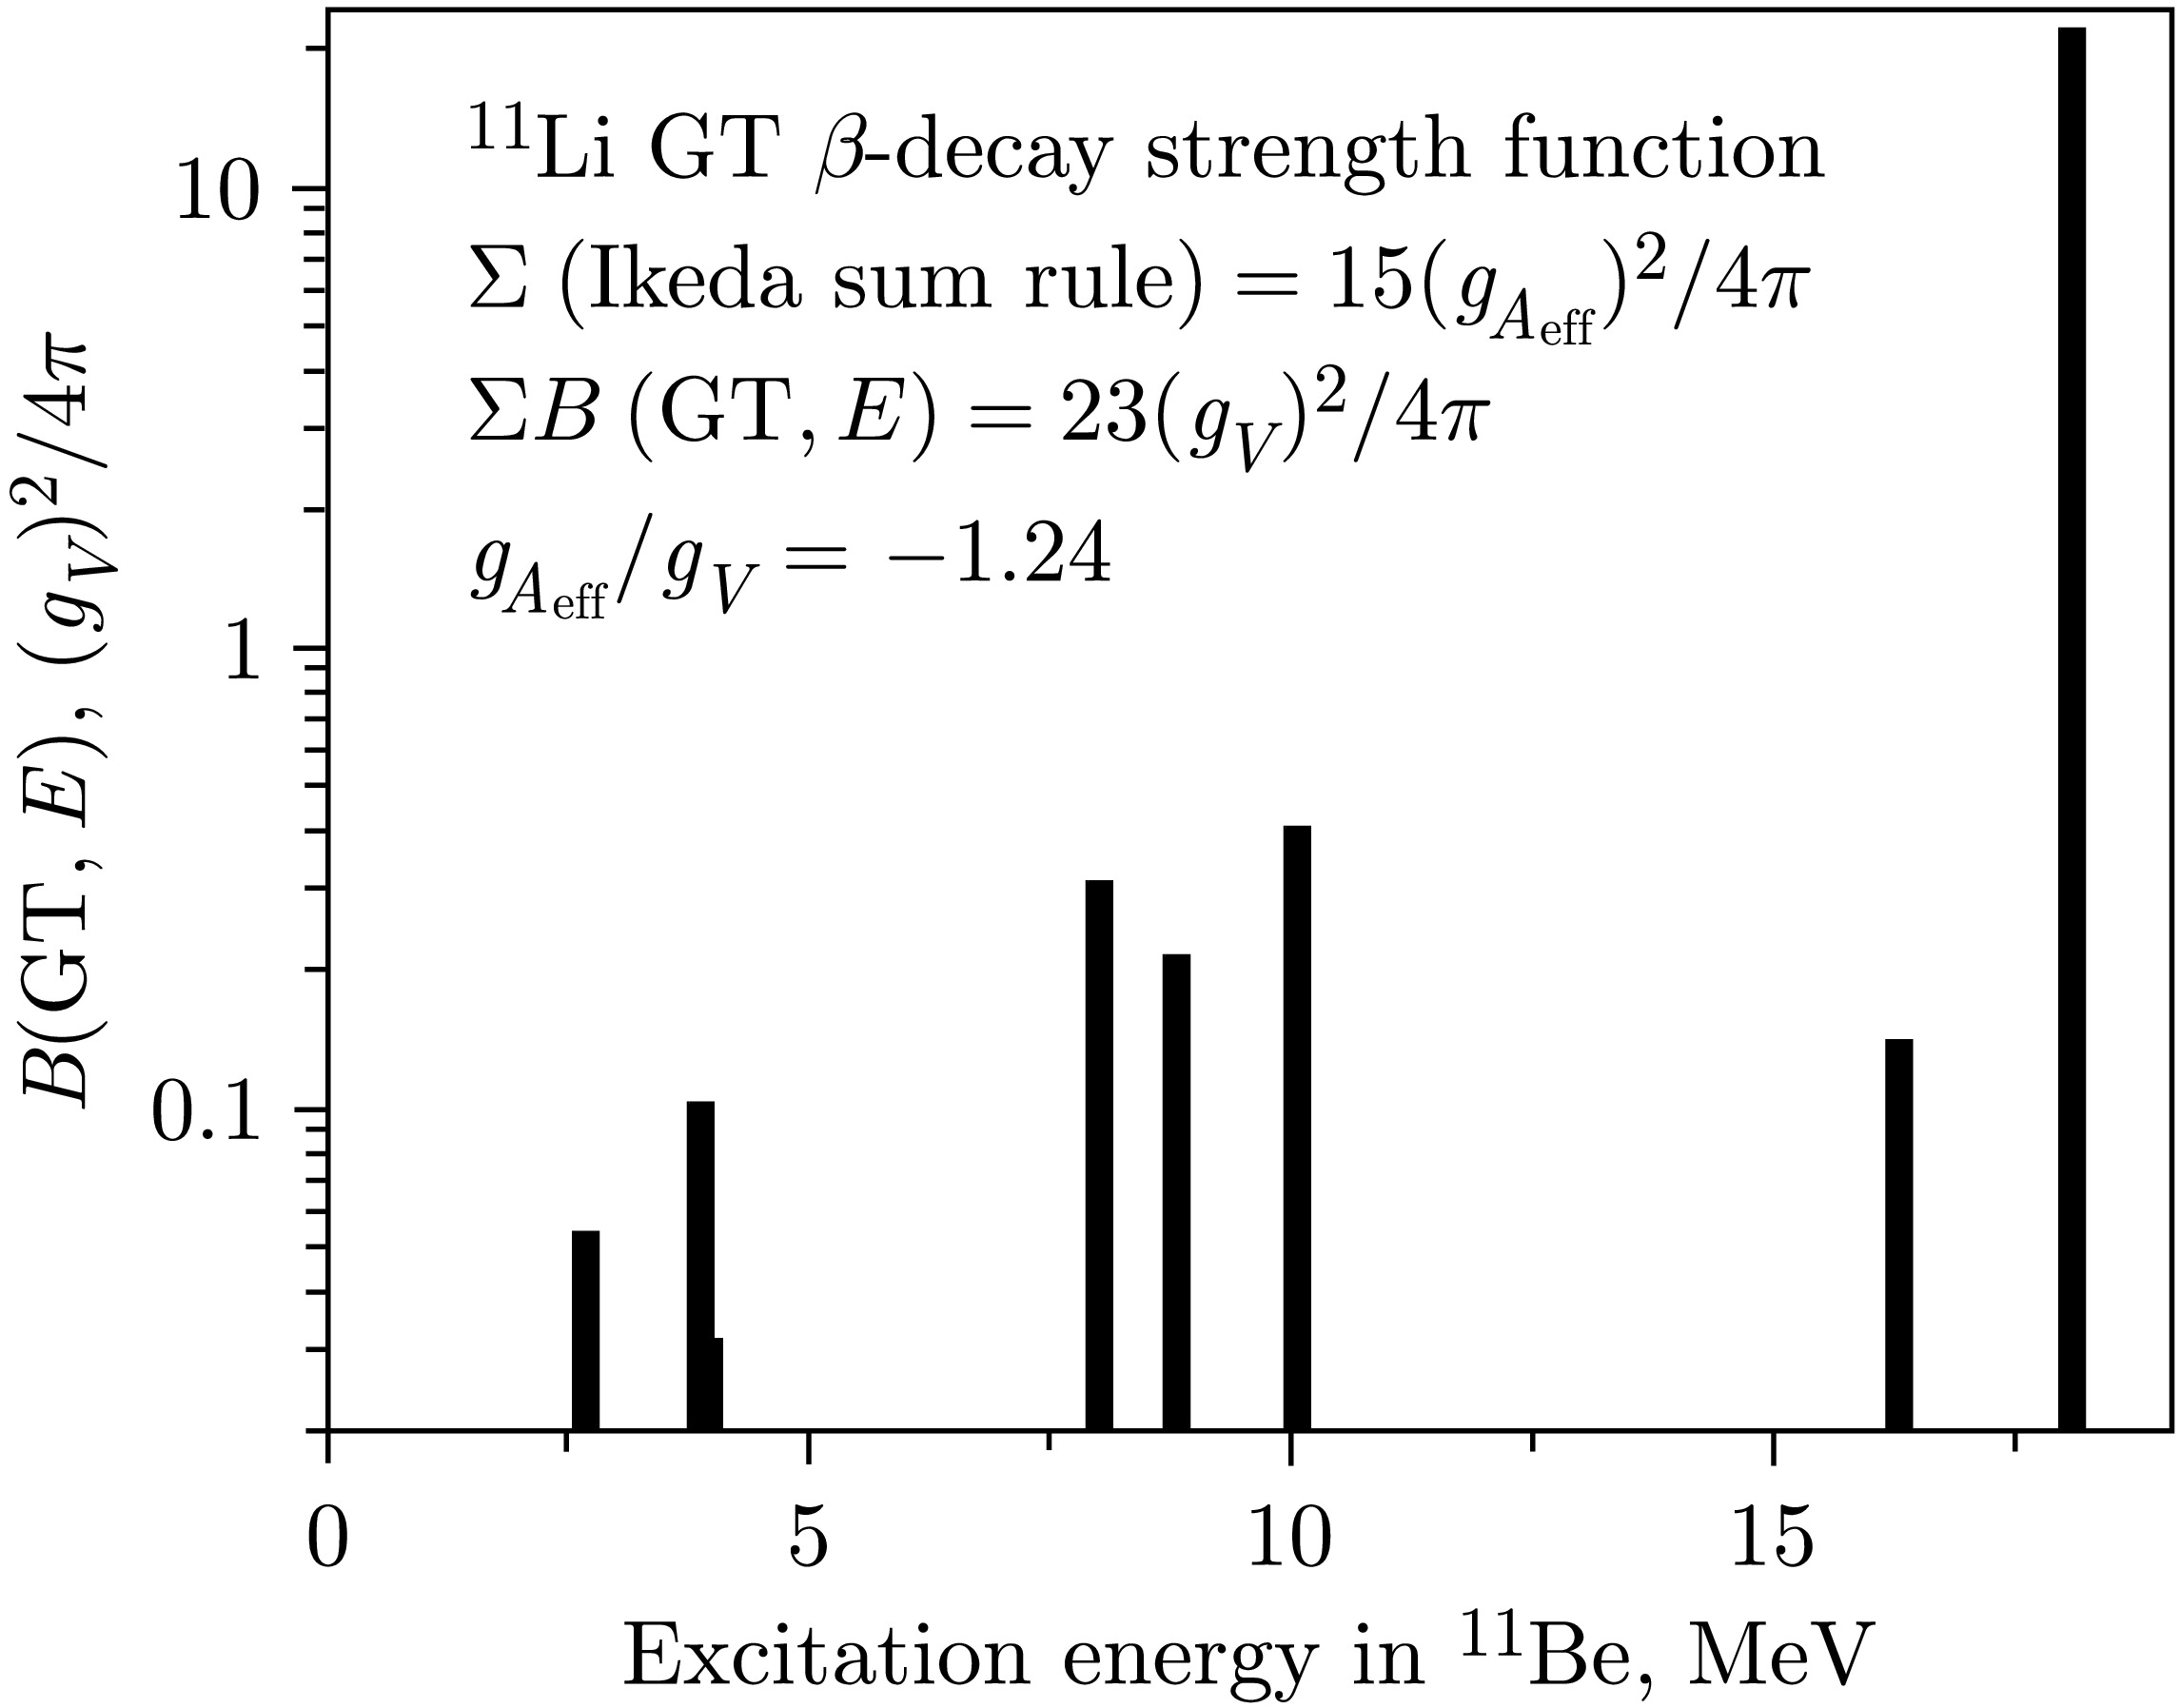
For nuclei with
$ N\approx Z $ (6Li), the structure of$ S_{\beta}(E) $ can have the opposite type, i.e., the minimum [20−22, 64−66] excitation energy corresponds to the main resonance in$ S_{\beta}(E) $ . This type of$ S_{\beta}(E) $ occurs (Fig. 37) for$ \beta^{-} $ -decay of 6He$ \,\to\,{}^{6} {\rm{Li}}$ . Only one additional resonance$ I^{\pi} = 1^{+} $ with excitation energy 5.65 MeV was observed in 6Li [29]. The value B(GT) for this resonance was not measured. Theoretical estimation [24] gives a small B(GT) for the 5.65 MeV resonance, and we neglected its contribution to the Ikeda sum rule. Comparing the experimental value$ B({\text{GT}}) = (7.63 \pm 0.07)\,g_{V}^{2}/4\pi $ with the Ikeda sum rule (Eqs. (10–13)) Σ$ B({\text{GT}}) = 6(g_{A{\text{eff}}})^{2}/4\pi $ , we obtained [20–22] that$ (g_{A{\text{eff}}} $ /$ g_{V})^{2} = 1.272 \pm 0.010 $ for 6He.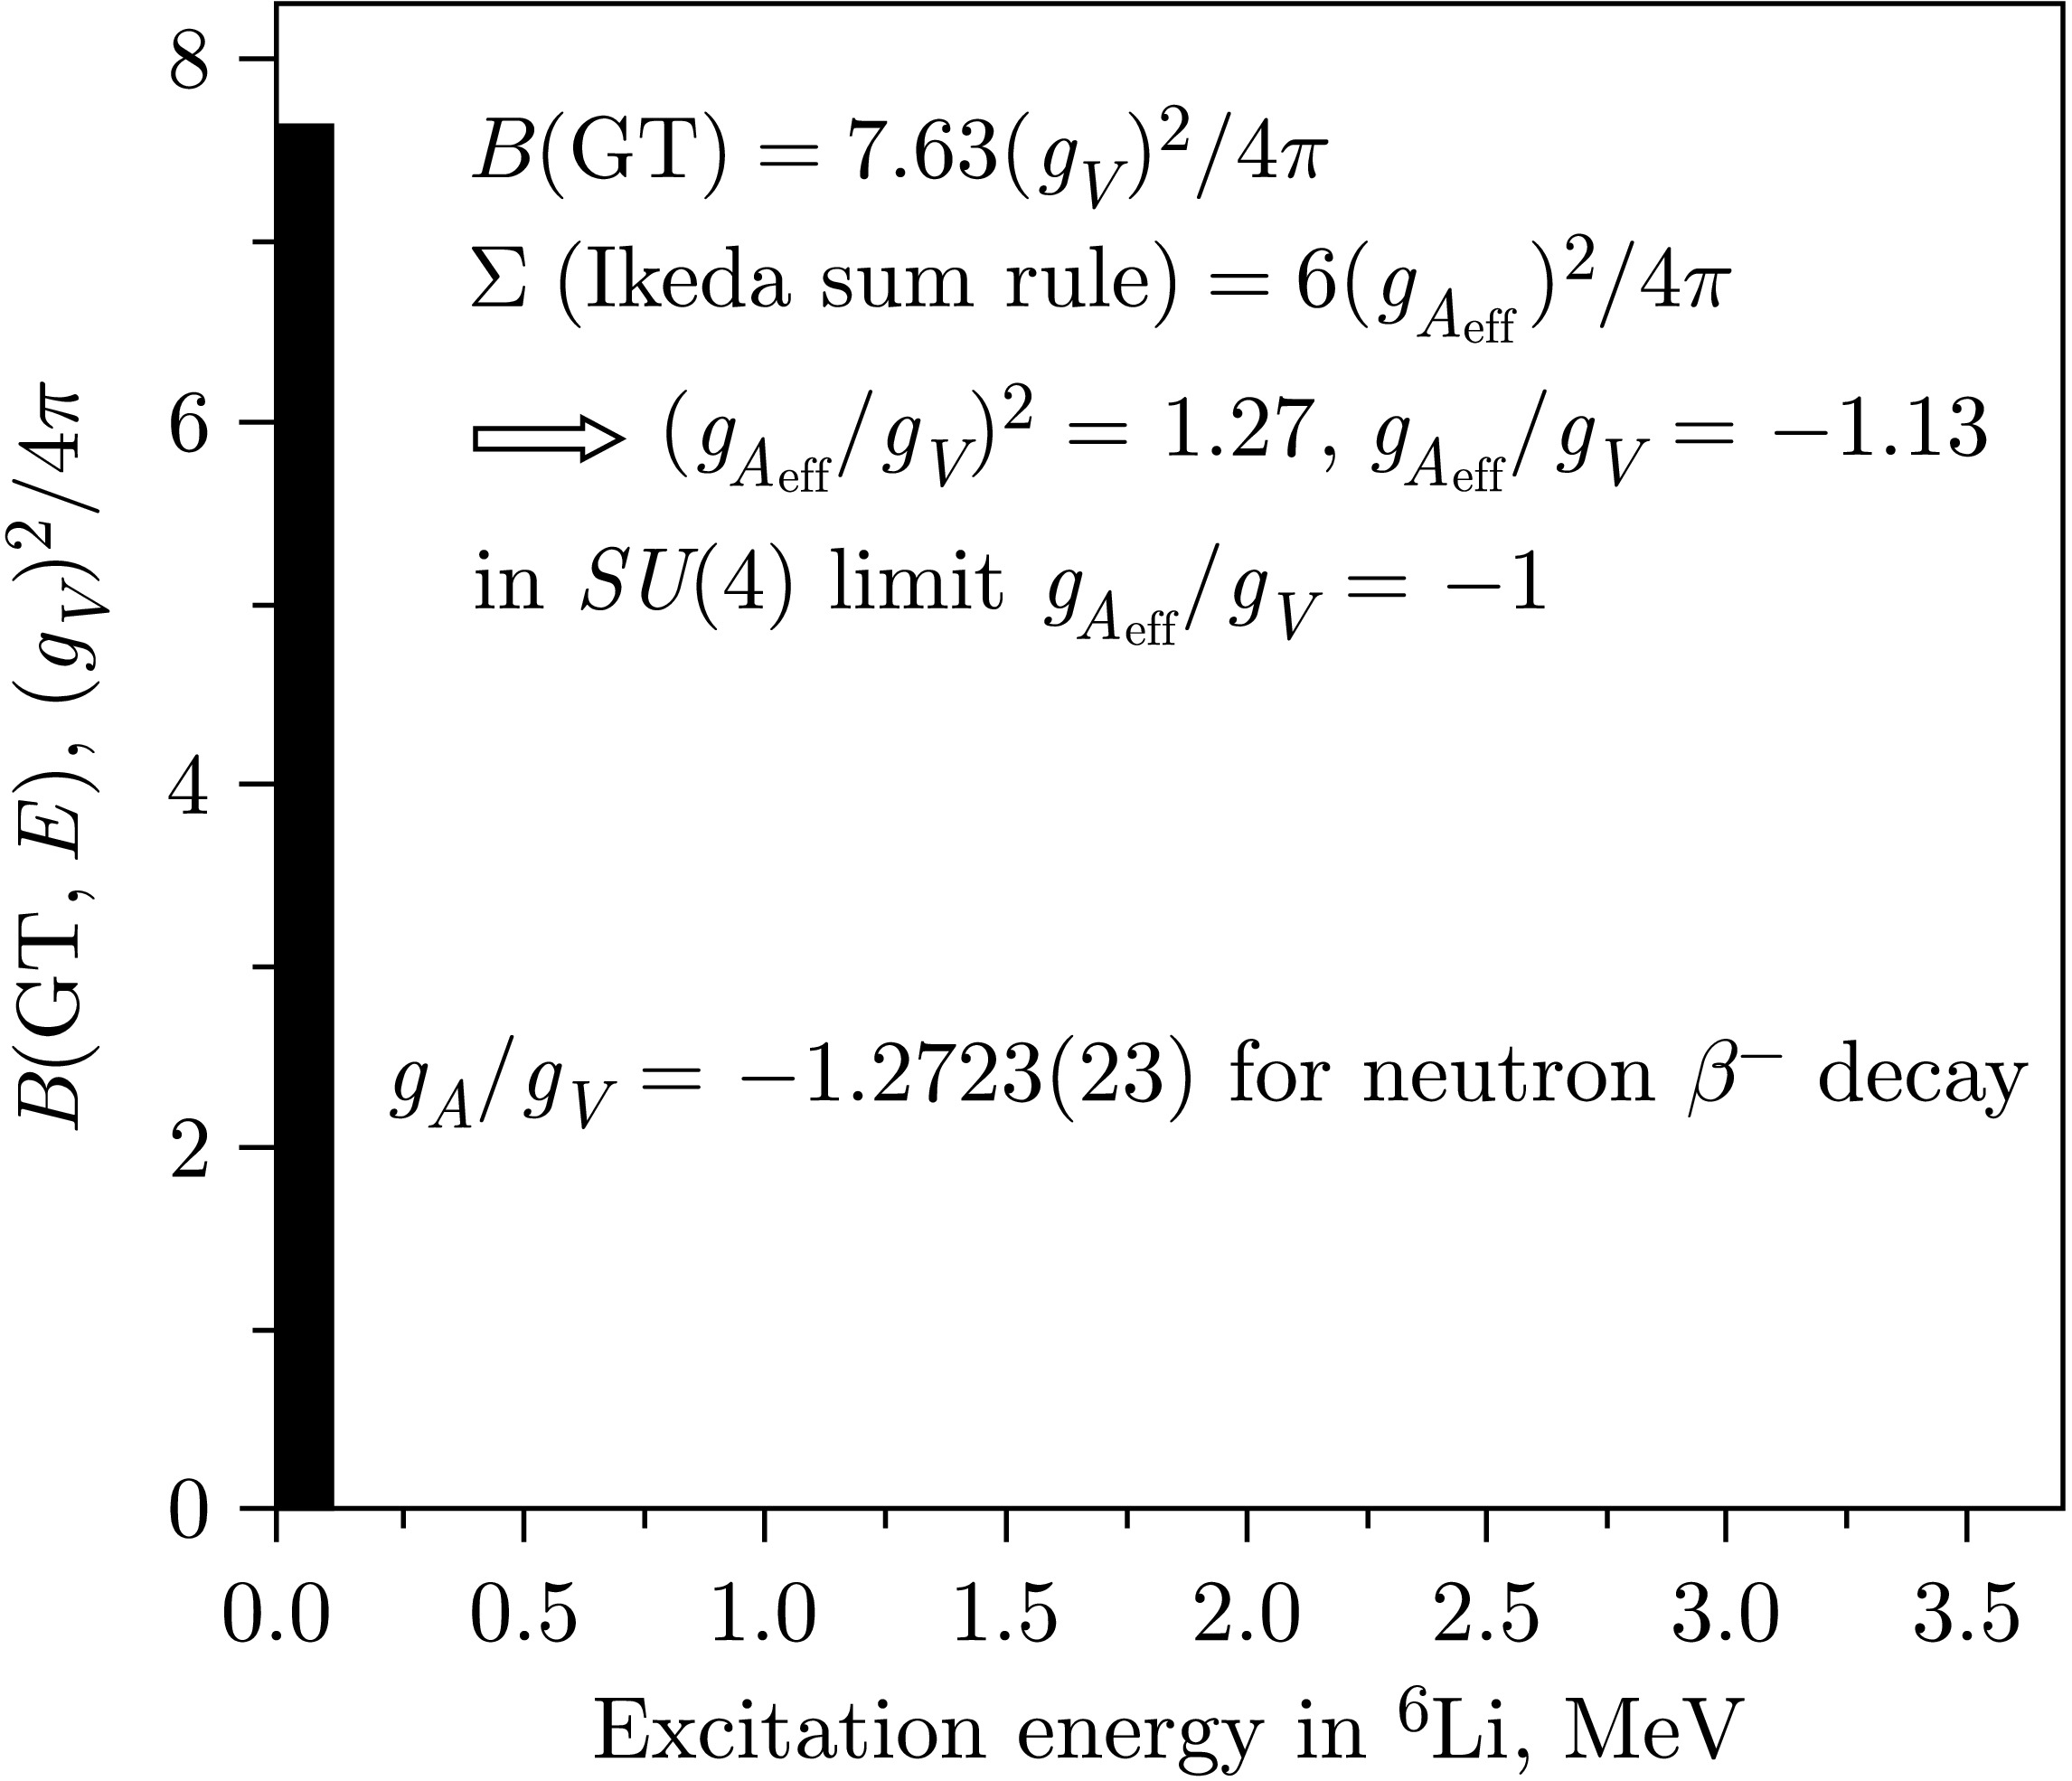
For the free nucleon [25], the value
$ g_{A{\text{free}}}/g_{V} = -1.2723(23) $ . Renormalization of$ g_{A} $ , arising from nuclear model effects, depends on the chosen theoretical scheme for describing the many-particle wave functions involved in weak processes. That is why effective values$ g_{A{\text{eff}}} $ can vary from one nuclear model to another. The origin of the quenching of the$ g_{A} $ magnitude is not fully known [25], and various mechanisms for its origin have been proposed, including tensor effects, admixture of ∆-isobars to the nuclear wave function, relativistic corrections to the Gamow-Teller operator, etc., but a clean separation of these aspects is difficult. Also, experimental methods for determining the quenching factor can have significant uncertainties in many cases. One model-independent method for determining$ g_{A{\text{eff}}} $ is comparing the experimental total GT beta-decay strength with the Ikeda sum rule. To apply this method, it is necessary to have the total GT strength within the energy window allowed for β-decay. Such a situation may be realized for β-decay of halo nuclei (11Li, 6He) or for very neutron-rich nuclei where$ E_{\text {GTR}} \lt E_{\text{IAR}} $ .In the case of exact Wigner spin–isospin
$ SU(4) $ symmetry, the energies of IAR and GTR are degenerate, and we can expect that$ E_{\text{IAR}} \approx E_{\text{GTR}} $ . In experimental and theoretical analysis of GTR data, a tendency of convergence of GTR and IAR energies (Fig. 38) with increasing$ (N-Z)/A $ has been noticed [4, 6, 11, 20−22]. This fact may be interpreted as an approximate realization of$ SU(4) $ symmetry in a certain nuclear region, namely for nuclei with large$ (N-Z)/A $ , where spin–isospin$ SU(4) $ symmetry determines nuclear properties (the$ SU(4) $ region). From a simple estimate (Fig. 38), it follows that the value$ Z/N \approx 0.6 $ corresponds to the$ SU(4) $ region [20−22, 67]. An interesting feature shown in Fig. 37 is that the GTR energy is lower than the IAR energy for very neutron-rich nuclei. There is a more complex dependence of$ E_{\text {GTR}}-E_{\text{IAR}} $ on$ (N-Z)/A $ than linear, for nuclei far from the β-stability line. The shell model [68, 69] also predicts that the GTR energy can be lower than the IAR energy, i.e.,$ E_{\text {GTR}} - E_{\text{IAR}} \lt 0 $ for very neutron-rich nuclei. Thus, it is interesting to measure in more detail the evolution of$ E_{\text {GTR}}-E_{\text{IAR}} $ for neutron-rich nuclei far from the β-stability line. -
Modern advances in experimental techniques allow using nuclear spectroscopy methods with high energy resolution to investigate the fine structure of
$ S_{\beta}(E) $ . High-resolution nuclear spectroscopy techniques, like TAGS techniques, provide convincing evidence of the resonant structure of$ S_{\beta}(E) $ for GT β-transitions in both spherical and deformed nuclei. With these techniques, it became possible to experimentally demonstrate the resonant nature of$ S_{\beta}(E) $ for FF β-transitions and to reveal the splitting of the peak in the strength function for GT$ \beta^{+} $ /EC-decay of deformed nuclei into two components. This splitting indicates anisotropy in oscillations of the isovector density component$ \rho_{\tau =1,\,\mu =1} $ . High-resolution nuclear spectroscopy techniques in combination with TAGS techniques allow effectively identifying incompleteness of nuclear decay schemes. They also allow finding regions of nuclear excitation energies where the intensity of FF$ \beta^{+} $ /EC-transitions is comparable to or even higher than that of GT$ \beta^{+} $ /EC-transitions.After GT
$ \beta^{-} $ -decay of a parent state with an$ nn $ Borromean halo structure or after$ M1 $ γ-decay of an IAR with an$ np $ Borromean halo structure, states with an$ np $ tango-halo structure or a mixed structure$ np $ tango halo$ \,+\,nn $ Borromean halo can be populated. Resonances in the GT beta-decay strength function$ S_{\beta}(E) $ of halo nuclei can have an$ np $ tango-halo structure or a mixed structure$ np $ tango halo$ \,+\,nn $ Borromean halo. Correct interpretation of halo structure is important in experiments studying β- and γ-decay and in analysis of charge-exchange nuclear reactions. Halo with different structure can be observed for excited states and resonances in both neutron-rich and proton-rich nuclei. Difference in halo structure for excited states of nuclei (or excited and ground states) can lead to formation of halo-isomers.It now seems important to develop theoretical models and methods for calculating
$ S_{\beta}(E) $ with more detailed accounting for deformation of atomic nuclei. Obtaining experimental data on the structure of strength functions for both GT and FF β-transitions in spherical and deformed nuclei is important for further improvement of theoretical approaches to calculating$ S_{\beta}(E) $ .Analysis of the full set of experimental and theoretical results presented in this review unambiguously shows that non-statistical effects associated with elementary modes of nuclear excitations are present in nuclei. Only by taking into account non-statistical effects is it possible to correctly describe a large number of processes occurring in nuclei and nuclear reactions. It is expected that non-statistical effects will manifest more strongly in nuclei far from the β-stability line, especially in the region of Wigner spin–isospin
$ SU(4) $ symmetry.Maxima in the beta-decay strength function (GTR and its satellites, resonances for FF β-transitions) are a particular case of manifestation of the structure of charge-exchange excitations. The GTR and its satellites can manifest in beta-decay of atomic nuclei, in direct charge-exchange nuclear reactions, in charge pick-up reactions, and in reactions with the formation of compound nuclei [4, 53, 70–73].
It is of significant interest to conduct experimental and theoretical investigations of charge-exchange excitations of various types and manifestations of coherent effects associated with the resonant structure of both charge-exchange [72] and charge pick-up [73] resonances. Also very attractive is investigating excitation of the GTR and its satellites in reactions with heavy ions. Therefore, one can hope for qualitatively new facts and ideas about nuclear structure and nuclear reactions, as is usually the case when new experimental capabilities appear and new phenomena are investigated.
Structure of the β-Decay Strength Function
- Received Date: 2026-01-30
- Available Online: 2026-06-01
Abstract: An analysis of experimental data on measurements of the resonant and fine structure of the β-decay strength function $S_{\beta}(E)$ in spherical, transitional, deformed, and halo nuclei has been conducted. Modern nuclear spectroscopy methods have revealed peak splitting in $S_{\beta}(E)$ for Gamow–Teller (GT) type β-transitions, caused by nuclear deformation. The resonant structure of $S_{\beta}(E)$ for first-forbidden (FF) β-transitions has been experimentally confirmed in both spherical and deformed nuclei. It is shown that at certain nuclear excitation energies, FF β-transitions can reach intensities comparable to those of GT β-transitions. An analysis of the evolution of the energy difference ($E_{\text {GTR}}{-}E_{\text {IAR}})$ between the Gamow–Teller resonance (GTR) and the isobaric analogue resonance (IAR) with increasing neutron excess in nuclei has been performed. A region exhibiting Wigner spin–isospin $SU(4)$ symmetry has been predicted.
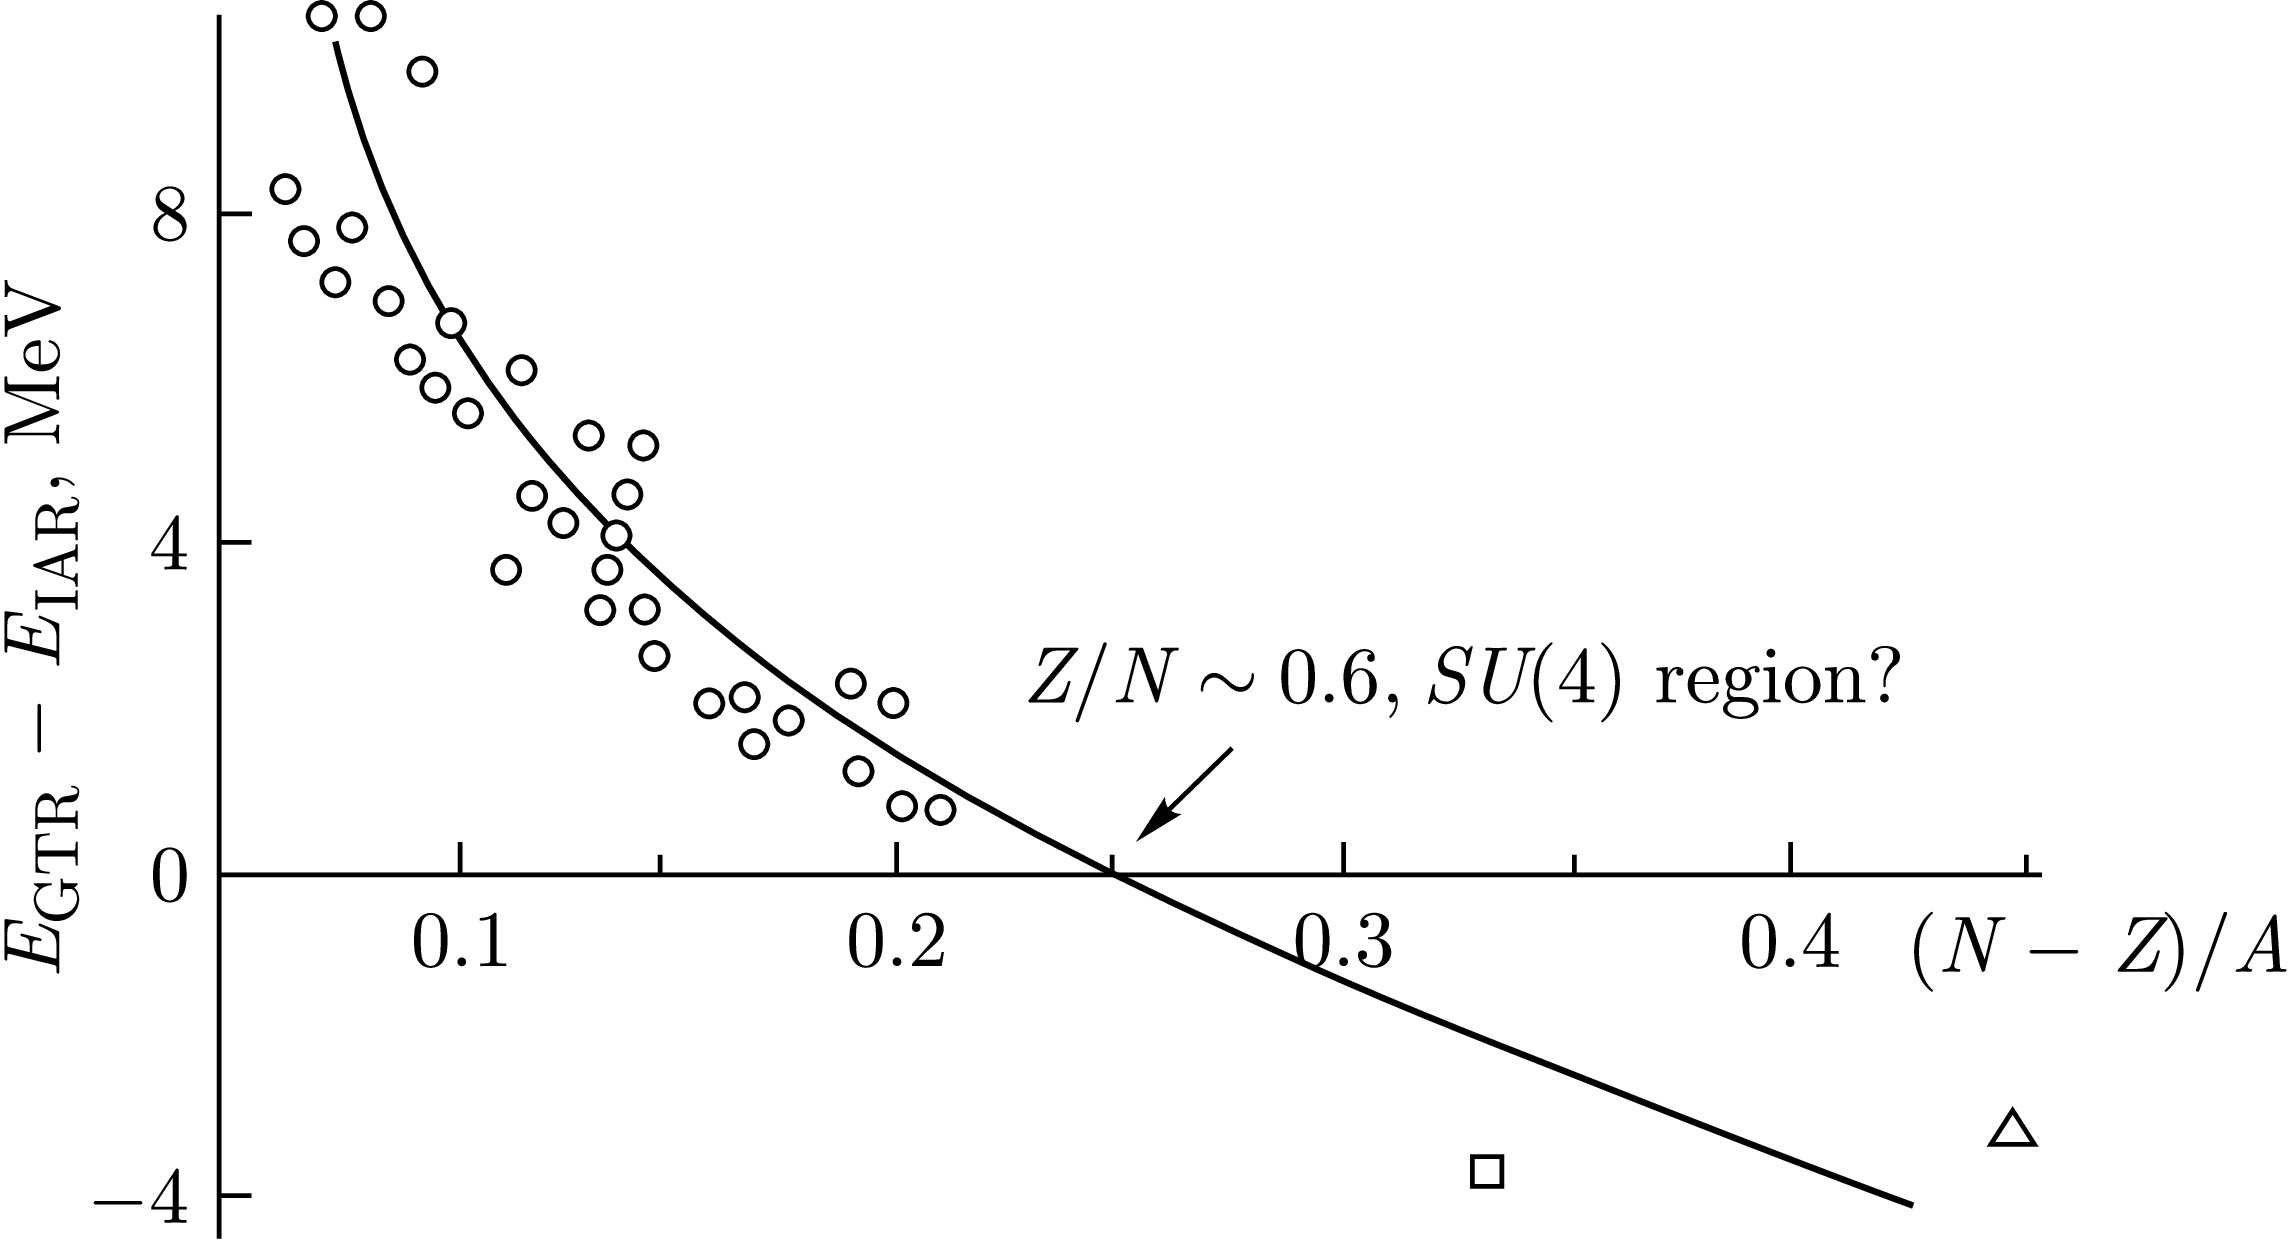


 DownLoad: